


 Inglés (pdf)
 Articulo en XML
 Referencias del artículo
 Enviar articulo por email
 Citado por SciELO
  Similares en
SciELO
Similares en
SciELO  uBio
uBio 
 Permalink
Introduction
Tropical riverine fisheries support millions of people with food, nutrition, livelihood etc. (Vass et al., 2011; Sarkar et al., 2019) and hence contributing indirectly to a large extent to the national economy of the associated countries, especially India. The Ganga river basin has already witnessed anthropogenic pressure due to deforestation, water abstraction, irrational fishing, mining, industrialization, economic development, navigational movements (Das Sarkar et al., 2019a). Changes in the climatic regime such as increased water temperature, uncertain monsoon variation and increased rate of abnormal climatic events in the coastal area have been the recent addition. Synergistically, these affect the ecosystem biota, productivity and ultimately livelihood security (Sharma, Joshi, Naskar, & Das, 2015) of poor fishermen.
Primary production in an aquatic system depends on phytoplankton biomass, the food for planktivorous fishes. It is also a parameter hinting overall system productivity. Chlorophyll is the green colouring matter which enables photosynthesis to occur in the presence of light. Out of nine different types of chlorophyll, chlorophyll-a plays a major role in photosynthesis (Ji, 2017) and hence indicates phytoplankton biomass (Gregor & Marsalek, 2004). Although literature surveys indicate several studies on ecology and biodiversity of river Ganges (Manna et al., 2013; Roshith et al., 2018); however, the role of climatic variability and their impact on aquatic ecosystem using different biota are very scanty. Thus, in this rising scenario of global warming it is imperative to understand the impact of climatic variability on primary producers. Microalgae or phytoplankton form a valuable biological parameter in climate models (Ghosal, Rogers, & Wray, 2000). Climate change itself represents a complex combination of stressors, including alterations in temperature (Webb, Hannah, Moore, Brown, & Nobilis, 2008), elevated atmospheric CO2 (Field, Barros, Mach, & Mastrandrea, 2014), and increased frequency and intensity of droughts and extreme flow events (Barnett, Adam, & Lettenmaier, 2005; Milly, Dunne, & Vecchia, 2006). Changes in phytoplankton biomass vis-à-vis primary productivity in aquatic ecosystems resulting from climate change are often attributable to increased water temperatures and/or increased nutrient loading (Wrona et al., 2006). In recent years, the focus has been on predictive and/or trend identification modeling with either isolated or combined influence of an environmental driver or a set of drivers on phytoplankton biomass in rivers. The models developed by Elliot, Thackeray, Huntingford, & Jones (2005), Mooij, Janse, Domis, Hulsmann, & Ibelings (2007), Friberg et al. (2009) are some of the examples where the implications of warming water temperature on riverine phytoplankton biomass have been modeled. Such models formed the basis of the prediction made in Field et al. (2014) regarding the increase of primary productivity and tendency of eutrophication in majority of the global aquatic ecosystems.
Review of literature has revealed that studies on the climate driven changes on primary productivity and/or phytoplankton biomass in rivers have been mostly concentrated in temperate to sub-tropical climate (Klapper, 1991; Friberg et al., 2009; Sipkay, Kiss-Keve1, Vadadi-Fulop, Homoródi, & Hufnagel, 2012; Cloern, Foster, & Kleckner, 2014) and studies on tropically situated Indian rivers is absent. The only study in Indian context was in Bay of Bengal and Arabian sea that too not on the exact hypothesis per se but a related conclusion was drawn from their expert knowledge and extrapolating their results (Chaturvedi, Meghal, & Jasraj, 2013). Authors have hypothesized increased decadal changes of Chl concentration due to high nutrient influx through freshwater river drainage and increase in temperature due to global warming. However, authors have not developed quantitative relationship between Chl concentration and climate-environmental parameters. Although majority have reported an increase in primary production and/or phytoplankton biomass in rivers under future changed climate scenario, but few studies have indicated the opposite i.e. decreased riverine phytoplankton population under changed climatic scenario (Lewandowska & Sommer, 2010; Sommer & Lengfellner, 2008).
Modeling studies often face the problems of lack of required data and access to them which is considered one of the primary hindrances in climate change related modeling research (Porter et al., 2005; Sipkay, Kiss, Vadadi-Fulop, & Hufnagel, 2009). Developing countries like India have dearth of long-term data on riverine chlorophyll concentration or any aquatic system per se; although time series data of climatic variables are well maintained and abundantly available. The present approach explored an innovative and alternative methodology which could generate baseline information on trends and gross quantification of changes in Chl-a concentration in absence of long term data. Therefore, in the absence of long term and continuous data on Chlorophyll-a concentration in River Ganga, it is worthwhile to adopt a model-based framework to identify the key climato-environmental parameters and their isolated individual influences on phytoplankton biomass (Chl-a concentration); thereby, budgeted the Chl-a concentration considering the multiple linear effect of all the key environmental parameters identified. For budgeting, the direct cascading effect of regional climate change (increasing mean air temperature and decreasing rainfall) on influential environmental parameters were first quantified individually and then plugged together to obtain the estimates of changes expected in Chl-a concentration as per the present trend of changing climate within the study area.
In the present study, the photosynthetic pigment ‘Chlorophyll-a’ (henceforth abbreviated as Chl-a) was used as a potential marker that reflects phytoplankton biomass vis-à-vis primary production potential of the aquatic system. With this background, the study was conducted to examine the changes in phytoplankton biomass in lower Ganga basin as influenced by various environmental parameters under regional trend of climatic variability. The objective of this study was to first identify the most influential environmental parameters on riverine chlorophyll-a concentration and to quantify the direct cascading effect of changing climatic variables on key environmental parameters through modeling for deriving the expected changes in Chl-a concentration in the lower Ganga basin.
Materials and methods
Study area: The lower stretch of river Ganga (locally known as river Hooghly) was selected in this study. Monthly water samples were collected in duplicate during October, 2014 to September, 2016 from two different sites viz. Triveni (22°59’411’’ N & 88°24’310’’E) and Godakhali (22°23’629’’ N & 88°07’948’ ’E) as shown in Fig. 1. Both the stations are part of posterior lower stretch of River Ganga. Each station was further sub-divided into two sub-stations (Triveni-1, Triveni-2 and Godakhali-1, Godakhali-2) to obtain representative samples.
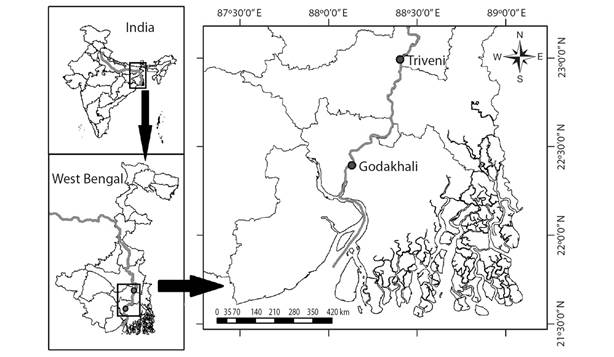
Fig. 1 Geographical location of the study area. Blue line indicates the longitudinal course of river Ganga.
Water sampling, analysis and estimation of Chl-a: Water samples in duplicate were collected from sub-surface region of the water column in 1 Liter HDPE amber bottles. A total of twelve physico-chemical parameters viz. water temperature (°C), dissolved oxygen (DO), free carbon-di-oxide (CO2), pH, electrical conductivity (EC), total hardness, total dissolved solid (TDS), total alkalinity (TA), salinity, Secchi-disc transparency, nitrate and phosphate were analyzed following Standard Methods (APHA, 2012).
Samples for estimation of chlorophyll -a (Chl-a) were collected separately and estimated following APHA (2012). Samples from each replicate were filtered in vacuum with a membrane filters and Millipore membrane filter of pore size 0.45 µm. The residues were wrapped in aluminum foil and transported to laboratory using refrigeration unit in a mobile laboratory van and frozen (-20 °C) immediately upon reaching laboratory. Chl-a pigment was extracted with acetone using a digital laboratory tissue homogenizer (RQT-127AD), Remi make, India. The absorbance of the extracts at wave length 664 nm, 647 nm and 630 nm were recorded in a UV-VIS spectrophotometer. Concentration of Chl-a in water was calculated using following equation: Chl-a = 11.85 (OD 664)-1.54 (OD 647)-0.08 (OD 630), where, Chl-a = concentration of Chl-a in µgL-1, also known as ppb (parts per billion).
Climatic data analysis: Standard “30-years normal” data analysis procedure was used. Daily mean air temperature and precipitation data of 30 years from 1980 to 2015 was obtained from Indian Meteorological Department (IMD). The data corresponding to study location was extracted from 1° x 1° data by using ‘Raster package’ in ‘R’ (R Core Team, 2015). Subsequently monthly means of air temperature and total rainfall was computed from the extracted daily time series data. Finally, annual mean air temperature and total annual rainfall were computed from monthly data. A simple linear trend analysis was carried out to find out the long-term trend. The total rainfall during pre-monsoon, monsoon and post-monsoon) were used to quantify changes in seasonal rainfall pattern (Karnatak et al., 2018).
Statistical analyses and modelling
Modeling climato-environmental influence on Chl-a concentration: The data was analyzed in multiple steps, employing various statistical tools. In order to identify the key climato-environmental parameters influencing Chl-a concentration in river, a stepwise regression with collinearity diagnostics was applied, designating all environmental parameters as explanatory variables and Chl-a concentration as the response variable. Further the relative importance of each environmental parameter (influencing Chl-a) in the optimized linear model was computed in R software (R Core Team, 2015) by using the computer intensive and most recommended method (Lindeman, Merenda, & Gold, 1980). Finally, looking beyond linearity, non-linear Generalized Additive Model (GAM) (Wood, 2006) was applied to unravel the pattern of individual influence of the key environmental parameters on Chl-a.
Budgeting changes in Chl-a concentration under present rate of climate change: The cascading effect of variations in climatic factors (mean air temperature and rainfall) on the key environmental parameters influencing Chl-a concentration was quantified. To avoid complexity in interpretation, only the direct effect of climatic factors on the key environmental parameters was quantified irrespective of the interactions among other non-key parameters existing in the aquatic ecosystem. This was accomplished through a two-step strategy. Firstly, the relationship between the key environmental parameter and climatic factors (mean air temperature and rainfall) was established by simple regression, taking climatic parameters as independent variable and environmental parameters as dependent variables in order to quantify the nature and degree of change in environmental parameters per unit change of climatic factors, irrespective of spatial differences. Secondly, changes in mean air temperature and rainfall over the sampling stations during last three decades (1980-2015) was assessed using IMD data and the present rate of climate change was assumed to remain true in the next three decades (2015-2045). The present rate of change in mean air temperature and rainfall which may cause direct changes in the key environmental parameters ultimately manifesting into change in Chl-a concentration has been derived empirically by plugging the estimates from regression models developed. Finally, these predictive values of environmental variables were utilized in the optimized regression model for Chl-a to derive predictive changes in Chl-a concentration.
Results
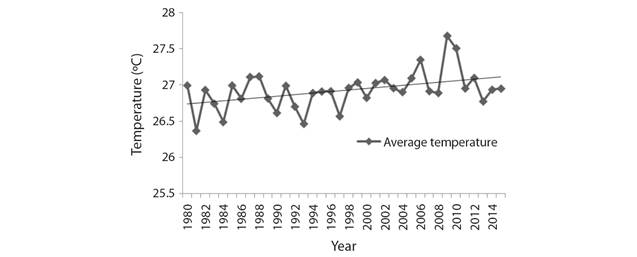
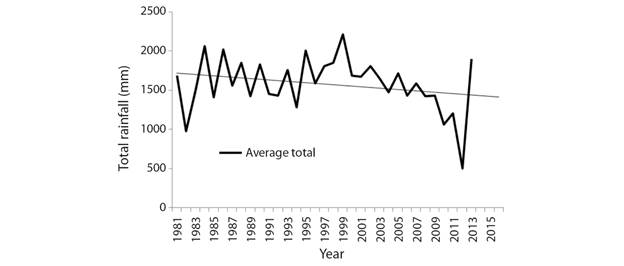
Climate change trend: Analysis of the IMD data on mean air temperature has revealed a unanimous warming trend among the studied sites. During the period of 1980-2015 the mean air temperature has increased by 0.24 °C (Fig. 2). It has also been recorded that the total annual rainfall during the same period has decreased by196.3 mm (Fig. 3).
Modeling climato-environmental influence on Chl-a concentration
Present observations: During the study period, chlorophyll-a (Chl-a) concentration were ranged between 18.92-1 565.45 µgL-1 with an annual mean of 305.94 ± 52.25 µgL-1. The annual distribution pattern of Chl-a encountered is depicted in Digital appendix 1. The inter-site variability (spatial) in Chl-a concentration was statistically insignificant (p = 0.679) as revealed by ANCOVA. Likewise, Chl-a concentration did not vary significantly between seasons pre-monsoon, monsoon and post-monsoon (Pre-M vs. M P = 0.879; Post-M vs. M P = 0.825). The overall descriptive account of physico-chemical and climatic parameters recorded during the study period is presented in Table 1.
Table 1 Descriptive account of habitat parameters recorded in River Ganga during the study period
| Parameters | Stretch# |
| Water temperature (°C) | 19.8-34.0 (27.64 ± 0.58) |
| Dissolved oxygen (ppm) | 1.6-10 (4.51 ± 0.28) |
| Free carbon dioxide (ppm) | 0-10 (3.95 ± 0.5) |
| pH (units) | 7.5-8.6 (8.1 ± 0.04) |
| Total Dissolved Solids (ppm) | 113-301 (228.76 ± 6.28) |
| Conductivity (µmhos) | 160.1-432 (320.89 ± 8.87) |
| Alkalinity (ppm) | 40-140 (100.41 ± 2.88) |
| Salinity (ppm) | 80.3-700 (202.86 ± 18.96) |
| Nitrate (ppm) | Trace-1.72 (0.84 ± 0.07) |
| Phosphate (ppm) | Trace-0.56 (0.1 ± 0.07) |
| Rainfall (mm) | 0-882.5 (150.47 ± 33.09) |
| Chlorophyll-a (µgL-1) | 18.92-1565.45 (305.94 ± 52.25) |
Data presented in range and mean ± standard error of mean (in parentheses).
The chlorophyll budgeting framework used in the present study therefore took into the account merged dataset of two sampling locations since no spatial variability exists. An attempt was also made to chalk out the seasonal thresholds (cut-offs) of Chl-a concentration (if any) to demarcate signature minima or range of Chl-a concentration characteristic in any season; be it pre-monsoon (Feb-May), monsoon (Jun-Sept) or post-monsoon (Oct-Jan). These thresholds were supposed to be super imposed over thermal and precipitation windows to derive season specific climate optima (temperature and rainfall) within which such thresholds are attained in natural conditions. All this information was assumed to serve better in regional climate change impact assessment over lower Gangetic basin on riverine ecological productivity. Unfortunately, no such season-specific thresholds could be identified and therefore, any further analysis involving seasonal influence on riverine chlorophyll was purposively skipped. Following this, only annual data like annual mean chlorophyll concentration were forecasted through the budgeting framework; not the seasonal changes in Chl-a over next three decades.
Cumulative and overall influence of habitat parameters on Chl-a concentration: The study indicated that among 14 climato-environmental parameters considered (mean air temperature, water temperature, rainfall, secchi disc transparency, pH, dissolved oxygen, free carbon dioxide (CO2), total alkalinity, electrical conductivity, total dissolved solids, phosphate, nitrate and salinity), only five environmental parameters namely water temperature, TDS, salinity, TA and pH were found to be key factors influencing Chl-a concentration in the river as revealed through stepwise regression. The generated optimized model was Chl-a = -5.796 + (0.00521 * Total Alkalinity) + (0.347 * pH) - (0.000389 * Salinity) + (0.00451 * TDS) + (0.0652 * Water temperature), which could explain 63.8 % variability of the chlorophyll-a concentration. Water temperature (P < 0.01), total dissolved solids (P < 0.01), total alkalinity (P < 0.05) and pH (P < 0.05) had significant positive influence on Chl-a concentration while salinity (P < 0.05) had a significant negative influence on the same.
In terms of the relative importance of individual environmental parameters (Fig. 4) in influencing Chl-a concentration, water temperature (33.13 % of R2) was the most important while place effect was least important (3.4 % of R2).The relative importance of environmental parameters influencing Chl-a concentration of the river can be summarized as: water temperature > alkalinity > TDS > pH > salinity > place-effect; depicted in Fig 4. The ‘place effect’ diagnostics in the model reveal that Chl-a concentration in the river had no significant spatial difference between two sites. More specifically, there is no significant spatial difference between the two sites of River Ganga in terms of environmental parameters-Chl-a relationship.
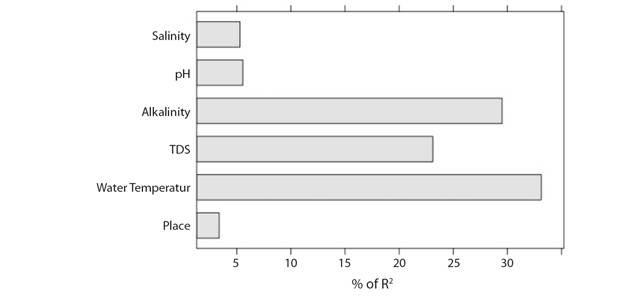
Fig. 4 Relative importance of key environmental parameters for explaining variability in chlorophyll a concentration.
Individual influence pattern of habitat parameters on Chl-a concentration: Individual influence(s) of identified key environmental parameters on Chl-a concentration have been discussed in descending order of their importance.
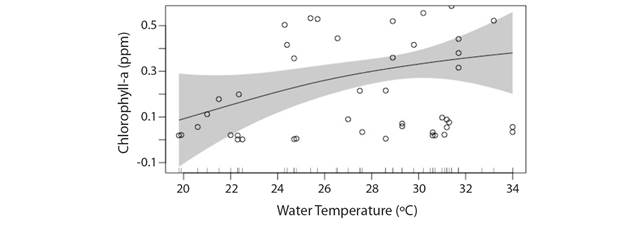
Temperature: GAM models showed that Chl-a concentration in rivers can be expected to initially increase with rise in water temperature (Fig. 5) but may reach a plateau beyond 30 °C (Deviance explained: 12.2 %). It is emphasized that the present model might be useful mostly for pattern identification and may not be optimum for prediction purposes due to short period of study. The prediction belt in the model shows Chl-a concentration may either rise or fall when water warms up beyond 34 °C which requires further study to draw an inference. A gross statement can be made on the fact that although global warming manifested into warmer water temperatures round the year may initially result in increased phytoplankton population but in the long run this effect might not prove beneficial. The study hints at possibility of increased phytoplankton population in the coming years due to enhanced thermal regime mostly during winter. Water temperature was also found to be the most important driver for influencing Chl-a concentration and has been given special emphasis during model interpretation and discussion in climate change perspective; assumed as primary driver.
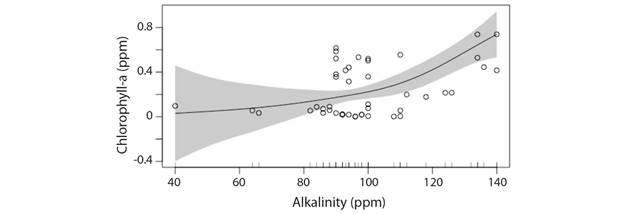
Total Alkalinity: A progressive increase in Chl-a concentration with increasing alkalinity of river water has been predicted by GAM model (Deviance explained: 39.6 %) (Fig. 6). Furthermore, not much change in phytoplankton population can be expected initially when the total alkalinity values remain below 100 ppm while as the total alkalinity in river increases beyond 100 ppm a steep response in phytoplankton biomass is noticeable due to a progressive increase in Chl-a concentration. Alkalinity values > 100 ppm exists in the lower stretch of River Ganga especially throughout the winter followed by early (February to March) and midsummer (March to April). An increasing trend in mean air temperature and decreasing rainfall in the area of study indicates a likely increase in average alkalinity values of river water in the coming years manifested into increased phytoplankton biomass.
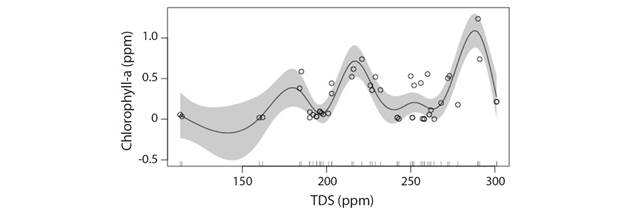
Total dissolved solids (TDS): No particular trend could be observed for change in Chl-a concentration with increase in TDS owing to the multiple peaks in the GAM model but prediction belt in the model shows extreme TDS > 300 ppm and < 175 ppm may be considered as the critical limit beyond which steep fall in Chl-a concentration can be expected (Deviance explained: 72.9 %) (Fig. 7). Eliminating the extremes of TDS, a moderate value of 210-230 ppm TDS may be considered optimum for healthy Chl-a concentration. This implies that high TDS in river during intense summer and diluted TDS due to high rainfall are both detrimental for phytoplankton population.
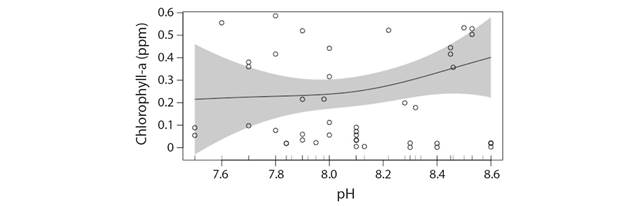
pH: Similarly, for pH-Chl-a relationship indicated that water pH might have a linear influence as the non linear influence seems to be weak (Deviance explained: 5.29 %) (Fig. 8). From the model it can be observed that response of phytoplankton biomass with changes in pH of river water alone is very subtle and the model does not permit any conclusion in this regard. The purpose of the model generated is only for pattern identification.
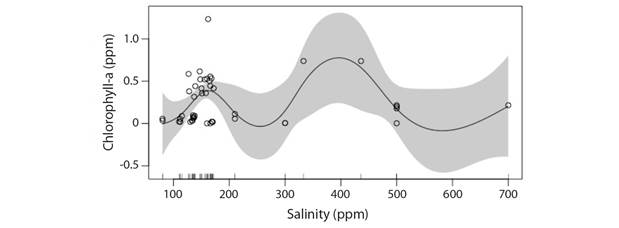
Salinity: The influence of salinity on Chl-a concentration showed that salinity may have a linear influence owing to the near straight curve symmetry and broad prediction belt of the model at higher salinities implying low confidence (Deviance explained: 3.43 %) (Fig. 9). It is highlighted that the model might be useful mostly for pattern identification and may not be most favorable for prediction purposes. From the model it is evident that response of phytoplankton population in river with changes in salinity alone is very subtle. It was further observed that the phytoplankton population may likely remain stable as the salinity in the river increases up to around 600 ppm under increased temperature and reduced rainfall scenario. Beyond 600 ppm salinity a probable reduction in Chl-a concentration vis-à-vis phytoplankton biomass might occur, which can happen especially during summer.
Budgeting changes in Chl-a concentration under present rate of climatic variability
Budgeting results: Change in mean annual temperature over last three decades was considered in the budgeting framework but not the minimum or maximum air temperature data (Winslow, Read, Hansen, Rose, & Robertson, 2017). Likewise, changes in total annual rainfall over last three decades were considered but not the seasonal, minima or maxima. Accordingly, the forecasting was done on mean annual Chl-a basis (elaborated above).
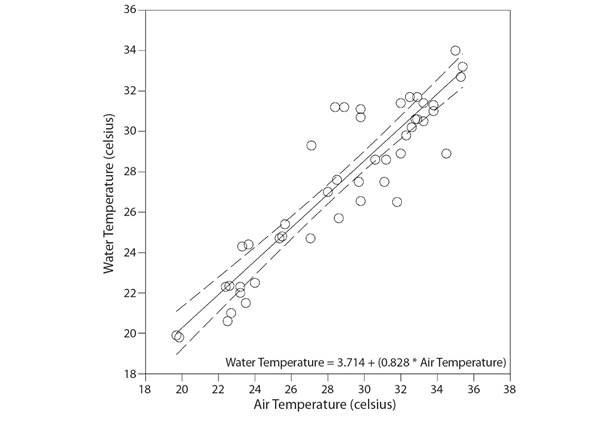
A trend of 0.24 °C rise in mean air temperature in West Bengal may reflect in increased mean water temperature by + 0.20 °C (R2 = 0.843, Fig. 10) in the coming years. This alone may lead to an increase in mean Chl-a concentration by + 10µgL-1in the estimates of multiple linear model (Multiple R2 = 0.684) as deduced from the linear models. Likewise, a 0.20 °C increase in mean water temperature (R2 = 0.377) and 196.3 mm decrease in rainfall (R2 = 0.577) may result in a net gain of average TDS by + 26.21 ppm which may alone lead to increased mean Chl-a concentration by +110 µgL-1 (Multiple R2 = 0.684) in the coming years. There is a possibility that, 196.3 mm decrease in rainfall over the area may probably bring an increase in average salinity by + 68.51 ppm (R2 = 0.261, low confidence) and average total alkalinity by + 9.03 ppm (R2 = 0.292, low confidence) in the coming years that may individually manifest changes in mean Chl-a concentration by -20 µgL-1 (Multiple R2 = 0.684) and +50 µgL-1 (Multiple R2 = 0.684), respectively. Lastly, a 0.20 °C increase in mean water temperature (R2 = 0.421) and 196.3 mm decrease in rainfall (R2 = 0.335) may be reflected through a net gain in average pH by + 0.09 units that may alone increase mean Chl-a concentration by + 30 µgL-1 (Multiple R2 = 0.684) in the coming years.
Inference of Budgeting: Keeping in view the rise in mean air temperature (+ 0.24 °C) and decrease in rainfall (196.3 mm) during the last 3 decades (1980-2015) over the lower stretch of river Ganga passing through West Bengal, India (Fig. 1, Fig. 2), we assume that this present rate of climate change might remain true in the next three decades (2015-2045) . Based on this assumption and quantified cascading effect of such climatic change on the key environmental parameters influencing Chl-a concentration, our model summarizes that a gradual increase in the existing mean Chl-a concentration (305.94 ± 52.25 µg L-1) by approximately + 170 µgL-1 (ppb) (Multiple R2 = 0.6839) in the lower Ganga basin may probably occur over the next three decades (2015-2045).
Discussion
Importance of Chl-a mapping and environmental influence: Chl-a indicates health of water in aquatic ecosystem (Boyer, Christopher, Peter, & David, 2009). It also provides trophic status based on primary productivity of the ecosystem (Das Sarkar et al., 2020) and measures trophy index (Bbalali, Hoseini, Ghorbani, & Kordi, 2013). Ecohydrological interaction studies in natural river system showed that physical variables such as, water discharge, suspended solids and turbidity regulate the development of phytoplankton biomass critically in comparison with nutrients (Salmaso & Braioni, 2008).
In the present study, only five environmental parameters namely water temperature, TDS, salinity, TA and pH were found to be key factors influencing Chl-a concentration in the river. The nature of their individual influence was found to be in conformity with published literatures. Rising temperature has aided to increase growth and productivity of algae which may be boosted by the higher enzymatic activity (Nweze & Ude, 2013). The changing temperature and precipitation pattern over lower Gangetic stretch are in the line with Rathore, Attri, & Jaswal (2013), Paul & Birthal (2015), Naskar, Roy, Karnatak, Nandy, & Roy (2017). High nutrient influx through freshwater river drainage in lower Ganga has supported rising trend of chlorophyll concentration. Similar positive impact of elevated water temperature for short term on phytoplankton biomass productivity and photosynthetic activity is also suggested tropical rice fields (Roger & Kulasooriya, 1980) and in subtropical waters (Willis, Chuang, Orr, Beardall, & Burford, 2019). A positive correlation was found between alkalinity and TDS with Chl-a concentration (P < 0.01) in the present study. The study further denotes a positive correlation (P < 0.05) between Chl-a and pH which may be due to higher phytoplankton photosynthesis and biological productivity. Simultaneously, time series models also showed influence of nutrients and pH on phytoplankton biomass for shorter time span (Jeong, Kim, Whigham, & Joo, 2003). Salinity (P < 0.05) ingression shows a significant negative influence on the Chl-a concentration in the lower Ganga which may be due to inability in generating turgor pressure to produce intracellular osmolarity needed with increasing salinity (Mitra, Zaman, & Raha, 2014). However, present study of identifying the relative influence of environmental parameters on Chl-a concentration shows water temperature (33.13 % of R2) as the most significant variable followed by TA (29.5 % of R2) and TDS (23.1 % of R2). Rainfall plays a vital role in mixing of environmental variables and also responsible for physical dispersal of phytoplankton in wetlands of tropical semiarid region (Brasil et al., 2020), hence resulting into considerable reduction in chlorophyll concentration. At the same time, rainfall did not contribute as influential climatological parameter in the present study. Taken together, it could be interesting to note that this study has also sketched out the relative importance of climato-environmental parameters influencing Chl-a concentration in inland open waters which is unavailable in most of the studies consulted. Therefore, the present information on relative importance may also be regarded as one of the recent additions towards better understanding of phytoplankton response to environmental dynamics in riverine ecosystems.
Relatively high dependence on water temperature and relevance for climate research: The prime importance of water temperature besides other environmental parameters on dictating phytoplankton production or phytoplankton biomass in lotic systems such as rivers is well documented (Schabhuttl et al., 2013; Wrona et al., 2006). Climate change is altering the physical, chemical and biological characteristics of freshwater habitats (Hartmann et al., 2013) including inland fish and fisheries (Carlson & Lederman, 2016). The importance of temperature over other water quality parameters in influencing Chl-a concentration observed during the present study has both biological and ecological basis. According to Cloern et al. (2014), phytoplankton growth rate is regulated by water temperature, nutrient concentrations and forms, and the amount and quality of photosynthetically available radiation (PAR).
From the ecological perspective, temperature regulates ecosystem functioning directly by influencing primary production (Dallas, 2008). Studies have shown that increase temperature is accompanied by a shift in the dominance of phytoplankton groups from diatoms (< 20 °C) to green algae (15 to 30 °C) to blue-green algae (> 30°C) (DeNicola, 1996). According to DeNicola (1996), phytoplankton biomass increases with temperature from approximately 0 to 30 °C and decreases at 30 to 34 °C; while species diversity increases from 0 to 25 °C and decreases at temperatures > 30 °C. This was further confirmed in a lab-based experiment by Schabhuttl et al. (2013) where it was observed that temperature is among the major determinants to influence phytoplankton growth rates positively but higher temperatures resulted in higher fractions of blue green algae over diatoms and green algae.
In the present study, although a gradual increase in Chl-a concentration was observed between 20-30 °C but a plateau was reached between 30-34 °C instead of directly decreasing. However, the prediction belt in our temperature-chlorophyll predictive model also hinted the probability of either decrease or increase in Chl-a concentration beyond 30 °C which might be attributed to the role of other key environmental parameters that significantly influence phytoplankton biomass as well as in the presence of increasing temperature, as concluded in Sipkay et al. (2012). Several modeling methodologies have also forecasted increase of phytoplankton biomass in rivers under increasing temperatures (Klapper, 1991; Elliot et al., 2005; Komatsu, Fukushima, & Shiraishi, 2006; Mooij et al., 2007; Sipkay et al., 2012). Similarly, predictive models have also forecasted the broad-spectrum increase in picophytoplankton with rise in temperature in subtropical gyres (Agusti, Lubián, Moreno-Ostos, Estrada, & Duarte 2019). However, few studies also report otherwise i.e. phytoplankton biomass in rivers to decrease with rising temperature (Sommer & Lengfellner, 2008; Lewandowska & Sommer, 2010).
Implications of regional climatic variability on riverine Chl-a: collating the present observations: The changing climate has implications on thermal regime and nutrient availability in aquatic ecosystems through changes in temperature and precipitation (flow) pattern, that is manifested into altered phytoplankton biomass or primary productivity (Webb & Nobilis, 2007; Schabhuttl et al., 2013; Das Sarkar et al., 2019b). According to Whitehead et al. (2012), in many rivers the phytoplankton blooms in summers are a feature of river ecology and the frequency and intensity of these may increase under future climatic scenario. On the other hand, study suggests less pronounced for tropical phytoplankton communities already acclimatized to warmer temperatures round the year (Schabhuttl et al., 2013). Situations of higher water temperatures and lower flow have been attributed to enhance phytoplankton growth in rivers (Verdonschot et al., 2010; Whitehead et al., 2012).
The present study has also hinted evidences of increased phytoplankton biomass viz. Chl-a concentration under increasing temperature and decreasing rainfall over the region. Additionally, estimates indicate that if the present rate of climatic variability over the last 3 decades (mean air temperature + 0.24 °C and total annual rainfall -196.3 mm) remain consistent over the next three decades (2015-2045) as well, an increase in mean Chl-a concentration by +170 µgL-1 may likely be expected. The resulting mean Chl-a concentration may grossly arrive at around 475.94 µgL-1 over the next three decades. Further repetitive time-series investigations are required to validate this estimate. It remains to be a researchable issue whether the dynamics of this change will follow a direct or alternating waveform pattern. The present study also could not conclude whether the degree of quantified change of phytoplankton biomass in river system by 2045 or more could be tagged as progressively eutrophic or lie within the mesotrophic range; difficult to probe without flow data. Nonetheless, our observations with short-term data are in line with several others who have forecasted increased phytoplankton biomass and/or primary production in rivers due to climate change using long-term data (Wrona et al., 2006; Friberg et al., 2009; Verdonschot et al., 2010; Sipkay et al., 2012; Whitehead et al., 2012). This increase in phytoplankton biomass projected for lower Ganga basin under future climatic scenario can be partly explained through the conceptual mechanism discussed in Whitehead et al. (2012) and inferences drawn by Sipkay et al. (2012). The limitation of DO in lotic systems is not a serious issue due to its flowing nature, the observed trend of increased Chl-a concentration under future climatic scenario may only be beneficial from fisheries point of view (increased abundance and biomass of fish food organisms) if, (a) the phytoplankton succession does not get significantly dominated by blue green algae (tropical waters at low risk as explained (Schabhuttl et al., 2013) and, (b) water stress does not become evident resulting into eutrophication.
The present study pioneers the ecological research in Indian rivers which conceptualized a model based framework and identified key climato-hydrochemical parameters for water managers dealing with complex water ecosystems. The study signifies the model based assessment of the impact of climatogical variables on phytoplankton biomass which stands as an emerging topic for environmental biologist and ecologists. Developing countries like India have dearth of long-term data on riverine chlorophyll concentration or any aquatic system per se; although time series data of climatic variables are well maintained and abundantly available. The present methodology explored an alternative approach to generate baseline information on trends and gross quantification of changes in aquatic Chl-a concentration under future climatic scenario -in absence of long term data. In the present study, the photosynthetic pigment Chl-a was used as a potential marker that reflects phytoplankton biomass vis-à-vis primary production potential of the aquatic system. Looking at the multitude of environmental influence on dictating riverine chlorophyll concentration, it is quite difficult to pinpoint any climate change related hypotheses in open waters. The present study may not be a key estimate of the future climate change scenario but certainly a gross hint of the probable ecosystem response and would fit for developing managerial strategies for water managers which augment the sustainable management practices for stakeholders.
Ethical statement: authors declare that they all agree with this publication and made significant contributions; that there is no conflict of interest of any kind; and that we followed all pertinent ethical and legal procedures and requirements. All financial sources are fully and clearly stated in the acknowledgements section. A signed document has been filed in the journal archives.

