


 Inglés (pdf)
 Articulo en XML
 Referencias del artículo
 Enviar articulo por email
 Citado por SciELO
  Similares en
SciELO
Similares en
SciELO  uBio
uBio 
 Permalink
Introduction
Sugarcane (Saccharum spp.) is a globally important bioenergy crop (Vargas et al., 2014). Sugar, energy and surfactant are produced from sugarcane (Wiedenfeld, 2000). Many factors affect sugarcane yields including soil quality, cultivar, physiology, crop management and economic reasons (Santillán-Fernández et al., 2016). Drought is an important stress factor for sugarcane production in many areas (Santillán-Fernández et al., 2016). Climatic factors cannot be controlled but knowledge concerning historical regional meteorological conditions can be considered for optimal management of crop cycles (Van-Ittersum & Rabbinge, 1997) and cultivar selection. Water proportion and moisture indices are applicable information for agronomic planning to forecast water excess or deficit during the crop cycle (Santillán-Fernández et al., 2016).
Most sugarcane in Thailand is grown under rain-fed environments (Laclau & Laclau, 2009). Periods of drought regularly occur, especially during the early growing period. Sugarcane culture in Thailand occurs during October and November, or until the remaining moisture content in the soil is consumed. Drought affects plant growth and can decrease sugarcane yield by up to 60 % (Robertson et al., 1999). Previous research reported the response of biochemical, physiological and morphological characteristics on drought tolerance criteria.
Under conditions of water deficit, plants show biochemical, physiological and molecular responses at both whole plant and cellular levels (Hasegawa et al., 2000). Osmotic stresses induced by drought environment also activate development and water situation disturbance causes ion transportation changes along with uptake schemes (Lutts, Kinet, & Bouharmont, 1996; Bajji, Lutts, & Kinet, 2000; Abbas, Ahmad, Sabir, & Shah, 2014). Water absorption from the soil into plant roots uses osmosis mechanisms to balance pressure alteration. During drought stress conditions, plasma membranes are damaged by free radicals that induce electrolyte leakage. Drought stress also motivates plant adaptation for growth and survival (Boaretto et al., 2014). Plant cells adapt by reducing water potential, while carbon dioxide (CO2) intensity within the palisade or spongy parenchyma decreases, causing low growth and photosynthetic rates (Shao, Chu, Jaleel, &, Zhao, 2008). Scant information concerning the anatomical characteristics of sugarcane under early drought conditions is available in the literature. Under drought stress conditions, some anatomical features respond by reducing water content within the xylem, whereas pit of sclerenchymal cell walls are increases (Bosabalidis & Kofdis, 2002). Bulliform cells enlarge and epidermal cells and leaf lamina become thicker. Stomatal density increases while size decreases (Nawazish, Hameed, & Naurin, 2006; Taratima, Ritmaha, Jongrungklang, Raso, & Maneerattanarungroj, 2019). However, recent reports showed that bulliform cells of sugarcane Saccharum ‘F127’ and Saccharum ‘YL6’ did not expand under severe drought stress conditions (Zhang et al., 2015).
Morphological, physiological, biochemical and anatomical features of sugarcane families have been investigated to optimize crop yield. Previous studies proved that Saccharum ‘UT13’ which derived from wild-type genotype was assumed as the drought-tolerant cultivar (Palachai, Songsri, & Jongrungklang, 2019; Khonghintaisong, Songsri, & Jongrungklang, 2020), while Saccharum ‘UT12’ was identified susceptible to drought stress (Khonghintaisong, Songsri, & Jongrungklang, 2020). Differences in their genetic background might provide a different anatomical characteristic after grown under drought stress condition. However, to the best of our knowledge, leaf anatomical features of sugarcane Saccharum ‘UT12’ and Saccharum ‘UT13’ have not been compared under initial drought stress situations. Information from this study can be used for sugarcane growth improvement and considerate to improve sugarcane genotypes in our breeding programs as parents selection for drought-resistance cultivars in the future.
Materials and methods
Plant materials and experimental details: Experiments were performed with pot-grown plants between March and June 2018 at the Agronomy Field Crop Station, Faculty of Agriculture, Khon Kaen University, Khon Kaen, Thailand. Anatomical characteristics of the samples were investigated from July to December 2018. Two sugarcane cultivars, Saccharum ‘UT12’ and Saccharum ‘UT13’ with different drought tolerances were used (Palachai et al., 2019; Khonghintaisong et al., 2020).
Saccharum ‘UT12’ is a hybrid from commercial canes Saccharum ‘Supanburi 80’ x Saccharum ‘UT3’ (Mother x Father). Saccharum ‘UT12’ has been identified as having moderate tolerance to red rot wilt and smut diseases with moderate drought resistance. By contrast, Saccharum ‘UT13’ has been determined as sensitive to red rot wilt and smut diseases with good drought tolerance as a hybrid from S. spontaneum ‘BC3’ (wild type) x Saccharum ‘UT8’ (Mother x Father) (Office of the Cane and Sugar Board, 2015). Standard pots of size 80 cm height and 50 cm diameter were used in all treatments. 80 kg of dry soil were filled as four layers, 20 kg per layer and compared to achieve density at 1.55 g/cm3. Soil properties were 77.9 % sand, 20.0 % silt, 2.07 % clay, 11.3 % Field capacity (FC), 4.06 % Permanent wilting point (PWP), 0.337 % Organic Matter (OM), pH 6.08 and 0.26 ds/m EC (Khonghintaisong, 2018).
A one bud sugarcane culm was used as the explant in all treatments, one culm per pot. Basal fertilizers at 50 kg N, 50 kg P and 25 kg K ha-1 were applied during growth in field conditions. Insects and weeds were controlled during the experimental period.
A full water scheme was applied for seedling growth in all treatment for 30 days after planting culture. For the control (non-water stress treatment), soil moisture was applied continuously and recorded throughout the experimental period, while for drought treatment, water was restricted from 30-90 days after planting cultures. Total water applied in the experiment followed crop water requirements calculated by Jangpromma et al. (2010) as follows:
cwhere ETcrop represents crop water requirement (mm/day), ETo represents evapotranspiration of a reference crop under specified conditions calculated by the evaporation pan method, and Kc is the crop water requirement coefficient for sugarcane.
Leaf anatomy studies: The third or fourth mature leaves from the shoots of control plants and treatments were collected at 90 days after culture. Approximately 160 cm long leaves were selected. The middle part of leaf blade (10 cm) was cut out and fixed in 100 ml of FAA70 fixative (70 % ethyl alcohol, acetic acid, formaldehyde; 90:5:5) for anatomical studies. Three leaf areas as leaf margin, midrib and lamina were collected and dissected into small pieces before soaking in 15 % (v/v) Clorox (sodium hypochlorite) for 24 hours before peeling. Adaxial and abaxial epidermis were stained by 1 % (w/v) Safranin O in ethyl alcohol before dehydration by serial ethyl alcohol and xylene and mounted using DePeX (Taratima et al., 2019).
For leaf peeling, both short and long epidermal cells, stomatal density, stomatal size (guard cell and subsidiary cell) were measured under a light compound microscope. Three areas of the leaf blade were free hand transverse sectioned before Safranin O staining, then dehydrated using serial ethyl alcohol and xylene and mounted using DePeX. Anatomical features were studied and recorded using a light compound microscope (Olympus CH 30) and a Zeiss 5402140000004 using the MB2004 configuration AxioVision program. Forty anatomical characteristics were scored based on Nawazish et al. (2006), Zhang et al. (2015) and Taratima et al. (2019) as presented in Table 1 and Table 2.
TABLE 1 Assessment of anatomical features of sugarcane leaf Saccharum ‘UT12’ under unstressed and early stress situations
| Character size (µm) | Unstressed (x̅ ± SD) | Stressed (x̅ ± SD) | DTI | Sig. |
| Lamina thickness | 195.3 ± 18.3 | 169.0 ± 12.2 | 0.86 | * |
| Midrib-epidermal cell | ||||
| Cell wall & cuticle thickness (ad) | 3.6 ± 0.7 | 3.4 ± 1.7 | 0.94 | - |
| Cell wall & cuticle thickness (ab) | 3.4 ± 1.0 | 3.5 ± 0.7 | 1.02 | - |
| Lamina-epidermal cell | ||||
| Cell wall & cuticle thickness (ad) | 3.9 ± 0.9 | 5.3 ± 0.4 | 1.35 | * |
| Cell wall & cuticle thickness (ab) | 1.7 ± 0. 5 | 3.8 ± 0.6 | 2.23 | ** |
| Major vascular bundle of midrib | ||||
| Vertical length | 128.9 ± 5.0 | 167.3 ± 8.8 | 1.29 | ** |
| Horizontal length | 186.2 ± 4.1 | 191.9 ± 9.5 | 1.03 | - |
| 1st vessel diameter (metaxylem) | 59.2 ± 8.9 | 60.3 ± 2.7 | 1.01 | - |
| 2nd vessel diameter (metaxylem) | 62.9 ± 6.2 | 62.1 ± 3.7 | 0.98 | - |
| Vessel cell wall thickness (protoxylem) | 4.3 ± 0.6 | 6.5 ± 1.6 | 1.51 | * |
| Phloem vertical length | 56.3 ± 7.5 | 61.3 ± 7.3 | 1.08 | - |
| Phloem horizontal length | 95.1 ± 9.7 | 120.3 ± 8.2 | 1.26 | * |
| Bundle sheath extension length | 132.2 ± 8.1 | 120.7 ± 5.8 | 0.91 | * |
| Major vascular bundle of lamina | ||||
| Vertical length | 115.1 ± 11.1 | 89.0 ± 11.4 | 0.77 | ** |
| Horizontal length | 128.0 ± 28.1 | 106.5 ± 20.3 | 0.83 | - |
| 1st vessel diameter (metaxylem) | 48.1 ± 8.2 | 37.6 ± 5.9 | 0.78 | * |
| 2nd vessel diameter (metaxylem) | 47.6 ± 1.6 | 34.2 ± 7.2 | 0.71 | * |
| Vessel cell wall thickness (protoxylem) | 3.7 ± 0.8 | 3.6 ± 0.6 | 0.97 | - |
| Phloem vertical length | 41.4 ± 1.4 | 32.4 ± 5.1 | 0.78 | * |
| Phloem horizontal length | 63.2 ± 3.5 | 50.5 ± 9.8 | 0.79 | * |
| Other characters | ||||
| Bulliform cell vertical length | 56.9 ± 3.6 | 38.9 ± 6.9 | 0.68 | * |
| Bulliform cell horizontal length | 81.5 ± 26.0 | 58.1 ± 8.4 | 0.71 | * |
| Stomatal width (ad) | 22.0 ± 1.7 | 23.3 ± 1.2 | 1.05 | - |
| Stomatal length (ad) | 36.3 ± 10.4 | 34.0 ± 1.4 | 0.93 | - |
| Stomatal width (ab) | 20.4 ± 0.7 | 24.4 ± 1.5 | 1.19 | ** |
| Stomatal length (ab) | 28.0 ± 9.0 | 35.7 ± 1.7 | 1.27 | ** |
| Interstomatal cell width (ad) | 19.5 ± 1.5 | 17.6 ± 2.1 | 0.90 | * |
| Interstomatal cell length (ad) | 21.8 ± 7.5 | 42.2 ± 15.2 | 1.93 | * |
| Interstomatal cell width (ab) | 22.5 ± 2.8 | 22.1 ± 2.4 | 0.98 | - |
| Interstomatal cell length (ab) | 15.8 ± 2.9 | 25.5 ± 5.8 | 1.61 | ** |
| Short-cell width(ad) | 15.8 ± 2.4 | 19.3 ± 1.4 | 1.22 | * |
| Short-cell length(ad) | 7.1 ± 1.2 | 8.8 ± 1.5 | 1.23 | * |
| Short-cell width(ab) | 11.9 ± 1.6 | 16.8 ± 2.7 | 1.41 | ** |
| Short-cell length(ab) | 9.0 ± 2.5 | 8.4 ± 1.9 | 0.93 | - |
| Long-cell width(ad) | 14.7 ± 0.9 | 16.6 ± 1.5 | 1.12 | - |
| Long-cell length(ad) | 109.0 ± 19.3 | 108.2 ± 11.2 | 0.99 | - |
| Long-cell width(ab) | 12.2 ± 1.8 | 15.5 ± 1.1 | 1.27 | ** |
| Long-cell length(ab) | 96.7 ± 8.3 | 102.8 ± 20.8 | 1.06 | - |
| Stomatal density (ad) (No/mm2) | 195.6 ± 24.0 | 195.6 ± 55.2 | 1.00 | - |
| Stomatal density (ab) (No/mm2) | 219.0 ± 48.2 | 230.7 ± 79.6 | 1.05 | - |
* Significant difference at P < 0.05, ** Significant difference at P < 0.001; ab-abaxial; ad-adaxial. (DTI = drought tolerance index).
TABLE 2 Assessment of anatomical features of sugarcane leaf Saccharum ‘UT13’ under unstressed and early stress situations
| Character size (µm) | Unstressed (x̅ ± SD) | Stressed (x̅ ± SD) | DTI | Sig. |
| Lamina thickness | 198.8 ± 38.4 | 191.5 ± 11.8 | 0.96 | - |
| Midrib-epidermal cell | ||||
| Cell wall & cuticle thickness (ad) | 2.2 ± 0.4 | 2.3 ± 0.4 | 1.04 | - |
| Cell wall & cuticle thickness (ab) | 2.7 ± 0.4 | 3.3 ± 0.4 | 1.22 | * |
| Lamina-epidermal cell | ||||
| Cell wall & cuticle thickness (ad) | 5.0 ± 0.8 | 4.2 ± 0.9 | 0.84 | - |
| Cell wall & cuticle thickness (ab) | 3.8 ± 1.1 | 3.2 ± 0.7 | 0.84 | - |
| Major vascular bundle of midrib | ||||
| Vertical length | 138.8 ± 11.4 | 152.9 ± 5.9 | 1.10 | * |
| Horizontal length | 158.2 ± 7.8 | 168.3 ± 10.6 | 1.06 | * |
| 1st vessel diameter (metaxylem) | 50.5 ± 3.0 | 52.8 ± 4.1 | 1.04 | - |
| 2nd vessel diameter (metaxylem) | 51.1 ± 3.3 | 52.0 ± 2.4 | 1.01 | - |
| Vessel cell wall thickness (protoxylem) | 4.3 ± 0.8 | 4.2 ± 0.5 | 0.97 | - |
| Phloem vertical length | 51.6 ± 6.8 | 54.8 ± 3.1 | 1.06 | - |
| Phloem horizontal length | 107.8 ± 8.4 | 117.9 ± 7.3 | 1.09 | - |
| Bundle sheath extension length | 105.8 ± 9.0 | 123.0 ± 11.4 | 1.16 | * |
| Major vascular bundle of lamina | ||||
| Vertical length | 94.9 ± 13.1 | 104.4 ± 14.2 | 1.10 | |
| Horizontal length | 119.0 ± 5.2 | 112.0 ± 12.2 | 0.94 | |
| First metaxylem diameter | 40.9 ± 3.7 | 36.3 ± 5.0 | 0.88 | - |
| Second metaxylem diameter | 41.5 ± 4.0 | 39.2 ± 5.0 | 0.93 | - |
| Protoxylem cell wall thickness | 2.8 ± 0.7 | 3.3 ± 0.7 | 1.17 | - |
| Phloem vertical length | 40.4 ± 3.8 | 33.3 ± 7.9 | 0.82 | * |
| Phloem horizontal length | 70.6 ± 4.7 | 53.0 ± 5.4 | 0.75 | * |
| Other characters | ||||
| Bulliform cell vertical length | 50.0 ± 13.3 | 61.7 ± 12.9 | 1.23 | - |
| Bulliform cell horizontal length | 64.7 ± 5.1 | 83.1 ± 13.7 | 1.28 | * |
| Stomatal width (ad) | 24.8 ± 2.2 | 21.0 ± 1.3 | 0.84 | ** |
| Stomatal length (ad) | 37.4 ± 2.3 | 32.3 ± 5.7 | 0.86 | * |
| Stomatal width (ab) | 25.9 ± 1.5 | 23.4 ± 3.8 | 0.90 | - |
| Stomatal length (ab) | 32.9 ± 3.7 | 35.0 ± 1.0 | 1.06 | - |
| Interstomatal cell width (ad) | 22.2 ± 2.6 | 19.2 ± 1.3 | 0.86 | * |
| Interstomatal cell length (ad) | 31.1 ± 7.3 | 25.5 ± 3.8 | 0.81 | - |
| Interstomatal cell width (ab) | 19.9 ± 3.0 | 21.4 ± 3.4 | 1.07 | - |
| Interstomatal cell length (ab) | 28.1 ± 11.1 | 25.7 ± 7.3 | 0.91 | - |
| Short-cell width(ad) | 14.8 ± 3.3 | 11.4 ± 2.8 | 0.77 | - |
| Short-cell length(ad) | 7.8 ± 2.0 | 8.9 ± 2.2 | 1.14 | - |
| Short-cell width(ab) | 14.6 ± 3.0 | 11.8 ± 3.4 | 0.80 | * |
| Short-cell length(ab) | 9.4 ± 3.2 | 6.2 ± 0.9 | 0.65 | ** |
| Long-cell width(ad) | 14.1 ± 1.79 | 9.0 ± 2.3 | 0.63 | - |
| Long-cell length(ad) | 119.7 ± 34.5 | 112.5 ± 16.2 | 0.93 | - |
| Long-cell width(ab) | 16.3 ± 2.4 | 11.0 ± 2.1 | 0.67 | ** |
| Long-cell length(ab) | 112.2 ± 19.4 | 101.3 ± 10.9 | 0.90 | - |
| Stomatal density (ad) (No/mm2) | 131.4 ± 37.7 | 315.4 ± 61.2 | 2.40 | ** |
| Stomatal density (ab) (No/mm2) | 157.7 ± 51.8 | 332.9 ± 34.2 | 2.11 | ** |
* Significant difference at P < 0.05 ** Significant difference at P < 0.001; ab-abaxial; ad-adaxial. (DTI = drought tolerance index).
Data analysis: At least five replications were examined in each treatment. The paired sample t-test was used for statistical significance (Taratima et al., 2019). Relationships between anatomical features were investigated using simple correlation. Anatomical traits were determined using the drought tolerance index (DTI) to compare values under drought stress conditions, with values for the field capacity condition based on Nautiyal, Nageswara Rao, and Joshi (2002) (more than 1 = increase, less than 1 = decrease) as follows:
Correlation studies: Anatomical trait associations were calculated using correlation coefficients among interesting pairs of anatomical characteristics at phenotypic levels. Phenotypic correlation coefficients were calculated according to Searle (1961) and Singh et al. (2018) as follows:
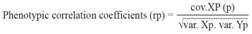
where Cov.XY (p) represents phenotypic covariance between characteristics X and Y and Var.X (p), and Var.Y (p) represent variance for characteristics X and Y at phenotypic levels. Data analysis was carried out using the SPSS version 19.
Results
Transverse sections of unstressed and stressed sugarcane leaf Saccharum ‘UT12’ and Saccharum ‘UT13’ showed Kranz anatomy characteristics of C4 plants, with chlorenchymatous bundle sheaths and radially arranged mesophyll cells (Fig. 1A, 1B, 1C, 1D). Vascular bundles exhibited angular in outline or basic bundle type (Fig. 1E, 1F, 1G, 1H). Forty anatomical characteristics of Saccharum ‘UT12’ and Saccharum ‘UT13’ were measured as shown in Table 1 and Table 2, respectively. Lamina thickness of Saccharum ‘UT12’ and Saccharum ‘UT13’ decreased when grown under drought condition, while cell wall and cuticle thickness of lamina epidermal cells of Saccharum ‘UT12’ increased on both adaxial and abaxial sides, except in Saccharum ‘UT13’. Almost all major vascular bundle features in the midrib of Saccharum ‘UT12’, and some characteristics in Saccharum ‘UT13’ enlarged after treatment (P < 0.05). Major vascular bundle size in lamina blades of Saccharum ‘UT12’ and Saccharum ‘UT13’ showed differences after treatment; both vertical and horizontal length of Saccharum ‘UT12’ decreased while in Saccharum ‘UT13’ these significantly increased (Table 1 and Table 2).
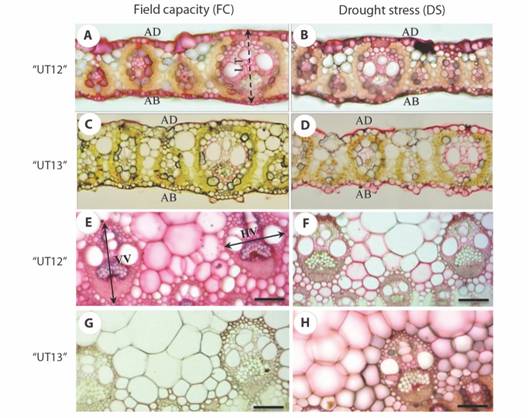
Fig. 1 Transverse section of sugarcane leaf comparing thickness and vascular bundle size from sugarcane with field capacity (FC) (non-water stress treatment) and drought stress (DS). A. leaf thickness of Saccharum ‘UT12’ with FC; B. leaf thickness of Saccharum ‘UT12’ with DS; C. leaf thickness of Saccharum ‘UT13’ with FC; D. leaf thickness of Saccharum ‘UT13’ with DS; E. vascular bundle size of Saccharum ‘UT12’ with FC; F. vascular bundle size of Saccharum ‘UT12’ with DS; G. vascular bundle size of Saccharum ‘UT13’ with FC; H. vascular bundle size of Saccharum ‘UT13’ with DS. (LT-leaf thickness; AD-adaxial; AB-abaxial; VV-vertical length of major vascular bundle; HP-horizontal length of major vascular bundle). Scale = 100 µm.
Epidermal features of sugarcane leaf Saccharum ‘UT12’ and Saccharum ‘UT13’ were similar to grasses with mainly in small groups of specially large cells of bulliform cells (Fig. 2A, 2B, 2C, 2D) and regular patterns of short cells and long cells (Fig. 2E, 2F, 2G, 2H). Plant tissue type and alignment patterns were similar between unstressed and stressed leaves. Anatomical characteristics of sugarcane concurred with Metcalfe (1960) and Joarder, Roy, Sima, and Parvin (2010). Short cells of abaxial epidermis were shown between the midrib; almost all were solitary with some paired. Cross-shaped silica bodies intermediated among cross or dumb-bell shapes (Fig. 2E, 2F, 2G, 2H). Stomata occurred with two subsidiary cells of triangular shape. All stomata appeared in the stomatal zone. Long-cells occurred closely alongside and above the midrib. Inter-stomatal cells showed indented ends including narrow and profound concavities.
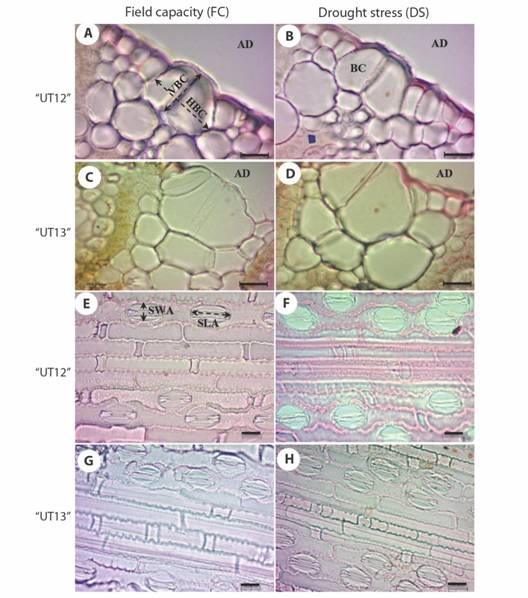
Fig. 2 Transverse section of sugarcane leaf displaying bulliform cell size of field capacity (FC) and drought stress (DS) from 30-90 days after first ratoon A. cell wall of epidermal cell and cuticle thickness of Saccharum ‘UT12’ with FC; B. Saccharum ‘UT12’ with DS; C. cell wall of epidermal cell and cuticle thickness of Saccharum ‘UT13’ with FC; D. Saccharum ‘UT13’ with DS; E. stomata and epidermal cell of Saccharum ‘UT12’ with FC; F. Saccharum ‘UT12’ with DS; G. stomata and epidermal cell of Saccharum ‘UT13’ with FC; H. stomata and epidermal cell of Saccharum ‘UT13’ with DS (AD -adaxial; BC-bulliform cell; VBC-vertical length of bulliform cell; HBC-horizontal length of bulliform cell; SWA-stomatal width of adaxial side; SLA-stomatal length of adaxial side). Scale = 20 µm.
Stomatal density of Saccharum ‘UT12’ was not significantly different in unstressed and stressed condition, while Saccharum ‘UT13’ showed significant differences in stomatal density of unstressed and stressed condition on both adaxial and abaxial sides. Stomatal size of almost all stressed leaves of Saccharum ‘UT12’ increased, while Saccharum ‘UT13’ showed decrease in both adaxial and abaxial sides. Stomatal size and density were related to drought adaptation.
Nine anatomical features were calculated for phenotypic correlation coefficient estimation (Table 3). Lamina thickness of Saccharum ‘UT12 and Saccharum ‘UT13’ showed positive correlation with MCC-AD (Midrib cell wall and cuticle thickness-Ad), LCC-AD (Lamina cell wall and cuticle thickness -Ad) and BULH (Bulliform cell horizontal length).
TABLE 3 Estimates of phenotypic correlation coefficients between 9 traits in sugarcane Saccharum ‘UT12’ and Saccharum ‘UT13’ under drought situation
| Character | LT | MCC-AD | LCC-AD | MVB-V | MVB-H | VCWT | BDS-EXL | BULH |
| UT12 | ||||||||
| STD-AB | -0.053 | -0.541 | 0.110 | -0.475 | -0.364 | -0.648* | -0.314 | 0.387 |
| LT | 0.661* | 0.057 | -0.229 | -0.120 | -0.164 | 0.506 | 0.033 | |
| MCC-AD | -0.155 | -0.143 | 0.003 | 0.432 | 0.703* | 0.086 | ||
| LCC-AD | 0.107 | -0.306 | -0.345 | 0.191 | 0.319 | |||
| MVB-V | 0.823** | 0.110 | -0.024 | 0.223 | ||||
| MVB-H | 0.161 | -0.099 | -0.226 | |||||
| VCWT | 0.074 | -0.190 | ||||||
| BDS-EXL | 0.609 | |||||||
| UT13 | ||||||||
| STD-AB | 0.126 | 0.504 | 0.745* | -0.607 | -0.636* | -0.343 | -0.073 | 0.124 |
| LT | 0.202 | 0.029 | -0.131 | -0.275 | -0.233 | -0.071 | 0.561 | |
| MCC-AD | 0.175 | -0.529 | -0.735** | -0.106 | -0.277 | -0.222 | ||
| LCC-AD | -0.431 | -0.165 | -0.261 | -0.379 | -0.075 | |||
| MVB-V | 0.235 | 0.302 | 0.197 | -0.122 | ||||
| MVB-H | 0.315 | -0.147 | -0.056 | |||||
| VCWT | -0.611 | -0.653* | ||||||
| BDS-EXL | 0.671* | |||||||
* Significant correlation at P < 0.05, ** Significant correlation at P < 0.001.(LT- Lamina thickness; MCC-AD- Midrib cell wall and cuticle thickness (Ad); LCC-AD- Lamina cell wall and cuticle thickness (Ad); MVB-V- Midrib major vascular bundle (vertical length); MVB-H- Midrib major vascular bundle (horizontal length); VCWT-Vessel cell wall thickness; BDS-EXL- Bundle sheath extension length; BULH-Bulliform cell horizontal length;STD-AB- Stomatal density (ab).
Discussion
Decreasing leaf thickness was an important marker for drought tolerance in sugarcane leaf concurring with our previous study on Saccharum ‘KK3’ (Taratima et al., 2019). Zhang et al. (2015) revealed that some anatomical features such as lower or abaxial cuticle thickness of leaf epidermis were appropriate to examine drought stress level of Saccharum ‘F127’ and Saccharum ‘YL6’. Saccharum ‘UT12’ and ‘UT13’ showed some drought-resistant characters same as in Saccharum ‘F127’ (strongly drought-resistant cultivar) in term of lower epidermis cuticle thickness was getting thickened under drought stress condition. Moreover, changing of this anatomical character was similar to the studied of Saccharum ‘KK3’ which is a drought tolerance cultivar that abaxial cuticle thickness of leaf epidermis was clearly increased during water stress situation (Taratima et al., 2019). However, diverse species or cultivars should be assessed for anatomical adaptation features (Graca et al., 2010). Generally, leaf thickness was associated with midrib and lamina vascular bundle increase. In this study, almost all anatomical characteristics of major vascular bundles of midrib and lamina were significantly different in Saccharum ‘UT12’, while only several characteristics were significant in Saccharum ‘UT13’. All major vascular bundle features of lamina in Saccharum ‘UT12’ decreased under drought condition, appropriate for reduced water transportation due to leaf area reduction. After reduction of water content in plant cells, turgor pressure and cell volume decreased, weakening cell walls. If this phenomenon occurs continually for a long time, cells compact and higher solute concentrations cause drought stress sensitivity of plant growth (Udomprasert, 2015).
Transportation of water and food via tracheal elements was related to the photosynthetic rate. Lack of water during plant growth inhibited transportation of water and food by turgor pressure reduction (Taiz & Zeiger, 2002). Bundle-sheath cells and vascular bundle sizes were associated with respiration and photosynthetic percentage (Wu, Liu, Wang, Zhou, & Chen, 2011). Vascular bundle size enlargement improved water and food transportation efficiency (Bosabalidis & Kofdis, 2002).
Plant adaptation with heed to water retention was revealed by leaf area reduction. Epidermal and mesophyll cells decreased in size, whereas cell density also increased due to reduction of transpiration and respiration rate (Bosabalidis & Kofdis, 2002). Under drought stress situations, cell expansion disruption resulted in deceleration of leaf extension, causing interruption of H-ion movement across cell membranes. Cell and leaf expansion postponement also affected transpiration rate reduction and helped to preserve water content within the cells during drought stress conditions (Udomprasert, 2015). Some studies revealed that leaf thickness was associated with photosynthetic rate and plant growth under drought stress conditions. Generally, leaf thickness increased in drought tolerant plants under drought stress environments, resulting in increased mesophyll density (Ngernmuen, 2013; Kulya et al., 2014).
Closing of stomata in drought stress environments caused transpiration rate reduction that reduced photosynthetic rates and CO2 fixation (Taiz & Zeiger, 2002). Nevertheless, more factors affected the photosynthetic rate. Some reports revealed no significant difference in photosynthetic rates for plant growth under drought stress conditions and showed anatomical traits of leaf thickness decreasing, stomatal density increasing or stomatal size decreasing (Bosabalidis & Kofdis, 2002; Nawazish et al., 2006).
Bulliform cell size of Saccharum ‘UT12’ significantly decreased after treatment but increased in Saccharum ‘UT13’, especially in horizontal length (P < 0.05). This finding concurred with Nawazish et al. (2006) who determined that bulliform plant cells expanded as an anatomical adaptation to drought stress of Cenchrus ciliaris L. leaf.
Responsiveness of stomata to drought condition varied in some plant species or cultivars (Graca et al., 2010). Drought stress tolerant plants also exhibited high photosynthetic rates. Photosystem II functioning still constant as long as experimental periods causes of protein protection (Lu & Zhang, 1999). Hence, the photosynthetic process was advocated by stomatal density increasing and stomatal size decreasing (Nawazish et al., 2006). This suggested that Saccharum ‘UT13’ had higher drought tolerance than Saccharum ‘UT12’.
Nawazish et al. (2006) and Taratima et al. (2019) reported that increasing bulliform cells and lamina thickness were related to anatomical adaptation under drought. When the correlation between lamina thickness and bulliform cell size was compared, Saccharum ‘UT13’ showed higher positive correlation than Saccharum ‘UT12’. Abaxial stomatal density presented negative correlation with lamina thickness in Saccharum ‘UT12’, while positive correlation in Saccharum ‘UT13’. This positive correlation indicated that increasing lamina thickness may expand bulliform cells. This result agreed with Bosabalidis and Kofdis, (2002), Nawazish et al. (2006), Ngernmuen, (2013) and Kulya et al. (2014) who reported on plant adaptation based on anatomical features. Although anatomical characteristics in drought stress conditions were investigated in some previous reports, their anatomical correlations remain poorly understood. However, the correlation of some anatomical characteristics may not be persistent due to several factors such as diverse cultivar, developmental stage, climate change or environmental management.
Ethical statement: authors declare that they all agree with this publication and made significant contributions; that there is no conflict of interest of any kind; and that we followed all pertinent ethical and legal procedures and requirements. All financial sources are fully and clearly stated in the acknowledgements section. A signed document has been filed in the journal archives.

