


 Inglés (pdf)
 Articulo en XML
 Referencias del artículo
 Enviar articulo por email
 Citado por SciELO
  Similares en
SciELO
Similares en
SciELO  uBio
uBio 
 Permalink
Introduction
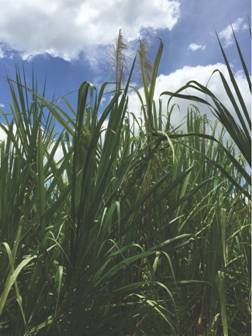
The wild cane plant fiber (Gynerium sagittatum Aubl. P. Beauv.) is the essential raw material for the elaboration of several handcrafts, where the “vueltiao” hat stands out, being a symbol of Colombian cultural identity. Unfortunately, this genetic resource is disappearing over time leading to scarcity and increasing the costs of the raw material for the artisanal sector. This compromises in the near future the economy, labor, social stability, life quality, tradition, folklore, and the identity of one of the most unprotected social sectors in the country, the indigenous people (Zorro & Prieto, 1999). In the elaboration of handcrafts, artisans show that there are differences among the three genotypes called “Criolla”, “Martinera” and “Costera”. The “Martinera” and “Costera” genotypes make the manufacturing process hard, diminishing the efficiency in the artisan’s work; whereas the “Criolla” genotypes are easy to manipulate, therefore they are used in the elaboration of finer and of greater cost crafts. The biodiversity of wild cane (Fig. 1) in Colombia is threatened by the risk of losing its genetic resource due to habitat destruction with anthropogenic activities such as cattle and agriculture. Anthropogenic activities lead to fragmentation and consequently to the reduction of the genetic diversity of the species (Aramendiz-Tatis, Espitia-Camacho, & Cardona-Ayala, 2009). Currently, there are scarce studies based on molecular characterizations for the different wild cane specimens. The lack of knowledge of the species diversity with increased genetic vulnerability to pests, diseases and other adverse factors due to genetic uniformity, poses a high risk of losing this plant genetic resource (Zorro& Prieto, 1999).
Characterization studies that described the morphological variation were performed by Aramendiz-Tatis et al. (2009), detecting five phenotypic classes. Through genetic diversity studies using the AFLP technique among populations from different regions of Colombia, multiple correspondence analysis distinguished three groups. Traits with desirable agronomic attributes were identified for handcrafts, however a low correlation was observed between the geographic distance and the genetic differentiation level of the species (Rivera-Jiménez, Suárez-Padrón, & Palacio-Mejía, 2009). Therefore, at present, there is doubt whether the genotypes used in the elaboration of these handcrafts belong to the same species or if there have been changes at the genetic level that can separate these genotypes in different Gynerium species.
One of the most promising techniques for identifying biological units is the use of DNA standard regions, called DNA barcoding for the species molecular identification (Hebert, Cywinska, Ball, & deWaard, 2003). DNA barcoding can be used as a powerful tool in species that are difficult to identify based on morphological traits. Barcoding can also be used as a taxonomic support tool in delimiting and describing complex species (Tamura, Stecher, Peterson, Filipski, & Kumar, 2013). In addition, this technique helps to identify species with phenotypic plasticity, where there is the possibility of classifying them erroneously (Heinrichs et al., 2011). Therefore, DNA barcodes have the potential to become an important support for the assessment of biodiversity conservation, and they can help to increase flora descriptions (Hartvig, Czako, Kjaer, Nielsen, & Theilade, 2015). Significant advances have been made in the implementation of DNA barcoding for molecular identification in plants, as the nuclear internal transcribed spacer (ITS1 and ITS2) and other regions of the plastid genome such as psbK-psbI, trnH- psbA, atpF-atpH, matK, rbcL, rpoC1, rpoB, rbcL, rpoB, and ycf1, but it has been shown that combining some regions has more discriminative power than using a single region, and currently the most accepted combination are the standardized regions matK and rbcL (CBOL Plant Working Group, 2009; Xu et al., 2015; Dong et al., 2015). Nuclear (ITS) and chloroplast (rbcL, matK) regions were used to identify specimens of grasses (Poaceae tribe Poeae), the ITS marker being the region that achieved the highest success rate for the identification of specimens (Birch, Walsh, Cantrill, Holmes, & Murphy, 2017). In previous studies, the ITS2 nuclear region was identified as the best option for the identification of Poaceae medicinal species (Tahir, Hussain, Ahmed, Ghorbani, & Jamil, 2018). We here evaluated the performance of the regions (ITS, ITS2, matK, rbcLa, and ycf1) as standard barcodes for the identification of wild cane plants in the savannahs of Córdoba, Colombia.
Materials and methods
Plant material, DNA extraction, PCR amplification and sequencing: A total of 35 foliar tissue samples were included in the study. Seven specimens of each were analyzed, from “Criolla 0”, “Criolla 1”, “Criolla 2”, “Martinera”, and “Costera”, genotypes that belong to the Gynerium sagittatum species. The samples of “Criolla 0”, “Criolla 1” and “Criolla 2” were collected in the Cuatro Vientos, San Andres de Sotavento, located at 50 m.a.s.l. The samples of “Martinera” and “Costera” were collected in the Los Vidales, Tuchín, located at 70 m.a.s.l. Collections were made in the Zenues indigenous reservation of the Córdoba department, Colombia (Table 1).
TABLE 1 Genotypes and collection site analyzed in this study
| Sample ID | Genotype | Genus | Total no. of plants | Collection site |
| C-0 | Criolla 0 | Gynerium | 7 | Cuatro vientos1 |
| C-1 | Criolla 1 | Gynerium | 7 | Cuatro vientos1 |
| C-2 | Criolla 2 | Gynerium | 7 | Cuatro vientos1 |
| M | Martinera | Gynerium | 7 | Los Vidales2 |
| Ct | Costera | Gynerium | 7 | Los Vidales2 |
1San Andrés de Sotavento- Latitude: 9º15´2”N - Longitude: 75º32´6”W: 50m. Department of Córdoba. Colombia.
2Tuchín- Latitude: 9º14´22”N - Longitude 75º32´9”W: 70m. Department of Córdoba. Colombia.
Young leaves (without midrib) were detached from each plant, and a 1 cm2 piece of leaf tissue was desiccated in an airtight plastic bag containing silica gel. Genomic DNA was isolated using a modified CTAB 2 % protocol (Doyle & Doyle, 1990). PCR products for two nuclear ribosomal internal transcribed spacer (ITS1 and ITS2) and three plastid barcodes (the coding genes matK, rbcL and ycf1) were amplified and sequenced using universal primers (Kress et al., 2009; Soltis & Soltis, 2009; Chen et al., 2010; Dong et al., 2015; Table 2). The PCR reaction (10 μL) contained approximately 50 ng (1 μL) of template DNA according to the protocols of (CBOL Plant Working Group, 2009; Rivera-Jiménez et al., 2017). The sequencing reactions were performed in both directions according to the specifications of the BigDye Terminator Cycle Sequencing Kit from Applied Biosystems V 3.1 (Applied Biosystems). All sequences have been deposited in GenBank under accession numbers KY549399-KY549417 for the matK, KY549418-KY549441 for the rbcL and KY522854-KY522874 for the ITS regions. We also included public sequences of the matK gene (GenBank: HE586080.1) and of the rbcL gene (GenBank: U31105.1) from Gynerium sagittatumspecies.
TABLE 2 A list of primers used for PCR and sequence in this study
| Region | Primer | Sequence 5′-3′ | Tm (ºC) | Reference |
| ITS1 | 5a fwd | CCTTATCATTTAGAGGAAGGAG | 50 ºC | (Chen et al., 2010) |
| 4 ver | TCCTCCGCTTATTGATATGC | |||
| ITS2 | S2F | ATGCGATACTTGGTGTGAAT | 56 ºC | (Chen et al., 2010) |
| S3R | GACGCTTCTCCAGACTACAAT | |||
| matK | 1RKIM-f | ACCCAGTCCATCTGGAAATCTTGGTTC | 52.2 ºC | International Barcode of Life (iBOL) |
| 3FKIM-r | CGTACAGTACTTTTGTGTTTACGAG | |||
| rbcL | rbcLa-F | ATGTCACCACAAACAGAGACTAAAGC | 62 ºC | (Kress et al., 2009) |
| rbcLa-R | GTAAAATCAAGTCCACCRCG | |||
| ycf1 | ycf1bF | TCTCGACGAAAATCAGATTGTTGTGAAT | 57 ºC | (Dong et al., 2015) |
| ycf1bR | ATACATGTCAAAGTGATGGAAAA |
Data analysis: DNA barcodes candidates were edited using the BioEdit software, version 7.0.9.0 (Hall, 1999). Also manual adjustments were made. All sequences were deposited in the GenBank (Appendix 1). Informative polymorphic characters were identified by MEGA6 (Tamura et al., 2013). Alignment of the sequences was performed using the MUSCLE alignment tool (Edgar, 2004). The different locus combinations were taken into account for the evaluation of the model independently in each marker. The barcode analysis was calculated using the Kimura 2-Parameter (K2P) model (Kimura, 1980). The effectiveness of the regions (ITS, ITS2, matK, rbcLa, ycf1) and their combinations as barcodes was evaluated using three different methods.
Genetic Distance-Based Method: The program TaxonDNA (Meier, Shiyang, Vaidya, & Ng, 2006) was used to test the accuracy of the species assignments, the cluster analysis, and the distribution of interspecific and intraspecific distances in the dataset. The best match (BM) and the best close match (BCM) were taken into account, as well as the formation of groups determined by similar sequences for each region evaluated, by thresholds of 1 % and 5 %.
Tree-Based Method: A tree-based method was used to evaluate the species resolution degree (identification). Each barcode region and possible combinations of the regions were evaluated by the species resolution degree they provided. The analyzes were performed according to the consensus parameters of Neighbor-Joining (NJ), Kimura 2-Parameter (K2P) and cluster analysis by sequence divergence between genotypes, using MEGA6 (Tamura et al., 2013). Node support was assessed using the bootstrap resampling (1 000 replicates) (Felsenstein, 1985). The species were determined by analyzing the lengths of the branches in pairs and if two species diverge, they must be separated by a branch length greater than zero and a bootstrap greater than 50 %, under these criteria they are considered separate species.
Phylogenetic analysis: The phylogenetic analysis used concatenated and individual genes datasets. The best-fitting substitution model was calculated using jModeltest (Darriba, Taboada, Doallo, & Posada, 2012) according to the AIC criterion (Akaike, 1973). The selection of best-fitting model for each region were: for rbcl (TIM2), matK (HKY), ITS (HKY-G) and for combined dataset (GTR+G+I). The matrixes were analyzed using Bayesian Inference (BI) in MrBayes V.3.2 (Ronquist et al., 2012) and Maximum Likelihood (ML) with RAxML version 8 on XSEDE (Stamatakis, 2014). For the BI, 500 000 000 generations were iterated, and sampled every 1 000 generations, for two runs each with four chains. The first 25 % trees were discarded as burn-in. For the ML analyses, the GTRGAMMA model was performed and bootstrap values were obtained using rapid bootstrapping with 1 000 replicates. Trees were edited using TreeGraph2 beta version 2.0.52-347 (Stöver & Müller, 2010). Same loci from the species Zea mays, Piptatherum miliaceum, and Pennisetum purpureum were used as outgroup. Phylogenetic analyses, as well as “best of fit” modeling test, were performed at CIPRES Science Gateway (www.phylo.org).
Results
PCR amplification and sequencing: The sequence information of five candidate DNA barcode markers, ITS, matK, rbcL, and ycf1, are provided in Table 3. Sequencing success rates were 92.6 % (ITS), 100 % (matK), and 100 % (rbcL). The complete ITS region (ITS1-ITS2) was used as a single barcode locus. Unfortunately for ycf1, the universal primer proposed by Dong et al. (2015) did not returned a great amplification success. The present study submitted 64 new sequences to NCBI, which included 21 sequences of nrITS1+ nrITS2; 19 sequences of matK, and 24 sequences of rbcL (Appendix 1). Using BLAST analysis, all the loci correctly identified a 100 % of the samples at species level (G. sagittatum); while ITS1 had an identification rate of 96 % at the family level (Poaceae). The absence of species-level identification using the region barcode nrITS1 is due to the lack of sequence records in the NCBI database.
TABLE 3 Characteristics of the eight wild cane barcodes evaluated in this study, including global percentage PCR for each genotype
| Parameter | C-0 | C-1 | C-2 | M | Ct | ITS | matK | rbcL | ycf1 | ITS + matK | ITS + rbcL | matK + rbcL | ITS + matK + rbcL |
| Universality of the primers | - | - | - | - | - | Yes | Yes | Yes | No | - | - | - | - |
| Percentage PCR success (%) | 100 | 100 | 100 | 85 | 90 | 91.8 | 88.5 | 95.1 | 0 | - | - | - | - |
| Percentage sequencing success (%) | 98 | 93 | 100 | 100 | 95 | 92.6 | 100 | 100 | - | - | - | - | - |
| Length of aligned sequence (bp) | - | - | - | - | - | 865 | 790 | 584 | - | 1 655 | 1 449 | 1 374 | 2 239 |
| No. of parsimony informative sites/variable sites | - | - | - | - | - | 85/248 | 4/17.0 | 0/1 | - | 89/265 | 85/249 | 4/17.0 | 89/266 |
| No. of species samples (individuals) | - | - | - | - | - | 20 | 19 | 24 | - | 21 | 21 | 19 | 21 |
| Percentage ability to discriminate (NJ) | - | - | - | - | - | 0 | 0 | 0 | 0 | 0 | 0 | 0 | 0 |
Genotype: C-0= Criolla 0; C-1= Criolla 1; C-2= Criolla 2; M= Martinera; Ct=Costera.
Intra- and interspecific diversity: The aligned sequence lengths were amplified between 865 bp for ITS to 584 bp for rbcL, the ITS region showed the most variable and informative sites of parsimony, followed by matK (Table 4). The intraspecific distances in pairs in the seven bar codes varied from a minimum of 0 to a maximum of 17.9 %. The mean intraspecific distances were minimum for rbcL (0.01 %) and maximum for ITS (5.8 %). Interspecific distances in pairs varied from a minimum of 0 % to a maximum of 18.3 % (Table 4). The mean interspecific distances were minimum for rbcL (0.01 %) and maximum for ITS (5.9 %), therefore, ITS showed the highest intra and interspecific average distance. The combination of sequences from different barcode regions increased intraspecific and interspecific mean distances. The data showed overlap between intraspecific and interspecific distances of the individual or concatenated sequences. The minimum overlap percentage was 91.4 % in combination sequences using two genes (ITS+matK) and the maximum 100 % using the matK region and the combination sequences of two regions (matK+rpoC1) (Table 4).
TABLE 4 Summary of the pairwise intraspecific and interspecific distances in the wild cane barcode loci
| Barco de locus | Intraspecific distances (%) | Interspecific distances (%) | Intra-/interspecific distance overlap with 5 % error margin on both sides | |||||
| (no. of sequences) | Min | Max | Mean | Min | Max | Mean | Overlapping distance range | Intra-/interspecific sequences in the overlap |
| ITS (21) | 0.7 | 17.9 | 5.8 | 0.53 | 18.3 | 5.89 | 1.1-17.9 | 94.4 |
| matK (20) | 0 | 1.4 | 0.4 | 0 | 1.3 | 0.24 | 0-1.40 | 100 |
| rbcL (25) | 0 | 0.2 | 0.01 | 0 | 0.2 | 0.01 | 0-0.17 | 99.3 |
| ITS+matK (21) | 0.5 | 12.9 | 3.6 | 0.4 | 18.3 | 4.09 | 0.82-12.94 | 91.3 |
| ITS+rbcL (21) | 0.4 | 17.9 | 3.7 | 0.3 | 14.5 | 3.21 | 0.52-17.93 | 95.5 |
| matK+rbcL (20) | 0 | 1.4 | 0.3 | 0 | 1.3 | 0.19 | 0-1.44 | 100 |
| ITS+matK+rbcL (21) | 0.4 | 6.6 | 2.3 | 0.2 | 12.8 | 2.5 | 0.48-6.60 | 91.8 |
Species discrimination: The identification of species through the use of BM or BCM was deficient for the three loci and their combinations, because in all cases the identification success was < 40 % (Table 5). The analysis based on TaxonDNA software showed that the concatenated region ITS+matK had the highest rate for the correct identification of species (BM: 33.3 %; BCM: 33.3 %;) followed by ITS, ITS+matK+rbcL, ITS+rbcL (Table 5) and matK, rbcL, matK+rbcL had the lowest discrimination rate (BM: 0 %; and BCM: 0 %). To evaluate the efficiency of genes to produce specific groups of species, we use the “group” function of TaxonDNA at two different thresholds, 1 % and 0.5 %. With a threshold of 1 %, ITS worked best by producing 15 groups, and 21 of those groups included only one species (Table 6). With a threshold of 0.5 %, the ITS region also produced the maximum number of groups (21), with only one species of equal value (Table 6).
TABLE 5 Identification based on the “best match” and “best close-match” functions of the TaxonDNA program
| Barcode locus | Best match | Incorrect % | Best close match | Incorrect % | ||
| Correct % | Ambiguous % | Correct % | Ambiguous % | |||
| ITS (21) | 28.6 | 0 | 71.4 | 28.6 | 0 | 71.4 |
| matK (20) | 0 | 90 | 10 | 0 | 90 | 10 |
| rbcL (25) | 0 | 96 | 4 | 0 | 96 | 4 |
| ITS+matK (21) | 33.3 | 0 | 66.6 | 33.3 | 0 | 66.6 |
| ITS+rbcL (21) | 23.8 | 0 | 76.2 | 23.8 | 0 | 76.2 |
| matK+rbcL (20) | 0 | 85 | 15 | 0 | 85 | 15 |
| ITS+matK+rbcL (21) | 28.6 | 0 | 71.4 | 28.6 | 0 | 71.4 |
TABLE 6 Cluster analysis of wild cane based on the plant barcodes
| Barcode locus | At 1 % threshold | Largest pairwise distance (%) | Clusters with only one species | At 0.5 % threshold | Clusters with only one species | |||
| No. of clusters | % of clusters with threshold violation | No. of clusters | % of clusters with threshold violation | Largest pairwise distance (%) | ||||
| ITS (21) | 15 | 0 | 0 | 21 | 21 | 0 | 0 | 21 |
| matK (20) | 2 | 50 | 1.3 | 1 | 3 | 0 | 0.4 | 2 |
| rbcL (25) | 1 | 0 | 0.2 | 0 | 1 | 0 | 0.2 | 0 |
| ITS+matK (21) | 11 | 9.1 | 8.8 | 10 | 18 | 5.5 | 0.6 | 16 |
| ITS+rbcL (21) | 10 | 10 | 7.1 | 9 | 15 | 6.7 | 1.1 | 14 |
| matK+rbcL (20) | 2 | 50 | 1.2 | 1 | 3 | 0 | 0.2 | 2 |
| ITS+matK+rbcL (21) | 5 | 20 | 7.1 | 4 | 14 | 7.1 | 4.8 | 13 |
Tree based analyses: NJ trees were constructed for each individual gene and the different gene combinations based on K2P. One of this research objectives was to test whether DNA regions barcodes could discriminate among wild cane species. The ITS region (Fig. 2) that showed a higher polymorphism at sequence level did not show defined clusters that would allow to separate the genotypes according to the phenotypic and/or genetic characteristics reported by Aramendiz-Tatis et al. (2009) and Rivera-Jiménez et al. (2009) in previous studies. In the same way, it obtained the same results in the other trees generated by other locus and regions combinations. None of the sequences showed intraspecific variations (data not shown), these genotypes shared the same cluster for each individual gene and the different gene combinations, and some of the species positions were within the other species clades.
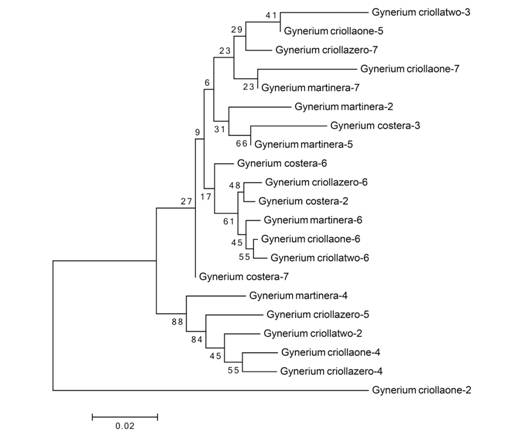
Fig. 2 Neighbor-joining K2P tree based on analysis of the ITS region. The numbers above the nodes correspond to bootstrap values > 50 %.
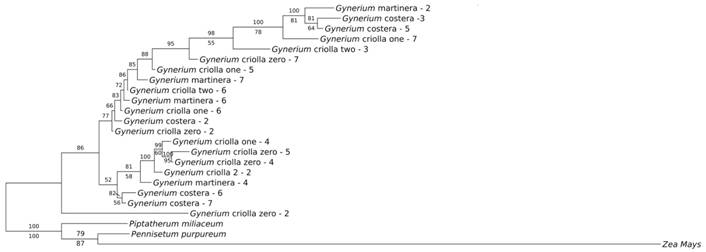
The evaluation of barcoding sequences based on phylogenetic trees was established by the usage of individual regions and their combinations (Appendix 2, Appendix 3, Appendix 4). The most informative tree (representing the most well-resolved tree) was the BI tree using the ITS region (Fig. 3). However, the analyses showed that there was no formation of defined groups when using morphology and genotypes previous classification through Bayesian Inference analysis (Fig. 3), thus showing a similar behavior compared to the other methods. The non-existence of well-differentiated groups in the analyzed taxa, suggests that all the studied genotypes belong to the same species and that some morphological variations can be the result of environmental factors, which suggests the existence of phenotypic plasticity in this species.
Discussion
In the present study, four plant loci (ITS, matK, rbcL and ycf1) were evaluated as DNA barcoding for the differentiation of possible wild cane species. These regions had already been tested as DNA barcoding regions in terrestrial plants (Hollingsworth, 2014). The ycf1 locus used in this research was proposed by Dong et al. (2015) for its potential use as DNA barcoding in different plant groups. The efficiency of the DNA barcoding in this study was justified based on its potential use to differentiate species between angiosperm plants and systematic studies in Poaceae (Barker, Linder, & Harley, 1995; Grass Phylogeny Working Group II, 2011; Hollingsworth, 2014). Some authors such as Neubig and Abbott (2010) have shown low PCR success of this region for plants, like in this study, especially in the Lauraceae and Annonaceae families. On the other hand, through the use of the ITS region as a DNA barcode, genetic diversity studies have been carried out in plants of the same family of Poaceae, as in sugarcane (Saccharum), separating accessions of S. spontaneum from S. officinarum, S. barberi, S. sinense, S. robustum (Yang et al., 2016). Many efforts have been made to discover DNA barcoding regions that are more variable and capable to identify taxa of terrestrial plants.
According to our results, ITS has more parsimonious informative sites and better discriminatory power among the proposed loci, i.e., matK and rbcL, which is consistent with the results of many previous studies (Ashfaq, Asif, Anjum, & Zafar, 2013; Hartvig et al., 2015; Xu et al., 2015; Tahir et al., 2018). The analysis of intra and interspecific distances showed that ITS had the highest sequence divergence (Table 4). However, according to the Neighbor-joining (NJ) tree, the ITS region and the different gene combinations had a zero-discrimination rate on the wild cane specimens (0 %) (Table 4). This ITS nuclear region has been used for a long time to study the phylogeny, taxonomy, and the species identification in plants (Barker et al., 1995; Grass Phylogeny Working Group II, 2011; Ashfaq et al., 2013; Hollingsworth, 2014). Studies carried out by Tahir et al. (2018) conclude that the ITS2 region showed the highest percentages of intra- and interspecific divergences, followed by the matK and rbcL regions for the identification of medicinal species of Poaceae.
Several combinations of two or three locus have been proposed as barcodes, but a consensus on the usefulness of these barcodes has not been achieved (Xu et al., 2015). The analyses conducted in our research indicated that these sequences have high values in the intraspecific average distances of some genotypes and the interspecific distance between them, overlapping their intra- and interspecific distances without differences of DNA barcoding, thus reducing the identification rate of species. The combination of matK+rbcL is proposed by CBOL Plant Working Group (2009) as a universal DNA barcoding for all terrestrial plants, however, in this research, it had the lowest discrimination resolution (0 %) (Table 5) among the four evaluated combinations, due to the low variability of these coding genes. In contrast, the combination of ITS+matK had the highest percentage (33.3 %) species identification compared to the other DNA barcoding candidate regions or combinations (Table 5). According to the distances results, “BM,” “BCM,” and the analysis of Neighbor-joining (NJ) trees, we can predict that all the evaluated specimens can be the same species. However, a strategy to identify the species of this genus would be having a better understanding of the specimens geographic information, an approach that has been used in DNA barcoding (Parveen, Singh, Raghuvanshi, Pradhan, & Babbar, 2012). According to our results, the highest identification criteria were for ‘BM’ and ‘BCM’ compared to the other two evaluation criteria, showing different values for the loci of the evaluated barcode regions. Surprisingly, a nuclear and plastid gene sequences combination reduced the identification success according to the TaxonDNA program “all species barcodes”.
We noticed that in the majority of the wild cane specimens, not only the intraspecific and interspecific distances were very large, but there was also a visible distance overlap in the barcode sequences that ranged from 91.4 to 100 % for the different loci or their combinations. In addition, the reduced identification success in combined sequences may be explained due to the increased level of sequence overlaps or by incongruence between the plastid and nuclear genes (Ashfaq et al., 2013). In a previous study on DNA barcoding of Dendrobium species, Xu et al. (2015) have reported a successful identification of the taxon through TaxonDNA, showing greater success in multilocus regions, based on different program criteria. In another study on the discrimination of cotton species, Ashfaq et al. (2013) have reported low percentages of taxon identification, based on BM and BCM criteria, both in single regions and multilocus regions. Copaci, Pocol, Căprar, and Sicora, (2015) tested DNA barcoding to differentiate species of Calluna vulgaris, they found a lack of intraspecific variability for the matK and rpoC1 markers. In another study, Selvaraj et al. (2012) used ITS region to identify B. diffusa from the other three species, despite the fact that they share many morphological similarities. Previously, Singh, Parveen, Raghuvanshi, and Babbar, (2012) in a study on Dendrobium species determined that the ITS region provided the highest resolution, which allowed to identify species. However, Awad, Fahmy, Mosa, Helmy, and El-Feky (2017) could not discriminate Triticum species through the use of chloroplast genes and their combinations.
We performed cluster analysis to evaluate the barcodes efficiency to separate the species. As a single locus, ITS was the region that discriminated the best, producing 15 clusters and 21 clusters with a single species at a threshold level of 1 %. The loci combination reduced the number of cluster and cluster single-species. None of the regions were tested to produce clusters with single species profiles. At the same threshold, the combination of all three loci (ITS+matK+rbcL) produced 5 clusters, and 4 of those clusters included single species. At a 0.5 % threshold, the number of clusters in ITS were equal to the 1 % threshold, the combination of two loci (ITS+matK) increased the number of clusters from 11 to 18, and cluster single-species also increased (from 10 cluster at 1 % to 16 cluster at 5 %).
The “cluster” analysis and the “clusters included single species” function of the Taxon-DNA program allow the efficiency of the DNA barcoding to separate species. This grouping function showed that ITS region was the DNA barcode that gave the best result, producing a larger number of groups. Although this analysis helps us to understand the resolution power taking into account the low viability of the threshold values, the NJ tree analysis shows that the resolution degree to separate the species was of 0.0 %. Interestingly, the five genotypes (“Criolla 0”, “Criolla 1”, “Criolla 2”, “Martinera” and “Costera”) do not form a specific cluster.
Morphological characterizations performed in these genotypes were reported by Aramendiz-Tatis et al., (2009) identifying genotype groups that showed attributes such as a soft texture fiber, a scanty pubescence pod, a thick stem wall, and a thin stem diameter, this group was colloquially called “criolla”. Second and third groups were characterized by having rough texture fibers, pods with abundant pubescence, thin stem walls, and slightly thick stem diameters, and were denominated “Martinera” and “Costera” respectively, however, the author reports little genetic variability in the accessions studied. Later (Rivera-Jiménez et al., 2009) performed multiple correspondence analysis, using AFLP type markers in the same species, showing a low correlation between the geographical distance and the level of genetic differentiation. According to Kalliola, Puhakka and Salo, (1992) wild cane is characterized by being invasive, rustic, and fast-growing, although it is native from the west of India, it has a wide range of distribution that goes from Mexico, Central America, and all South America to Paraguay, showing that the species is a complex of variants in its morphology and ecology; identifying two types of plants, some with a large stem and others with a short stem in the western Amazon. Several researchers propose that invasive species are highly plastic (Hulme, 2007); consequently, it has been pointed out that the ecological amplitude is correlated to the plasticity in some species (Sultan, 2001). The phenotypic plasticity concept in invasive species has been discussed since the middle of the last century. Baker (1965) reports it as a means that guarantees the adaptive success of this type of plants. In this research, the unique regions of ITS nuclear ribosomal DNA and ITS+matK concatenated regions were the most variable regions and presented all the desired characteristics of a DNA barcoding that meets the requirements for amplification and sequencing. Considering the genetic method based on distance, the tree-based method, and the phylogenetic analysis methods, there was no discrimination of the evaluated genotypes, showing little genetic variability, therefore, it is suggested that all the evaluated individuals (“Criolla”, “Martinera”, and “Costera”) belong to the same species and that the existing morphological differences may be related to phenotypic plasticity.
Ethical statement: authors declare that they all agree with this publication and made significant contributions; that there is no conflict of interest of any kind; and that we followed all pertinent ethical and legal procedures and requirements. All financial sources are fully and clearly stated in the acknowledgements section. A signed document has been filed in the journal archives.

