


 Inglês (pdf)
 Artigo em XML
 Referências do artigo
 Enviar este artigo por email
 Citado por SciELO
  Similares em
SciELO
Similares em
SciELO  uBio
uBio 
 Permalink
Introduction
Brycon is a polyphyletic genus of the family Bryconidae (Abe, Mariguela, Avelino, Foresti, & Oliveira, 2014) that supports subsistence and commercial fisheries, sport fishing, and aquaculture in Central and South America (Zaniboni-Filho, Reynalte-Tataje, & Weingartner, 2006). Although its systematics remain unclear, it is believed to encompass 43 valid species distributed from Southern Mexico to Northern Argentina (Angulo & Gracian-Negrete, 2013; Lima, 2004). The major species diversity occurs in Panama and the Colombian and Ecuadorian trans-Andean rivers (Lima, 2003). Some Brycon species are listed in several risk categories, while others have deficient data for risk categorization and remain considered either as “least concern” based on their wide distribution or are not currently included in the Red List of the International Union for Conservation of Nature (IUCN).
Brycon henni Eigenmann, 1913 is a trans-Andean freshwater fish distributed in the Colombian Magdalena-Cauca and Pacific hydrographic regions (DoNascimiento, Herrera-Collazos, & Maldonado-Ocampo, 2018). Brycon henni reproductive periods appear to be synchronized to rainy periods in natural environments (Builes & Urán, 1974; Mancera-Rodríguez, 2017), but may occur during the entire year in some dams that do not experience drastic changes in water level depth (Martínez-Orozco & Vásquez-Zapata, 2001). In contrast to the asynchronous oocyte maturity and incomplete spawning found in this species in other areas (Builes & Urán, 1974), the similar maturity stage of B. henni oocytes in the Nare and Guatapé Rivers has led researchers to propose that this species performs seasonal and cyclic reproduction with short and massive spawning, without parental care, and exhibits moderate fecundity and reproductive migrations (Mancera-Rodríguez, 2017).
Furthermore, its fishery statistics are absent (Colombian Fishing Statistical Service, SEPEC) even though B. henni is locally considered as part of food security in riverine communities (Lasso et al., 2010), used for sport fishing especially in the upper and middle sections of the Cauca River, and is a promissory resource for commercial temperate-zone aquaculture (Cruz-Casallas, Medina-Robles, & Velasco-Santamaría, 2011; Montoya-López, Carrillo, & Olivera-Ángel, 2006). Additionally, information about species reintroductions remains unknown due to the lack of programmatic monitoring for fish translocations or fishing (FAO, 2011; Povh et al., 2008).
Although it is considered as a “least concern” species, B. henni is susceptible to the harmful effects of habitat disturbances, given that it requires good quality waters (Builes & Urán, 1974; Lasso et al., 2010). Moreover, this species has a short-distance migration range between main river channels and adjacent high-gradient streams (lateral migration) (Builes& Urán, 1974; Lasso et al., 2010), a fact that suggests its natural populations are not panmictic along its distribution range. Indeed, genetically structured populations have been found for B. henni (Hurtado-Alarcón, Mancera-Rodríguez, & Saldamando-Benjumea, 2011; Pineda-Santis et al., 2007) and other congeners such as Brycon hilarii (Sanches & Galetti Jr., 2007, Sanches & Galetti Jr.,2012), Brycon insignis (Matsumoto & Hilsdorf, 2009), Brycon lundii (Wasko & Galetti Jr., 2002), Brycon moorei sinuensis (López, 2006), Brycon opalinus (Melon-Barroso, Hilsdorf, Moreira, Cabello, & Traub-Cseko, 2005), Brycon orbignyanus (Ashikaga, Orsi, Oliveira, Senhorini, & Foresti, 2015; Panarari-Antunes et al., 2011), and Brycon orthotaenia (Sanches et al., 2012).
Currently, only two genetic studies have been performed in B. henni at the regional scale using dominant markers, Random Amplification of Polymorphic DNA (RAPD) (Hurtado-Alarcón et al., 2011; Pineda-Santis et al., 2007). Nonetheless, RAPDs exhibit several disadvantages such as low reproducibility, subjective determination of the real band, homoplasy, inability to detect heterozygotes, and greater sampling variance for dominant allele frequencies compared to codominant alleles (Çiftci, 2003; Lynch & Milligan, 1994).
Forty-four microsatellites have been developed for three cis-Andean Brycon species (Melon-Barroso et al., 2005; Sanches & Galetti Jr., 2012; Viana & Vasconcelos de Macêdo, 2016). Nonetheless, different authors have indicated that the transferability of heterologous microsatellites is limited by unsuccessful amplification in phylogenetically distant species or lower levels of polymorphism, allele size homoplasy, null alleles, interrupted repeat motifs, and even amplification of non-orthologous loci (Barbará et al., 2007; Primmer, Painter, Koskinen, Palo, & Merilä, 2005; Rutkowski, Sielezniew, & Szostak, 2009; Yue, Balazs, & Laszlo, 2010).
Considering the above constraints, we took advantage of the low-coverage sequenced genomic library of one B. henni specimen collected in the Colombian Cauca River (Landínez-García, Alzate, & Márquez, 2016) to develop the first set of B. henni microsatellite loci. Likewise, we used these loci to study genetic diversity and population structure at a local (less than 30 km) and regional (600 km) scale using samples from three natural populations of this species. These tools will allow researchers to elucidate/hypothesize the causes of B. henni population genetic structure across its distribution area and can be applied in the future to monitor genetic diversity changes in regions influenced by anthropogenic activities as well as support restocking and reinforcement programs.
Materials and methods
Samples and studied area: This study analyzed a total of 90 B. henni tissues preserved in 70 % ethanol that were provided by Integral S. A., through two scientific cooperation agreements (September 19th, 2013; Grant CT-2013-002443), framed under an environmental permit from Ministerio de Ambiente, Vivienda y Desarrollo Territorial de Colombia # 0155 on January 30th, 2009 for the Ituango hydropower plant construction. The samples, collected from 2011 to 2013, came from three sites of the Colombian Magdalena-Cauca hydrographic region (Fig. 1A); in two of them (Ituango River = 19 samples and Espíritu Santo River = 44 samples) (Fig. 1B) samples were collected before the construction of the Ituango hydropower station in the Cauca River. The other site is located upstream of the Peñol-Guatapé dam (La Magdalena Stream, a tributary of the Nare River = 27 samples) (Fig. 1C).
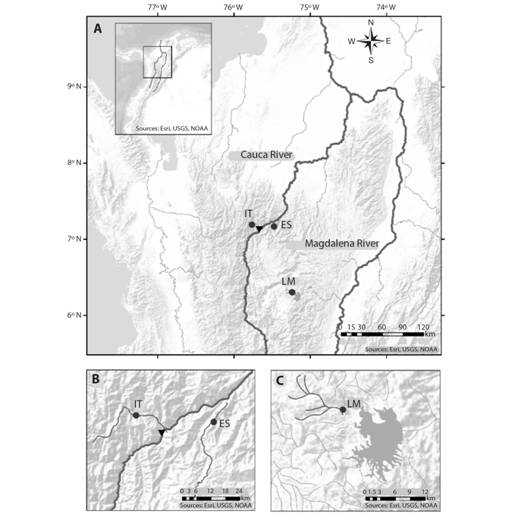
Fig. 1 Brycon henni sampling sites (dark circles) in three sectors of the (A) Colombian Magdalena-Cauca hydrographic region: (B) the Cauca River (IT, Ituango River; ES, Espíritu Santo River) and (C) the Magdalena River (La Magdalena Stream). The black triangle denotes the location of the Ituango hydropower plant.
The Ituango (IT) and Espíritu Santo (ES) rivers drain on the West and East margins of the Cauca River, respectively, and are separated by only 30 km. This area, subjected to mining, agriculture, and artisanal and sport fisheries, corresponds to sections 2 and 3 of the Cauca River as described previously by Landínez-García and Márquez (2016). These areas feature steep topography with deep canyons, riverbed narrowing, and drastic changes in water velocities and slopes. On the other hand, La Magdalena Stream (LM) exhibits lower slopes and water levels, sandy and rocky substrates, and relatively turbid waters due to surrounding urban centers and paths that expose it to anthropic activities (for example, litter, erosion, sewage discharges, and agrochemical lixiviates).
Microsatellite loci identification and primer development: To identify microsatellite loci and develop primers, we used reads obtained from the genomic library of one B. henni specimen collected in the Cauca River (Colombia) that was previously sequenced with the Illumina Miseq platform using the whole genome shotgun strategy and 250 base paired-end reads (Landínez-García et al., 2016). Cleaning of nuclear genome reads, assemblage into contigs, primer design, electronic polymerase chain reaction (PCR), polymorphism analysis, validation, and amplification condition optimization for 50 microsatellite loci were performed following the methodology described by Landínez-García and Marquez (2016).
Briefly, the reads of the nuclear genome were submitted to PRINSEQ-LITE software to clean and eliminate short sequences (less than 100 base pairs [bp]), duplicated reads, and low-quality regions at both read ends and then assembled them into contigs with ABYSS v.1.3.5 (Simpson et al., 2009) using a Kmer 64. Additionally, PAL_FINDER v.0.02.03 (Castoe et al., 2010) was used to extract the contigs that contained microsatellite loci with perfect motifs of 3mer, 4mer, and 5mer repeats. These longer motifs were selected to avoid genotyping errors associated with dinucleotide motifs (Guichoux et al., 2011; Schoebel et al., 2013). PRIMER3 v.2.0 (Rozen & Skaletsky, 2000) was used to design the primers for microsatellite loci amplification from their flanking sequences and electronic PCR (Rotmistrovsky, Jang, & Schuler, 2004) to verify correct primer alignment in silico (http://www.ncbi.nlm.nih.gov/tools/epcr/).
Levels of polymorphism and sample genotyping: A total of 50 microsatellite loci were selected for optimization and analysis of levels of polymorphism in 15 B. henni samples using standard PCR conditions (Sambrook, Fritsch, & Maniatis, 2001); amplified fragments were separated with silver-stained polyacrylamide gels. Polymorphic loci that exhibited consistent amplification, good band resolution, specificity, desired fragment size (100-400 bp), and heterozygosity in the analyzed samples were selected and fluorescently labelled for further amplification of 90 samples from three different sites.
Amplification reactions were 10 μl and contained the following final component concentrations: 0.6 pmol/μl of each forward primer, attached by its 5’ end to one of the four adapters (Tails A, B, C and D) described by Blacket, Robin, Good, Lee, & Miller (2012), 1.2 pmol/μl of each reverse primer, 1.0 pmol/μlof each fluorescently labelled adapter (6-FAM, VIC, NED, and PET; Applied Biosystems), 0.22X Master Mix, 2.5 % v/v GC Enhancer Platinum Multiplex PCR Master Mix (Applied Biosystems), and 3-5 ng/μl of template DNA isolated withGeneJET Genomic DNA Purification kit (Thermo Scientific). PCR was performed using a T100 thermocycler (BioRad) with the following thermal profile: initial denaturation at 95 °C for 3 min and 42 cycles of denaturation at 90 °C for 22 s and annealing at 56 °C for 20 s. There were no extension and final elongation steps.
PCR products were submitted to electrophoresis, using LIZ500 (Applied Biosystems) as an internal molecular size on an ABI 3730 XL automated sequencer (Applied Biosystems), and GENEMAPPER v.4.0 (Applied Biosystems) was used to denote the allelic fragments according to their molecular size. Potential genotyping errors and null alleles were evaluated using MICRO-CHECKER v.2.2.3 (van Oosterhout, Hutchinson, Wills, & Shipley, 2004).
Genetic diversity: The average number of alleles per locus was calculated using GENALEX v.6.503 (Peakall & Smouse, 2006), and estimation of the observed (HO) and expected (HE) heterozygosities, inbreeding coefficient (FIS), as well as the tests for departures from Hardy-Weinberg and Linkage equilibria, were performed using ARLEQUIN v.3.5.2.2 (Excoffier, Laval, & Schneider, 2005). Statistical significance for multiple comparisons was adjusted by applying the sequential Bonferroni correction (Rice, 1989). The polymorphic information content (PIC) for each marker was determined using CERVUS v.3.0.7 (Marshall, Slate, Kruuk, & Pemberton, 1998).
Genetic structure: Genetic differentiation among samples from the three sites was calculated using the standardized statistics F’ST (Meirmans, 2006) and Jost’s DEST (Meirmans & Hedrick, 2011), as well as an analysis of molecular variance (AMOVA; (Meirmans, 2006) included in GENALEX v.6.503 (Peakall & Smouse, 2006). Additionally, R package Adegenet (Jombart, 2008) was used to accomplish the discriminant analysis of principal components of the diploid genotypes of 21 loci (42 variables) in 90 individuals. A total of 42 principal components were retained for subsequent discriminant analysis and the first two linear discriminants that explained more than 80 % of the total variation were used to construct a scatter plot.
Finally, STRUCTURE v.2.3.4 was used for Bayesian analysis of population partitioning (Pritchard, Stephens, & Donnelly, 2000) to test genetic differentiation among and within sample sites. The run length that reached convergence consisted of 500 000 Monte Carlo Markov Chain (MCMC) steps and 45 000 iterations as burn-in. To improve the performance of the algorithm when the signal of the structure was relatively weak, the LOCPRIOR option was set, and the admixture model and correlated frequencies parameters were used (Hubisz, Falush, Stephens, & Pritchard, 2009). For each simulated K value, which ranged from 1 to 6, the analysis was repeated 20 times and the ΔK ad hoc statistic (Evanno, Regnaut, & Goudet, 2005) was calculated with STRUCTURE HARVESTER (Earl & VonHoldt, 2012) for the best estimate of genetic stocks (K). CLUMPP v.1.1.2b (Jakobsson & Rosenberg, 2007) was used to summarize the results of independent STRUCTURE runs; we selected the algorithm full search with the function G’normalized, and the parameters were set at their default values. The Q-matrices obtained were plotted in a histogram that displayed the ancestry of each individual in each population using DISTRUCT v.1.1 (Rosenberg, 2004). Based on the ancestry coefficients provided by STRUCTURE and CLUMPP, the individuals were reorganized by genetic stock in sample sites that showed multiple stocks and were later submitted to the genetic analyses described below.
Results
Microsatellite loci development and detection of outlier loci: A set of 21 of the 50 initially evaluated loci satisfied the selection criteria described above (Table 1). Allele lengths ranged from 124 to 317 bp, and the number of alleles per locus oscillated from 4 to 13, with an average number of 8.500 alleles per locus (Table 1). Micro-Checker analysis did not indicate any scoring errors attributable to stuttering, null alleles, or large allele dropout at the loci. Pairwise tests of genotypic disequilibrium were not significant and allelic frequencies were concordant with Hardy-Weinberg equilibrium expectations in at least 2 of 4 analyzed samples indicating that heterozygote deficit or excess detected in some cases depends on genetic characteristics of the sample (Table 2).
TABLE 1 Primer sequences and characteristics of 21 microsatellite loci developed for Brycon henni
| Locus | Repeat motif | Forward and Reverse primer sequences (5′−3′) | Ra | Na | PIC | Adapter |
| Bhe05 | (ATAC)n | AAGGAAGCCAACCAACATCG GTTTCCTCAACATGGATAAGCG | 218-246 | 7 | 0.771 | Tail A |
| Bhe08 | (AAAG)n | GCTCTGTGATCTGCAGGTGG TGTTGAAATATGTTCATAGGAAAAGTGG | 136-172 | 10 | 0.762 | Tail C |
| Bhe12 | (AAAC)n | GTGTTGAATCTGCGACCTGC GCGGTGAGTGAAATGCTCC | 209-257 | 12 | 0.585 | Tail D |
| Bhe16 | (AAAC)n | CCCATGGATTGTATACCGGC GTTAAGTCCAGAGCCCACCC | 253-317 | 12 | 0.761 | Tail D |
| Bhe19 | (TGCC)n | AGCATTTGCGAGTGAAAACG GTGTCTGGTGTGGATGTGGG | 178-230 | 10 | 0.793 | Tail A |
| Bhe20 | (AAAT)n | GTGGCGCAACAGGAGACC TGCAGAGCTCTAATTCTTCCCC | 124-148 | 7 | 0.736 | Tail C |
| Bhe24 | (AATG)n | TCTCAACTCTGGGAGACCCC CTAGGCATTGAGTGCATGGG | 290-306 | 5 | 0.383 | Tail C |
| Bhe26 | (TCTG)n | GAGCGAGTCATCTTGTGATGG ATGATTGCTCAAATGCAGGC | 144-176 | 7 | 0.697 | Tail B |
| Bhe27 | (AAGAG)n | CCCTGCATGTTCTCATTTGC ACTCATCAGGGATTGGCTGG | 138-158 | 5 | 0.657 | Tail D |
| Bhe30 | (TGC)n | CCCAACCTGAAATATTTATGGACC GCAGTAAAGCCCCTGTCCC | 126-165 | 11 | 0.803 | Tail B |
| Bhe31 | (TCTG)n | AGCTCTGTGTTGAAGCTGCG CAGTACCTTGAAGAGGCGTCC | 173-209 | 7 | 0.728 | Tail C |
| Bhe32 | (ATCAG)n | CTCTCGGCTCTCTGAAAGGG GGGGTTCATTCTTGTGGAGC | 246-301 | 8 | 0.658 | Tail C |
| Bhe33 | (ATAGT)n | GTAGTGGACACTGCGTTGCC TCTCATCTCACATCTCACACACC | 175-205 | 6 | 0.707 | Tail C |
| Bhe35 | (AACTC)n | TTTGCCCAGCTAGCAGCC GACAATGCCTATGGTGAAAAGC | 174-279 | 13 | 0.779 | Tail C |
| Bhe37 | (AGCTG)n | CAGGATGCTTTTGGGAAACG GAGCAATTTCACCCCAAACC | 179-209 | 6 | 0.637 | Tail D |
| Bhe39 | (ATCT)n | CTGAATTGTGTGTGGTCAGGG TGGGTTACAGGGGACACTGC | 194-246 | 9 | 0.787 | Tail D |
| Bhe41 | (ATC)n | AAGTGTGTGTGACAGTTTAGCAGG AGAGGCAGAACTCACCTGGG | 198-237 | 9 | 0.733 | Tail A |
| Bhe44 | (AGT)n | TGAAAGCAGTATTGAAATGAAGGG ACCACCAATAGCACTGCTGC | 136-178 | 13 | 0.765 | Tail A |
| Bhe46 | (ATC)n | AGCAGCAGAATCAAGGGTGG CTAAAATGCCAGCCACATGC | 153-165 | 4 | 0.461 | Tail B |
| Bhe47 | (AAC)n | TCCCAACCTATTGAAAGAAGTAGC AGTGGAAAAGTCCCATTGCC | 195-240 | 12 | 0.817 | Tail B |
| Bhe49 | (AAATT)n | TGAACATTTTCCATGACATTATAGC TTTAAACAAACCAGAAAACCAGC | 176-201 | 6 | 0.699 | Tail B |
Ra: allelic size range; Na: number of alleles per locus; PIC: polymorphic information content; Tail A: GCCTCCCTCGCGCCA; Tail B: GCCTTGCCAGCCCGC; Tail C: CAGGACCAGGCTACCGTG; Tail D: CGGAGAGCCGAGAGGTG (Blacket, Robin, Good, Lee, & Miller, 2012).
TABLE 2 Genetic diversity of 21 microsatellite loci of Brycon henni evaluated in four demes of the Colombian Magdalena-Cauca Basin
| Samples | Bhe05 | Bhe08 | Bhe12 | Bhe16 | Bhe19 | Bhe20 | Bhe24 | Bhe26 | Bhe27 | Bhe30 | Bhe31 | Bhe32 | Bhe33 | Bhe35 | Bhe37 | Bhe39 | Bhe41 | Bhe44 | Bhe46 | Bhe47 | Bhe49 |
| ES | |||||||||||||||||||||
| Na | 7 | 6 | 5 | 6 | 8 | 5 | 2 | 3 | 5 | 8 | 5 | 4 | 4 | 4 | 3 | 7 | 6 | 7 | 4 | 6 | 3 |
| HO | 0.842 | 0.611 | 0.632 | 0.684 | 0.842 | 0.611 | 0.313 | 0.684 | 0.667 | 1.000 | 0.579 | 0.625 | 0.500 | 0.500 | 0.375 | 0.789 | 0.833 | 0.813 | 0.647 | 0.684 | 0.313 |
| HE | 0.834 | 0.663 | 0.589 | 0.686 | 0.809 | 0.735 | 0.272 | 0.579 | 0.783 | 0.798 | 0.680 | 0.712 | 0.544 | 0.544 | 0.671 | 0.762 | 0.687 | 0.808 | 0.611 | 0.657 | 0.365 |
| P | 0.944 | 0.761 | 0.393 | 0.884 | 0.533 | 0.776 | 1.000 | 0.089 | 0.826 | 0.178 | 0.379 | 0.485 | 0.836 | 0.837 | 0.051 | 0.719 | 0.443 | 0.384 | 0.739 | 0.510 | 0.565 |
| IT | |||||||||||||||||||||
| Na | 5 | 7 | 6 | 9 | 7 | 6 | 3 | 4 | 4 | 5 | 6 | 4 | 5 | 6 | 5 | 6 | 5 | 8 | 4 | 7 | 4 |
| HO | 0.818 | 0.705 | 0.341 | 0.682 | 0.750 | 0.636 | 0.268 | 0.773 | 0.386 | 0.773 | 0.698 | 0.375 | 0.452 | 0.452 | 0.125 | 0.810 | 0.767 | 0.732 | 0.595 | 0.795 | 0.634 |
| HE | 0.758 | 0.736 | 0.301 | 0.655 | 0.742 | 0.793 | 0.238 | 0.653 | 0.457 | 0.723 | 0.729 | 0.387 | 0.398 | 0.467 | 0.666 | 0.712 | 0.692 | 0.745 | 0.532 | 0.761 | 0.680 |
| P | 0.830 | 0.576 | 1.000 | 0.338 | 0.532 | 0.176 | 1.000 | 0.024* | 0.199 | 0.107 | 0.777 | 0.328 | 0.252 | 0.003* | 0.000* | 0.063 | 0.365 | 0.634 | 0.407 | 0.410 | 0.146 |
| LM1 | |||||||||||||||||||||
| Na | 3 | 4 | 4 | 5 | 3 | 3 | 3 | 5 | 3 | 6 | 3 | 5 | 3 | 7 | 3 | 2 | 3 | 5 | 3 | 4 | 4 |
| HO | 0.250 | 0.333 | 0.545 | 0.500 | 0.083 | 0.333 | 0.250 | 0.583 | 0.333 | 1.000 | 0.250 | 0.750 | 0.500 | 0.667 | 0.250 | 0.250 | 0.500 | 0.583 | 0.083 | 0.833 | 0.333 |
| HE | 0.467 | 0.540 | 0.558 | 0.435 | 0.236 | 0.301 | 0.409 | 0.598 | 0.301 | 0.768 | 0.475 | 0.721 | 0.409 | 0.768 | 0.366 | 0.344 | 0.453 | 0.580 | 0.359 | 0.688 | 0.308 |
| P | 0.079 | 0.021* | 0.117 | 1.000 | 0.043* | 1.000 | 0.089 | 0.288 | 1.000 | 0.001* | 0.017* | 0.007* | 1.000 | 0.488 | 0.181 | 0.404 | 0.342 | 1.000 | 0.006* | 0.152 | 1.000 |
| LM2 | |||||||||||||||||||||
| Na | 6 | 4 | 7 | 5 | 6 | 5 | 3 | 3 | 4 | 7 | 2 | 4 | 3 | 7 | 4 | 4 | 2 | 5 | 2 | 2 | 4 |
| HO | 0.467 | 0.400 | 0.364 | 0.667 | 0.800 | 0.600 | 0.467 | 0.867 | 0.400 | 0.933 | 0.000 | 0.692 | 0.333 | 0.357 | 0.462 | 0.667 | 0.533 | 0.333 | 0.286 | 0.067 | 0.357 |
| HE | 0.736 | 0.561 | 0.823 | 0.747 | 0.782 | 0.770 | 0.384 | 0.653 | 0.524 | 0.841 | 0.515 | 0.618 | 0.398 | 0.765 | 0.698 | 0.598 | 0.515 | 0.308 | 0.423 | 0.067 | 0.643 |
| P | 0.059 | 0.213 | 0.001* | 0.018* | 0.291 | 0.178 | 1.000 | 0.207 | 0.441 | 0.930 | 0.000* | 0.417 | 0.324 | 0.000* | 0.000* | 0.257 | 1.000 | 1.000 | 0.259 | 1.000 | 0.047* |
Bhe: microsatellite loci; ES: Espíritu Santo River; IT: Ituango River; LM: La Magdalena Stream; LMS1 and LMS2: genetic stocks 1 and 2 of LM; Na: number of alleles per locus; HO and HE: observed and expected heterozygosity, respectively; P: statistical probability for tests of departure from Hardy Weinberg equilibrium. Asterisks (*) denote significant differences (P < 0.05).
Genetic diversity: Compared with IT, the individuals collected in ES exhibited lower average number of alleles per locus and higher values of observed and expected heterozygosity(Table 3). In both cases, the allelic frequencies were concordant with Hardy-Weinberg equilibrium expectations, and the inbreeding coefficients were not significant (Table 3). Additionally, LM displayed the highest number of alleles per locus, a highly significant heterozygosity deficit, and a significant inbreeding coefficient (Table 3). These levels of genetic diversity and inbreeding were higher than those showed by two stocks of LM (LMS1 and LMS2, Table 3) revealed by the genetic structure analysis.
TABLE 3 Genetic diversity of Brycon henni from three sites of the Colombian Magdalena-Cauca Basin
| Site | N | Na | HO | HE | PHWE | FIS | PFIS |
| ES | 19 | 5.143 | 0.645 | 0.638 | 0.372 | -0.048 | 0.894 |
| IT | 44 | 5.524 | 0.598 | 0.604 | 0.773 | -0.009 | 0.645 |
| LM | 27 | 5.619 | 0.461 | 0.662 | 0.000* | 0.303 | < 0.001* |
| LMS1 | 12 | 3.857 | 0.439 | 0.460 | 0.001* | 0.086 | 0.112 |
| LMS2 | 15 | 4.238 | 0.479 | 0.568 | 0.000* | 0.151 | 0.007* |
ES: Espíritu Santo River; IT: Ituango River; LM: La Magdalena Stream; LMS1 and LMS2: stocks 1 and 2 of LM. Na: number of alleles per locus; HO and HE: observed and expected heterozygosity, respectively; FIS: inbreeding coefficient; PHWE andPFIS: statistical probability for tests of departure from Hardy Weinberg equilibrium and inbreeding coefficient, respectively. Asterisks (*) denote significant differences.
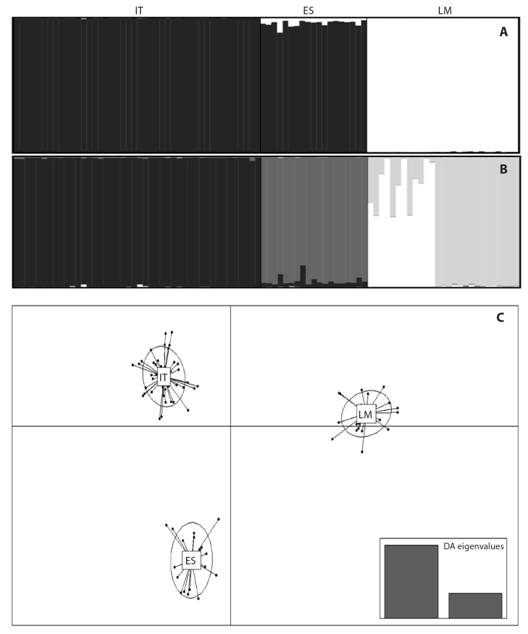
Genetic structure: The most supported number of clusters using the ΔK method was K = 2 [Mean LnP(K) = -5152.045], one predominantly in the Cauca River basin and the other in the La Magdalena Stream (Fig. 2A). However, an additional clustering pattern (K = 4) was examined to compare it with other approaches, showing genetic differences between the IT and ES and within LM (Fig. 2B). Genetic differences among sites were corroborated by discriminant analysis of principal components (Fig. 2C), AMOVA (F’ST (2, 179) = 0.179, P < 0.001), and the pair-wise standardized statistics FST and Jost’s DEST (Table 4).
TABLE 4 Pairwise Jost’s DEST (above diagonal) and F’ST (below diagonal) among samples of Brycon henni from the Magdalena-Cauca Basin, Colombia
| IT | ES | LM | |
| IT | 0.311* | 0.521* | |
| ES | 0.093* | 0.465* | |
| LM | 0.135* | 0.117* |
IT: Ituango River; ES: Espíritu Santo River; LM: La Magdalena Stream. Asterisks (*) denote significant differences (P < 0.001).
Discussion
The relevant results from this study concern the development of a set of 21 polymorphic microsatellite loci for B. henni. The novel species-specific microsatellite loci included perfect motifs of 5mer (7), 4mer (10), and 3mer (4) repeats that exhibited consistent amplification, good band resolution, expected fragment size, high polymorphism levels and satisfied the assumptions of Hardy-Weinberg and Linkage equilibria.
It is expected that shorter motifs (e.g. 2mers) tend to be more variable, but practical matters related with scoring variability in shorter motifs can lead to uncertain motif length, difficulty in interpreting results, and possible allele misclassification (Castoe et al., 2012). Hence, although they might exhibit lower polymorphism levels, the longer repeat motifs were selected in this study to avoid genotyping errors associated with 2mer motifs (Guichoux et al., 2011; Schoebel et al., 2013).
Lack of previous information about B. henni microsatellite loci and the differences in repeat motif lengths with its congeners did not allow us to compare the results of average number of alleles per locus from this work with previous studies of this species’ population genetics (Hurtado-Alarcón et al., 2011; Pineda-Santis et al., 2007) and other Brycon species (Melon-Barroso et al., 2005; Sanches & Galetti Jr., 2012; Viana & Vasconcelos de Macêdo, 2016). However, as discussed below, these novel loci seem able to measure reliable levels of genetic diversity.
Considering the differences in the repeat motif lengths and their probable relationships with differential mutational rates (Castoe et al., 2012; del Giudice et al., 2001), we recommend the use of heterozygosity levels rather than the average number of alleles per locus to compare the genetic diversity of B. henni with available reports of other congeners.
The levels of observed (0.461-0.645) and expected (0.604-0.662) heterozygosities were in the range of average heterozygosity per species across microsatellite loci (HO: 0.189-0.880; HE: 0.486-0.892) found in seven Brycon species (Ashikaga et al., 2015; López, 2006; Matsumoto & Hilsdorf, 2009; Melon-Barroso et al., 2005; Sanches & Galetti Jr., 2012; Sanches et al., 2012) and Neotropical Characiforms (Hilsdorf & Hallerman, 2017). Specifically, the average expected B. henni heterozygosities were higher than those observed in B. orbignyanus (Ashikaga et al., 2015), similar to B. moorei sinuensis (López, 2006) and B. hilarii (Sanches & Galetti Jr., 2012), but lower than B. opalinus (Melon-Barroso et al., 2005), B. insignis (Matsumoto & Hilsdorf, 2009), B. orthotaenia (Sanches et al., 2012), and B. amazonicus (Oliveira, Santos, Bernardino, Hrbek, & Farias, 2018).
However, the average observed B. henni heterozygosities in IT and ES were higher than those found in B. hilarii (Sanches & Galetti Jr., 2012), B. opalinus (Melon-Barroso et al., 2005), B. moorei sinuensis (López, 2006), and B. orbignyanus (Ashikaga et al., 2015), and lower than B. orthotaenia (Sanches et al., 2012) and B. insignis (Matsumoto & Hilsdorf, 2009). In LM, the average observed B. henni heterozygosities were only higher than those found in B. moorei sinuensis (López, 2006) and B. orbignyanus (Ashikaga et al., 2015).
Brycon henni samples of ES and IT showed similar values of expected and observed heterozygosities, concordant with Hardy-Weinberg and Linkage equilibria. Alike findings were also found in B. hilarii from the Peixe and Miranda Rivers in the Paraguay River basin (Sanches & Galetti Jr., 2012). In contrast, samples from LM exhibited a strong and significant heterozygosity deficit. Similar results were reported for B. opalinus (Melon-Barroso et al., 2005), B. moorei sinuensis (López, 2006), B. orthotaenia (Sanches et al., 2012), B. hilarii (Sanches & Galetti Jr., 2012), and B. orbignyanus (Ashikaga et al., 2015).
Brycon henni external fertilization suggests that assortative mating does not explain the results of LM. Instead, the Wahlund effect may explain these results, especially considering the coexistence of two genetic stocks as discussed below. However, other causes like inbreeding may also explain the heterozygosity deficit as values of FIS were significant in total samples (FIS = 0.303, P < 0.001) as well as in one (FIS = 0.151, P = 0.007) of the two genetic stocks of LM.
The novel set of microsatellite loci provides evidence that B. henni populations exhibit a hierarchical genetic structure at the local and regional scales evaluated in this study. A regional genetic structure (Cauca tributaries and La Magdalena Stream) is concordant with results found in other sectors between the Magdalena (Humarada River, La Clara River) and Cauca (Piedras River, Guaracú River) Rivers (Pineda-Santis et al., 2007) and between the Nare and Guatapé Rivers (Hurtado-Alarcón et al., 2011) using dominant markers. This outcome is not surprising because B. henni exhibits a short-distance migration range (< 100 km), and the Cauca tributaries are separated by 600 km from LM. However, the local scales provide new insights about the B. henni population structure. Pairwise comparisons of fixation and genetic differentiation indexes as well as discriminant analysis of principal components revealed genetic differences between ES and IT populations, a finding that is concordant with STRUCTURE analyses that considered K = 4, which also revealed the coexistence of two genetic stocks in LM.
The B. henni genetic differences between the tributaries of the Cauca River separated by less than 30 km, and collected one year before beginning the construction Ituango hydropower station, may be explained by landscape characteristics, including steep topography and drastic changes in water velocities and slopes that may limit gene flow between the sampled localities, as was observed in this area with the Prochilodontidae member Ichthyoelephas longirostris using microsatellite loci (Landínez-García & Márquez, 2016). Alternatively, this outcome may also be explained by B. henni behavioral features such as migration type since previous studies reported B. henni lateral migrations between tributaries and main river channels rather than longitudinal migrations (Builes & Urán, 1974; Lasso et al., 2010), which may explain the limited gene flow along the main river channel. Additionally, this genetic structure may result from homing behavior as has been proposed in B. lundii (Wasko & Galetti Jr., 2002) or high habitat requirements that might influence the distribution and/or reproductive behavior, as occurs in other tropical fish (Arantes, Castello, Cetra, & Schilling, 2013; Guisande et al., 2012; Humphries, King, & Koehn, 1999; Pareja-Carmona et al., 2014).
The coexistence of two genetic stocks in LM provides strong support to the hypothesis that the Wahlund effect explains the significant heterozygosity deficit found at this site. This idea is sustained by further analyses that showed most of loci exhibited allelic frequencies concordant with the Hardy-Weinberg equilibrium in each genetic stock. Lack of genetic information before dam construction in this area did not allow us to identify whether the presence of stocks in LM represents a natural or artificial genetic structure. Similar structuring has been observed in B. hilarii from the Paraguay River Basin (Sanches & Galetti Jr., 2007, Sanches & Galetti Jr.,2012), B. orthotaenia (Sanches et al., 2012), B. insignis (Matsumoto & Hilsdorf, 2009), and B. opalinus from the Paraíba do Soul River Basin (Melon-Barroso et al., 2005), B. lundii in the Sao Francisco River (Brazil) (Wasko & Galetti Jr., 2002), and B. orbignyanus from the upper Paraná River (Panarari-Antunes et al., 2011) and in the La Plata River Basin (Ashikaga et al., 2015). A temporal Wahlund effect is unlikely to explain our findings since B. henni apparently exhibits short, massive spawning, seasonal and cyclic reproduction, in this area (Mancera-Rodríguez, 2017). In contrast, the proposal that B. hilarii spawning schools may use different sites for reproduction and feeding (Sanches& Galetti Jr., 2012), as well as homing behavior proposed in B. lundii (Wasko & Galetti Jr., 2002), suggest that B. henni may exhibit a spatial Wahlund effect, but future studies are required to explore this hypothesis.
It remains to be determined in a larger sample size and number of localities whether B. henni populations are panmictic along their distribution range. This knowledge would be relevant to estimate the species risk categorization, which is currently considered as least concern due to its wide distribution. Based on their migration type, habitat requirements and presence in heterogeneous environments, we propose that B. henni populations conform to genetic patchiness along their distribution. This idea is supported by results published for seven studied congeners (Ashikaga et al., 2015; López, 2006; Matsumoto & Hilsdorf, 2009; Melon-Barroso et al., 2005; Sanches & Galetti Jr., 2012; Sanches et al., 2012; Wasko & Galetti Jr., 2002). Together, these studies suggest that this genetic population structure is a generalized tendency in the Brycon genus, although B. amazonicus (Oliveira et al., 2018) seems to be an exception to this rule.
In conclusion, we reported a new set of 21 polymorphic microsatellite loci that was highly informative and allowed the detection of genetic structure at local and regional scales. Hence, they are strongly recommended for future studies of B. henni diversity and population genetics. Since the Cauca River tributary samples were collected before the construction of the Ituango hydropower station, these results constitute a baseline for monitoring future changes in the genetic diversity and structure of these B. henni populations. In the La Magdalena Stream, this study complements the available information, which is necessary to restructure the management plans for this species.
Ethical statement: authors declare that they all agree with this publication and made significant contributions; that there is no conflict of interest of any kind; and that we followed all pertinent ethical and legal procedures and requirements. All financial sources are fully and clearly stated in the acknowledgements section. A signed document has been filed in the journal archives.

