


 Inglés (pdf)
 Articulo en XML
 Referencias del artículo
 Enviar articulo por email
 Citado por SciELO
  Similares en
SciELO
Similares en
SciELO  uBio
uBio 
 Permalink
Introduction
The biogeographical pattern known as Latitudinal Diversity Gradient (LDG) states an increase in species diversity, mainly of higher organisms, from higher latitudes to the tropics in the equator, it has been considered for centuries as one of the most pervasive phenomena of life on the earth (Mittelbach et al., 2007; Li, Huang, Sukumaran, & Knowles, 2018). Several hypotheses attempt to explain the origin and maintenance of the LDG, especially in association to macro-organisms, which have existed and emerged for millennia. Some historical hypotheses have stated that LDGs is a heritage of geological, climatic and evolutionary process that have occurred for millions of years so that LDGs were originally caused and are currently held by biological responses to the abiotic template, mainly factors related to solar radiation (Flessa, & Jablonski, 1995; Cavender-Bares, Gonzalez-Rodriguez, Pahlich, Koehler, & Deacon, 2011; Bowen, Rocha, Toonen, Karl, & ToBo Laboratory, 2013; Brown, 2014). In contrast, other hypotheses from an ecological perspective explain the occurrence of LDG based on the productivity and the parallel existence of gradient of primary production so that a high productivity in the tropics supports a great number of individuals divided into more species (Wright, 1983; Currie, 1991; Brown, 2014). Also, a second ecological approach, linked to resorts to niche relationships, states that physiological adaptations to different mixtures of abiotic factors and biotic interactions have led species in tropics to be more specialized, apportioning resources more narrowly among more species (Brown, 2014). However, these ecological patterns remain poorly characterized in order to explain the biodiversity of microorganisms in terms of drivers and forces that have ruled the diversity of higher organisms (Andam et al., 2016). In this context, it is logical to ask: is there an increasing trend in biodiversity of microorganisms towards the tropics? Which are the forces and drivers that rule the high biodiversity of microorganism on the earth? Answers to those questions would allow not only to understand ecological and biogeographical patterns of microorganism diversity such those of viruses but also to comprehend the epidemiology and evolution of infectious diseases and their causing agents.
A broad range of vertebrates has continuously been affected by papillomaviruses (PV), which may trigger both benign and malignant proliferations at epithelium level in mucus membrane as well as skin (Humans, 2007). A broadly diversified repertoire of 240 Papillomaviruses has been well studied, characterized and classified in 37 genera (Van Doorslaer, 2013). Traditionally, PV evolution has been considered from strict co-divergence standpoint with host based on congruence between Papillomaviruses and corresponding host phylogenies (Rector et al., 2007). In this context, the infections of PVs are mostly species-specific, and restricted to phylogenetically related vertebrate species so that infections in non-host species are normally abortive. However, many incongruences of strict co-evolution have been shown in phylogenetic analysis that may be attributed to lateral transfer events, recombination, cross-species infection, and duplication on the single host (Gottschling et al., 2011). These incongruences could be justified through two mechanisms: firstly, host transfer of the entire or a section of the viral genome adapted to one host may cause infection, leading to a consistent lineage in the novel host. Secondly, prior divergence the diversification of a common viral lineage into different lineages occurs inside the same ancestral host so that the following speciation of host produces a segregation of PV lineages among consequential host species (Shah, Doorbar, & Goldstein, 2010). Under those circumstances, some authors have proposed a modified evolution theory since the early 1960’s, in which viral evolution fundamentally would pursue the evolution of host resources - expected to be higher at lower latitudes - instead of the host specific evolution (Van Doorslaer, 2013).
The highest diversity of PV belongs to Human papillomaviruses (HPV) with more than 170 different HPV variant types, which primarily affect the mucosal tissues of skin, genitals and upper respiratory tract (Ghittoni, Accardi, Chiocca, & Tommasino, 2015). All HPVs are found in four distinct genera (Alpha, Beta, Gamma, and Mu) scattered throughout the phylogenetic tree, as described previously (Van Doorslaer, 2013). These HPV genotypes have been well established as the etiological agent in benign and malignant lesions such skin verruca, genital warts, laryngeal papilloma, nonmelanoma skin cancer, cervical precancerous and cancerous ones (Ljubojevic & Skerlev, 2014). Although, most of HPV-associated cervical infections are non-malignant, around 5 % of them caused by HPV types, such as HPV16 and HPV18; may lead cervical intraepithelial neoplasia or adenocarcinoma (Mirabello et al., 2017). According to World Health Organization, the number of women diagnosed with cervical cancer were around 485 000, and the number of deaths associated to this cancer was 236 000 worldwide, in 2013 (Murillo, Molano, Martínez, Mejía, & Gamboa, 2009). As such, HPV large diversity must also be considered and analysed in depth from a latitudinal standpoint in order to evaluate any potential association.
The latitudinal diversity gradient has been recognized for more than 200 years. Although several studies have tried to untangle this pattern across many locations and diverse species, the ecological and evolutionary events ruling microbial and viral diversity have been poorly characterized. In this context, our study aims to test the existence of a latitudinal phylogeographic diversity gradient within Papillomaviridae Family through the analysis of the phylogenetic diversity and phytogeography for all known PV species and genotypic variants isolated and molecularly characterized from different locations around world. This may allow us to understand not only the drivers of papillomavirus biodiversity but also the factors responsible for papillomavirus diversification. To our knowledge, no study has considered the latitudinal gradient and/or temperature to understand the high diversity of papillomavirus infections in humans and other vertebrates.
Materials and methods
Papilloma virus databases: The major and minor capsid proteins (L1 and L2, respectively) are well-conserved structures within the PV’s genome, therefore, they are well-suited markers used not only for the identification of novel PV genotypes but also for phylogenetic reconstructions. In this context, a total of 353 nucleotide sequences encoding for the L1 and L2 viral capsid proteins were recovered from Papilloma virus genome database PaVE(https://pave.niaid.nih.gov/).
Subsequently, the screening process of data based on the following criteria: 1- Sequences with identification code (gicode) that allowed direct access to the information of the sequence in GenBank and subsequently to trace back the original publication, and 2- Sequences containing geographical information of the country where the samples were isolated. This latter data was retrieved directly from GenBank NCBI databases or original scientific publications. Our final record and database consisted of 238 gene sequences along with their respective geographical location (Digital Appendix 1).
Heat map based on the geographical locations: In order to understand the distribution of PV biodiversity across different latitudes, we used the web page tool (http://lert.co.nz/map/) to plot a geographical heat map (simulating a density graph), where the greater colour intensity reflects the greater number of papillomaviruses species and genotypic variants per country retrieved from PaVE database. The first map consisted of the 238 papillomaviruses including their corresponding locations.
Phylogenetic analysis: The two sets of gene sequences L1 and L2 were concatenated and then aligned using Geneious version 11.2.1. (Kearse et al., 2012) applying a combination of the alignment methods MAFFT and CLUSTAL IW after translating the DNA sequences into amino acids sequences. Phylogenetic reconstruction was performed with a Markov Chain Monte Carlo (MCMC) Bayesian approach implemented in BEAST version 1.8.4 (Drummond, Suchard, Xie, & Rambaut, 2012). Phylogenetic analysis was carried out using GTR+Gamma+Invariant Sites (Le & Gascuel, 2008) as the best substitution model suggested by testing the final alignment in jModelTest software (Darriba, Taboada, Doallo, & Posada, 2012). A non-parametric Bayesian Skyline coalescent model was used with an exponential strict clock method. MCMC was developed with 80 million of generations, subsampled every 10 000 generations using an Unweighted Pair Group Method with Arithmetic Mean as the starting tree. The TempEst tool was implemented to investigate the temporal signal and clocklikeness of the molecular phylogenies. Evaluation of the performance of the Bayesian analysis was done using the software Tracer v1.7.1 by inspecting the log file generated after executing the BEAST software described above. In short, the different parameters must provide a minimum value of 200 or higher for the effective population size (ESS) in order to accept congruency and to show an acceptable stationary normal distribution of the data. The output of the MCMC analysis was summarized using TreeAnnotator included in the Beast package. Maximum Clade Credibility tree was produced after discarding 10 % of burn-in. The final tree was visualized using free software FigTree version 1.4.4 (Rambaut, 2018).
Statistical analysis: A Principal Coordinate Analysis (PCoA) was carried out to test the similarity of the groups in the phylogenetic tree, based in the presence-absence matrix of viral sequences species and variants. A second PCoA was done to show the similarity of groups based on the host species list. And a third PCoA was based on the country list in that the viruses were found in each group. The analyses were made using the Jaccard similarity index for presence-absence (Powell, 2018).
A series of Mantel tests were used to determine the association of matrix of viral species per cluster with the host matrix, country matrix and the number of samples per group, and aPartial Mantel association test was made in order to evaluate the joint effect of matrix hosts and countries over the viral species matrix per group (Borcard, Gillet, & Legendre, 2011).
Distance-based redundancy analysis (dbRDA) analysis was carried out to generate an ordination plot of the similarity of viral species list per group of the phylogenetic tree vs. host species per group, the country list per group and the number of samples per group. The significance for each model was tested by Analysis of variance (ANOVA) (Borcard et al., 2011; Powell, 2018).
All analyses are based on the presence-absence Jaccard index in the vegan package in R along with capsale function. The difference in the number of samples between groups was based in the Euclidean distance (Borcard et al., 2011).
Results
An intrafamily LDG does not exist: The geographical heat map, which was built up based on the locations of human and non-human infecting 238 PV genotypic variants and species isolated around the world, showed a greater concentration of them at higher latitudes. In Fig. 1, most of the Papillomavirus sequences were agglomerated in the northern regions, with the largest proportion within United States (N = 61). In Europe, Germany and Sweden contained large groups of sequences (N = 28, and N = 19), respectively. Moreover, China, which is nearly at the same latitude that United States, covered the fourth largest (N = 16) group of sequences. On the other hand, near the equator, we identified sequences only from four countries: Colombia (N = 1), Brazil (N = 2), Kenia (N = 1) and Indonesia (N = 9).
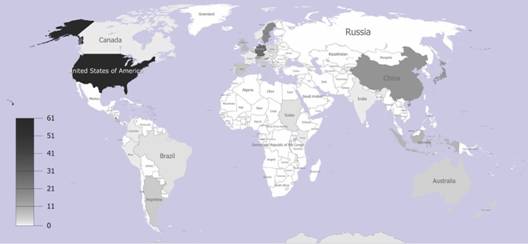
Fig. 1 Geographical heat map of the papillomavirus isolates from different countries. Accumulative densities of papillomavirus isolate historically reported and described per each latitudinal gradient country location.
Phylogenetic analysis based on L1 and L2 gene sequences: Dataset for L1 and L2 gene sequences concatenated resulted in a total of 3 653 bp final alignment for the 238 papillomavirus sequences and was used to reconstruct the unrooted Bayesian tree (Fig. 2). A fixed value equal to one (= 1) was used as the evolutionary rate for this analysis, as such the Effective Sample Size (ESS) value of the posterior sampled from the MCMC was 864 to fully support the final architecture of the tree. This phylogenetic tree of Papillomaviridae Familyis largely consistent with a previous one based on concatenated sequences coding for E1, E2, L1 and L2 (Van Doorslaer, 2013). Our phylogenetic analyses largely support the taxonomic division into major papillomavirus genera (Alpha, Beta, Gamma, Delta, Lambda, Xi, Upsilon and Chi papillomaviruses), as reported in previous studies (Van Doorslaer, 2013). In our phylogenetic tree, however, the papillomavirus species were clustered into non-taxonomic three major groups (called A, B and C for subsequent statistics analysis), with group A being further subdivided into Groups A1, A2, A3 and A4, with the group B being subdivided into Group B1 and Group B2 and with group C being divided into C and C1.a. The sub-cluster A1 includes papillomavirus species taxonomically clustered within the following genera: Gammapapillomavirus, Pipapillomavirus, Betapapillomavirus, Omikronpapillomavirus, Upsilonpapillomavirus, Xipapillomavirus, Dyomupapillomavirus, Treisetapapillomavirus, Dyoxipapillomavirus 1 and Phipapillomavirus. The Sub-cluster A2 incudes papillomavirus clustered with Taupapillomavirus, Dyoomegapapillomavirus, and Dyolambdapapillomavirus genera. The sub-cluster A3 consists of papillomaviruses taxonomically classified within Rhopapillomavirus, Lambdapapillomavirus, Sigmapapillomavirus, Dyotaupapillomavirus, Dyochipapillomavirus, Treisdeltapapillomavirus, Dyopsipapillomavirus, Dyoupsilonpapillomavirus, Kappapapillomavirus, Dyosigmapapillomavirus, and Mupapillomavirus genera. The sub-cluster A4 includes PV species and genotypes within Deltapapillomavirus, Epsilonpapillomavirus and Xipapillomavirus genera. The sub-cluster B1 contains papillomaviruses within Alphapapillomavirus, Dyoomikronpapillomavirus, Dyopipapillomavirus, Dyodeltapapillomavirus, Omegapapillomavirus and Omikronpapillomavirus genera. The sub-cluster B2 includes members within Chipapillomavirus, Iotapapillomavirus, Dyothetapapillomavirus, Dyonupapillomavirus, Dyorhopapillomavirus, Dyoiotapapillomavirus, Psipapillomavirus, and Dyokappapapillomavirus genera. Finally, the subcluster C includes the PV’s previously reported within Treiszetapapillomavirus, Dyoepsilonpapillomavirus, and Treisepsilonpapillomavirus, and the sub-cluster C1.a includes Dyozetapapillomavirus genus. Within the sub-cluster C1.a, Chelonid PV’s appear as the oldest group not only for this cluster but also for all papillomaviruses. Minor inconsistences were, however, found within some of the major taxonomic genera such as alpha, delta, gamma, and xipapillomavirus explained by the Bayesian phylogenetic reconstruction done using a combination of Bayesian and Maximum Likelihood (ML) methods. As such, the taxonomic-phylogenetic clustering of Saimiri sciureus PV1, Saimiri sciureus PV2, Saimiri sciureus PV3, Alouatta guariba PV1, Phocoena phocoena PV, Cervus elaphus PV2 and Bos taurus PV8 is not in accordance as previously reported.
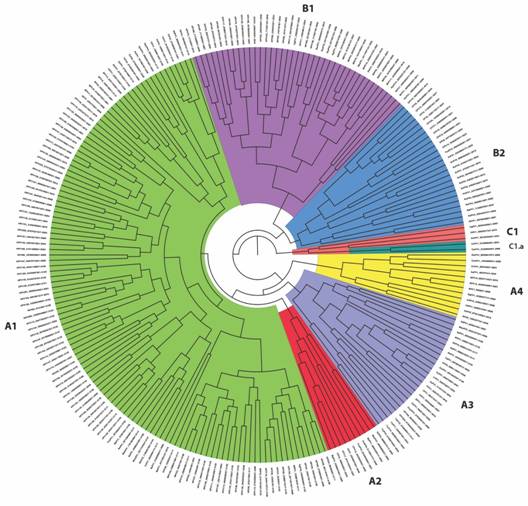
Fig. 2 Bayesian reconstruction of Papillomaviridae family phylogeny based on the concatenated sequences of L1 and L2 genes. The three major non-taxonomic groups (called A, B, and C) are highlighted with group A and Group B further subdivided into A1, A2, A3, and A4, and B1 and B2, respectively.
Statistical analysis: The Principal Coordinate Analysis (PCoA) (Fig. 3)with the groups of samples of the phylogenetic tree based on their viral species, the host, or the country lists produced three different patterns of similarity. The only groups that remain together for the three plots are C1 and C1a, and B1 and A1. The remaining groups vary in similarity. The difference in the number of samples per groups does not explain the similarity of the viral species found Mantel test (Mantel = -0.1958, P = 0.681, permutations = 999).
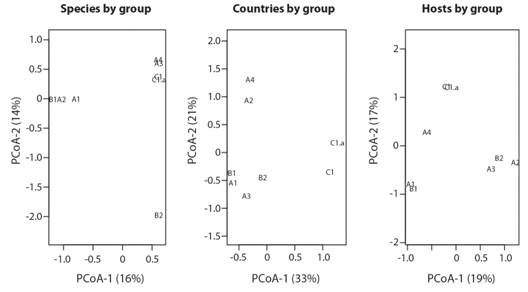
Fig. 3 Principal Coordinate Analysis to show the similarity (Jaccard index) between the groups of the phylogenetic tree based on their viral species list, list of countries of occurrence and host species. The Codes of the groups are explained in the Phylogenetic analysis based on L1 and L2 gene sequences section.
Neither the host matrix nor the country matrix do not explain the viral species matrix per group (Host list: Mantel = 0.1945, P = 0.188, permutations = 999) and (Countries list: Mantel = 0.2899, P = 0.118, permutations = 999). Additionally, no association between the viral species matrix and host matrix controlled by the country matrix in the Partial Mantel were shown (Mantel = 0.0827, P = 0.307, permutations = 999). The Partial Mantelvalue was lower than in the individual Mantel tests by the correlation between host matrix and country matrix (Mantel = 0.4238, P = 0.02, permutations = 999) possibly due to the difference in the geographic distribution of hosts among countries as it is expected.
The dhRDA shows that when the viral species list by group were controlled by the countries list of each group, a better discrimination between groups is achieved than when analysed by host list, while no better discrimination between groups was achieved when analysed by the number of samples in each group (Fig. 4).
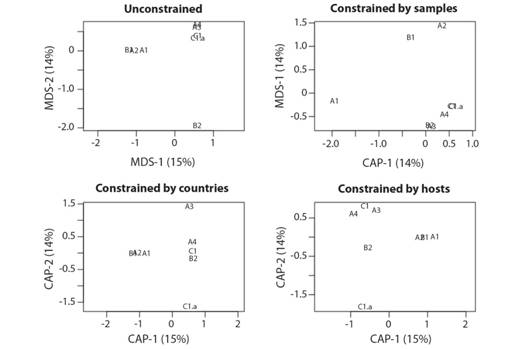
Fig. 4 Distance-based redundancy analysis (dbRDA) of the groups of the phylogenetic tree based on their viral species list (Unconstrained analysis), controlled (Constrained analysis) by the number of samples by group, countries list of occurrences of each group, and list of hosts affected by each group.
The inertia of viral species data in a model without explaining factors (unconstrained) was 3.476, the inertia explained by the number of samples was 0.498 (14 %). Thus, the samples that were not explained resulted in 2.977 (86 %). Contrary with the inertia explained by the countries 2.9757 (85 %) or by host 2.9886 (86 %). However, the analyses of variance (ANOVA) were not significant for these models (Table 1).
TABLE 1 Analysis of variance of each constrained ordination of the Distance-based redundancy analysis (dbRDA)
| dbRDA model | Df | Sum of Sqs | F | Pr(>F) |
| capscale(Papillomacluster ~ Samples, , dist=”jaccard”) | 1 | 0.49803 | 1.0036 | 0.662 |
| Residual | 6 | 2.97748 | ||
| capscale(Papillomacluster ~ countries, , dist=”jaccard”) | 6 | 2.97572 | 0.9923 | 0.588 |
| Residual | 1 | 0.49979 | ||
| capscale(Papillomacluster ~ hosts, , dist=”jaccard”) | 6 | 2.98863 | 1.023 | 0.169 |
| Residual | 1 | 0.48688 |
Show the significance of the effect (with the function capscale in vegan) of number of samples, countries and host list over the similarity of viral species group of the phylogenetic tree.
Discussion
Assessment of latitudinal diversity gradient in Papillomaviridae Family: The LDG is one of the oldest and most ubiquitous ecological patterns concerning life on earth. As such, this pattern manifests the increase in biodiversity from the poles to tropics (Andam et al., 2016). This ecological pattern is considered as pervasive because it happens in almost all environments, at all levels of evolutionary differentiation, and regardless of time domain and biota’s taxonomic affiliation (Willig, Kaufman, & Stevens, 2003). This biogeographical pattern has been associated to Rapoport’s rule, which shows that the extent of latitudinal ranges of species decreases toward the equator compared to higher latitudes (Cardillo, 2002). Species that live at higher latitudes, whose environmental conditions are not relatively stable, have larger extent of area range because they have wider environmental tolerances due to greater environmental seasonal fluctuations. In contrast, species close to Equator have more specific requirement and narrower tolerance, leading to narrower extent of specie ranges, so a coexistence of a larger amount of species is allowed in tropics (Sizling, Storch, & Keil, 2009). There are a considerable number of hypotheses attempting to explain the existence and maintenance of LDG. Many of these hypotheses have focused their arguments on two main phenomena: phylogenetic conservatism and ecological productivity, the key factor defining the LDG is kinetics: the temperature dependence of ecological and evolutionary rates (Brown, 2014). It means that in the tropics, the high temperatures build up and hold high biodiversity and many studies have well documented this ecological phenomenon in many organisms such as birds (Smith, Seeholzer, Harvey, Cuervo, & Brumfield, 2017) and plants (Isacch et al., 2006; Qian & Ricklefs, 2007).
Although researches have studied this pattern greatly in higher organisms, data related to the ecological and evolutionary phenomena driving microbial diversity is limited. In this context, it is assumed that microbial organisms are governed by similar ecological laws ruling the biodiversity of higher organisms (Andam et al., 2016). Some authors have studied this phenomenon at regional scale. For example, Streptomyces biogeography was studied in soils across North America and the results showed that the diversity of those terrestrial bacteria varies with respect to geographical distance and is embodied in a latitudinal diversity gradient (Andam et al., 2016). Moreover, there is evidence showing the existence of a latitudinal gradient of viruses in cases of human viral infections in the different health regions of England and Wales (Hunter & Izsák, 1993). Furthermore, patterns of co-occurrence of influenza type A and B along with the presence of latitudinal gradients in epidemic timing for type A have also been documented (Finkelman et al., 2007). In terms of pathogenic microorganisms, the deep and more comprehensive analyses of biogeographical patterns are necessary in order to understand the epidemiology and evolution of etiological agents causing several human infectious diseases.
The phylogeographic analysis of species belonging to Papillomaviridae family presented in this study shows no support for the geographical pattern of LDG. Our results are coherent with some previous studies where the lack of this ecological pattern has clearly been reported in different groups of macro organisms such as in molluscs (Flessa & Jablonski, 1995), insects (Brener & Ruggiero, 1994), birds (Blackburn & Gaston, 1996) and, mammals (Kaufman, 1995); when studying LDG patterns at smaller geographic or lower taxonomic scales. Some of these remarked exceptions of LDG were mainly related to short latitudinal extents (Willig et al., 2003), species with parasitic life histories such as those belonging to Nearctic Ichneumonidae (Janzen, 1981), and aquatic floras (Santelices & Meneses, 2000).
No support of the geographical pattern of LDG for PV was obtained, which is in agreement with previous reports establishing that such LDG trend is not observable in different microbial communities including polar freshwater DNA viruses (de Cárcer, López-Bueno, Pearce, & Alcamí, 2015), marine DNA viruses (Gregory et al., 2019), Artic soil bacteria (Chu et al., 2010), and marine bacterial communities (Ghiglione et al., 2012). Factors including geographic area, ecological and evolutionary time, solar energy, productivity and climate stability have been considered as the main forces driving and maintaining LDG across multiple taxa. However, viruses are historically well-characterized as strictly dependent on their hosts, and they display parasite-like traits including host specificity, a size smaller than their host, a high degree of specialization, and a reproduction more rapidly and in larger numbers than their hosts (Mindell, Rest, & Villarreal, 2004; Bamford, Grimes, & Stuart, 2005). In this context, their diversity may be influenced not only by external environmental conditions but also by the internal environment of the host (Preisser, 2019). As diversity in many different parasitic pathogens in which LDG pattern is not observed, PV diversity may be influenced by host-associated factors including host range size, population density or size, diet and body mass (Poulin, 2014) as well as the immunity and genetic background. The association between geography and viral evolution may be beyond host phylogeny, effects of temperature on host metabolism or variations in selective pressures, and so, it may be the result of seasonality in host activity and virus transmission associated with climate (Streicker, Lemey, Velasco-Villa, & Rupprecht, 2012).
On the other hand, our results may only be the product of a socio-economical-scientific artefact (a phenomenon seen empirically but that does not naturally occur). There is large bias of scientific research associated to large differences of health-care and economic conditions along with the geographical factors. Historically, USA and Europe have produced more genetic data on PV sequences. Most of these efforts in virology detection and identification have been historically done in developed countries with better-distributed resources for medical and research purposes. However, as the global tendencies are showing, it is highly probable that China (Tollefson, 2018) would produce larger amount of sequences in the future years, as this country is currently leading the new reports and submissions of new PV DNA sequences at international databases.
Furthermore, two more geographical heat maps were considered for human infecting species and non-human vertebrate infecting species. We built up these two heat maps based on their corresponding locations so that it allows avoiding that the bias caused by the large concentration of human papillomaviruses compared to non-human papillomaviruses could affect our results regarding to no support of LDG pattern. These heat maps show the same phenomenon with no greater diversity towards tropics compared to higher latitudes, but a large concentration of papillomaviruses can be seen in the northern higher latitudes, specifically in United States of America and other European countries (Fig. 1).
Phylogeny of Papillomaviridae family: Almost all known papillomaviruses encode for at least five proteins such as E1, E2, E4, L1 and L2. While E1 and E2 are modulators in the replication and transcription (Van Doorslaer, 2013), respectively, the role of L1 and L2 includes the assemblage of the viral capsid, so that these proteins are relevant during the host infectious process (Day, Roden, Lowy, & Schiller, 1998). L2 protein facilitates the encapsulation of the circular genome during building of the non-enveloped viral particles in the nucleus of epithelial cells (Wang & Roden, 2013). Also, in Cervical Cancer-related Viruses, E5, E6, and E7 genes encode for oncogenic proteins are involved in altering the cellular growth (Yim & Park, 2005). Biopsies of cervical cancerous cells have shown the expression of certain viral genes such as E6 and E7, and E5 has been related to proliferation enhancement and prevention cancer cells from apoptosis (Tomaić, 2016).
Our phylogenetic analysis was based on the concatenated nucleotide sequence of L1 and L2 viral proteins. These two codifying regions are involved into the assemblage of the viral capsid so that these proteins are relevant during the host infectious process. Our tree supports the fact that phylogeny of Papillomaviridae can be explained by an initial divergence of papillomavirus lineages related to the ancestral host and then subsequent virus-host linked speciation, which have resulted in an extant range of host species associated to the known pattern of high diversity of PVs.
Our tree largely supports the taxonomic division into major papillomavirus genera (Alpha, Beta, Gamma, Delta, Lambda, Xi, Upsilon and Chi papilloma viruses), as reported previously (Van Doorslaer, 2013). Based on the taxonomic classification provided by PaVE database and previous studies, our phylogenetic tree showed minor inconsistences within some of the major taxonomic genera such as alpha, delta, gamma, and xipapillomavirus. The phylogeny described by us shows the following papillomavirus species: SscPV1 (Saimiri sciureus papillomavirus 1), SscPV2 (Saimiri sciureus papillomavirus 2), SscPV3 (Saimiri sciureus papillomavirus 3), AgPV1 (Alouatta guariba Papillomavirus 1), and PhPV1 (Phocoena phocoena papillomavirus 1) clustered within the Alpha-papillomavirus genus, however, according to PaVE database, SscPV1, SscPV2, SscPV3, AgPV1 and PhPV1 are clustered into Dyoomikronpapillomavirus genus. Furthermore, our tree shows CePV2 (Cervus elaphus Papillomavirus 2) and BPV8 (Bos taurus Papillomavirus 8) within the Deltapapillomavirus genus and this contradicts their respective taxonomic classification as Xipapillomavirus and Epsilonpapillomavirus according to PaVE database. It is worth mentioning that the mentioned inconsistences cannot be compared to previous studies because their phylogenies did not consider those sequences for constructing the Papillomaviridae family phylogeny (Bernard et al., 2010; Bravo & Alonso, 2007; de Villiers, Fauquet, Broker, Bernard, & Zur Hausen, 2004; Van Doorslaer, 2013). Moreover, some inconsistencies are found in Gammapapillomavirus genus. In our phylogenetic tree, the species described in previous studies within Gammapapillomavirus genus are subclustered into two subgroups clearly defined, and one of this sub clusters is more closely related to branch including Pipapillomaviruses than to the other set of Gammapailloma virus (Bravo& Alonso, 2007; Van Doorslaer, 2013). As final feature, the Chelonid PV’s, clustering the Caretta caretta Papillomavirus 1 and the Chelonia mydas Papillomavirus 1, appear as the oldest group not only for the cluster C1 but also for all papillomaviruses. This has an evolutionary logic as chelonidos and testudines are some of the oldest representatives for vertebrates, and thus this rooting position in the phylogenetic tree supports a long co-evolutionary process.
Ethical statement: authors declare that they all agree with this publication and made significant contributions; that there is no conflict of interest of any kind; and that we followed all pertinent ethical and legal procedures and requirements. All financial sources are fully and clearly stated in the acknowledgements section. A signed document has been filed in the journal archives.

