


 Inglês (pdf)
 Artigo em XML
 Referências do artigo
 Enviar este artigo por email
 Citado por SciELO
  Similares em
SciELO
Similares em
SciELO  uBio
uBio 
 Permalink
Introduction
The false killer whale (Pseudorca crassidens) is a tropical and subtropical species, which is found primarily in deep water and offshore habitats. Nevertheless, nearshore distribution has been documented around tropical oceanic islands (Stacey & Baird, 1991; Acevedo-Gutierrez, Brennan, Rodriguez, & Thomas, 1997; Odell & McClune, 1999; Baird, 2008). False killer whales are a social species that live in groups with individuals of mixed ages and sex classes (Stacey& Baird, 1991). They have been documented to hunt cooperatively, as evidenced by visual observations (Baird, 2018) and the analysis of bone collagen through stable isotopes, which has shown no resource partitioning between adult females and males, supporting cooperative foraging theory (Ortega-Ortiz, Elorriaga-Verplacken, Olivos-Ortiz, Liñan-Cabello, & Vargas-Bravo, 2014; Riccialdelli & Goodall, 2015). False killer whales have also been reported in mixed species aggregation, notably with bottlenose dolphins (Zaeschmar, Dwyer, & Stocking 2013). Sociability in false killer whales is thought to align with many characteristics of the Globicephalinae sub-family, such as the occurrence of long-term association (Baird et al., 2008) and natal philopatry (Connor, 2000).
False killer whales are naturally uncommon throughout their range. In nearshore locations where populations have been evaluated using capture-mark-recapture (CMR) analyses, low abundance, usually low hundreds of individuals have been documented (Bradford et al., 2018; Zaeschmar, 2014). False killer whales in the Eastern Tropical Pacific (ETP) have largely been studied in the open ocean (Wade & Gerrodette, 1993). However, recent efforts have focused on assessing the populations in coastal waters of the ETP (Martínez-Fernández, Montero-Cordero, May.Collado, & Calambokidis, 2005; Martínez-Fernández, Montero-Cordero, & May.Collado, 2007; Douglas, Garita-Alpizar, Acevedo-Gutierrez, Baird, & Calambokidis, 2011; Ortega Ortiz et al., 2014). In Southwestern Costa Rica, the species have been documented since the late 1990’s (Acevedo-Gutierrez et al., 1997).
They described the occurrence of false killer whales by a few encounters in Golfo Dulce, highlighting the recapture of two individuals and the potential for long-term associations. Observations made in the Golfo Dulce by Acevedo-Gutierrez et al., (1997) were integrated in a more extensive account of false killer whale sightings in Isla del Coco, an oceanic volcanic island 500 km Southwest from mainland Costa Rica. These observations emphasize the repeated re-sighting of associated individuals, suggesting a small population size and long-term association.
The objective of this study is to assess the abundance of false killer whales in Golfo Dulce and Osa Peninsula Waters, Southwestern Costa Rica, examining the capture histories of photographically identified individuals, to produce survival and abundance estimates derived from capture-mark-recapture (CMR) analyses. This study provides basic information for the management and conservation of a near threatened (Baird, 2018) marine predator in Costa Rica’s territorial waters.
Material and methods
Study Area:This study was focused in the southwestern Pacific of Costa Rica. Below is a detail description of each subarea where false killer whale sighting records were collected:
Osa Peninsula Waters (OPW): This study area was limited east by the shorelines of Térraba-Sierpe River System, Drake Bay and Corcovado National Park to Punta Salsipuedes, continuing south following the meridian 83° 35’ W. The Northern and Southern limits were represented by the parallels 08°55’ N & 8°12’ N respectively, while the Western-most limit of the study area was located at 84°00’ W. The total size is an approximated area of 4 500 km2. According to the description of the ETP in Lizano (2008), the main environmental trend in this whole area is the relative stability in terms of sea surface temperature year round. Additionally, Coco’s ridge might induce such stability by acting as a barrier influencing the hydrography of the oceanic environment, as suggested by Fernandez & Oviedo (2009). This area is the target location of whale-watching boats (the platform of observation) and is mainly characterized by a greater portion of shelf waters, which progressively shrinks southward along the western coast of the Peninsula, just outside of Golfo Dulce’s entrance. The water depth reaches 1 000 m to less than 4 nm from Cabo Matapalo. Within the shelf waters, the most remarkable topographic unit is Isla del Caño (Fig. 1).
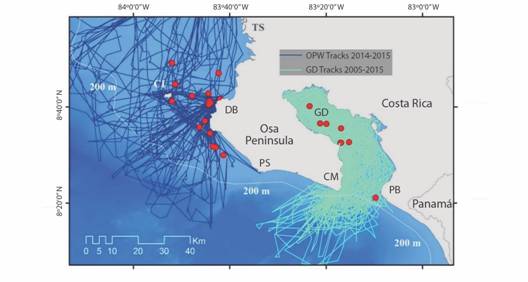
Fig. 1 The distribution of sightings of false killer whales and survey track coverage in OPW and GD. CI: Caño Island, TS: Térraba-Sierpe, DB: Drake Bay, PS: Punta Salsipuedes, CM: Cabo Matapalo, GD: Golfo Dulce, PB: Punta Banco.
Golfo Dulce (GD): This gulf is a fjord-like embayment that is connected to the ETP through a 14 km-wide opening with a sill at 60 m depth. The main hydrographic characteristic of this 50 km long inner sea is the anoxic, nitrate-rich water in the bottom depths of the inner basin (Thamdrup, Canfield, Ferdelman, Glud, & Gundersen, 1996; Dalsgaard, Canfield, Petersen, Thamdrup, & Acuña-Gonzalez, 2003; Dalsgaard, Thamdrup, & Canfield, 2005; Ferdelman et al., 2006). We included a third sub-area: the transitional-oceanic area at the mouth of GD, as described in Oviedo, Pacheco-Polanco and Herra-Miranda (2009) and Oviedo et al., (2015). Essentially this sub-area is characterized by oceanic water close to the coastline, due to the drastic reduction of the shelf-width at the mouth of the Gulf (Fig. 1).
Data Collection: Cetacean encounter data off of the Osa Peninsula and Golfo Dulce have provided the basis to study the abundance of false killer whales. Opportunistic sightings associated with whale watching operators off of Drake Bay and Isla del Caño were added to observations of the species during formal surveys in Golfo Dulce.
Cetacean surveys in OPW (2001-2007, 2014-2019) and in GD (2005-2015) were conducted from a 7 m long fiberglass vessel with a 115 hp outboard engine. In GD, observation and photo-identification data have been gathered within the inner-basin, sill area and the transitional-oceanic portion at the mouth of the gulf. Observation data included basic information on the time and location of sightings, plus best group size and composition estimates (adults, juveniles, calves and total). Behavior at first encounter was also recorded based on an ethogram describing five behavioral states (Forage, Travel, Social, Rest, Mill) as in Oviedo (2007) and Herra-Miranda, Pacheco-Polanco, Oviedo and Iñiguez (2016). In OPW, the majority of observation and photographic records have been collected opportunistically, except for those associated with documented search efforts since 2014.
While in the presence of a group of false killer whales and engaging in a group-follow protocol (Mann, 2000), photo-identification (photo-ID) efforts focused on obtaining pictures of the dorsal fins, as perpendicular to the body axis as possible, of as many individuals as possible, irrespective of the degree of natural marking (nicks, notches, scratches on the leading/trailing edges of the dorsal fin). Photographic group coverage was intended to include all member of a group, in order to provide an equal capture probability of individuals. Photos were taken with a digital SLR camera (Canon 7D/70D) with a 400 mm telephoto lens (1:4.5-5.6). High quality digital images were stored and later selected and classified to be added to a species-specific photo-ID catalogue.
Data Analysis: Individual photographs were selected and classified based on quality and distinctiveness. This was done in order to build-up a catalogue of identified individuals, compiled by year. Processing of all photographs collected in the field was achieved using the photo-identification data-management system software “DISCOVERY” (Gailey & Karczmarski, 2012). The quality criterion for classification and selection of photographs was established with a scale from 1 to 100 as in Chan & Karczmarki (2017). Only photographs of a quality ≥ 70 were included in the data set for further analysis, which guaranteed that selected photographs were well exposed, in focus, and the area of the dorsal fin occupied no less than a quarter of the frame in the photograph, without parallax or only with a moderate case of it (Karczmarski, Würsig, Gailey, Larson, & Vanderclip, 2005). Distinctiveness of individual marks has been shown to be crucial to individual recognition (Friday, Smith, Stevick, & Allen, 2000; Gowans & Whitehead, 2001). High quality photographs of the dorsal fins were classified by distinctiveness rating, on a scale from 0 to 5 (0 being an image of a smooth dorsal fin with no apparent markings and 5 a very distinctive dorsal fin with nicks, notches and deformities). Individual identification is based on the occurrence of nicks and notches and their distribution along the profile of the dorsal fin. Only photographs of dorsal fins with sufficiently distinctive marks (distinctiveness > 1), which can be seen on other high quality images, were considered for analysis.
The history of encounters of each identified individual was organized in a presence-absence matrix, used for the estimation of abundance through CMR analysis. The capture occasions in GD and those from 2014 onwards in OPW, have an associated search effort that have been documented systematically. The latter is important to guarantee equal “catchability” (the equal probability that every individual and group would have to be encountered and photographically captured). The CMR approach used to estimate population size has specific assumptions regarding the nature of the studied population and the type of sampling (Cantor, Wedekin, Daura-Jorge, Rossi-Santos, & Simões-Lopes, 2012). Meeting those assumptions is a requirement to avoid biased estimates. We argued that the inherent reproductive and social ecology of false killer whales would support a low rate of immigration and emigration. For instance, analysis of stranded individuals has shown that false killer whales might have a lower pregnancy rate than other globicephalines (Ferreira, Kasuya, Marsh, & Best, 2014), added to a calving interval of ≈ 7 years (Kasuya, 1986; Baird, 2008) and very low adult mortality rate. However, the temporal distribution of the capture occasions in this assessment, where sampling occasions are spaced by longer time periods, prevented the assumption of population’s closure to permanent emigration and immigration (Pine, Pollock, Hightower, Kwak, & Rice, 2003). Correspondingly, based on the lack of a defined asymptote in discovery curve (Fig. 2), we modeled the population size and demographic parameters of non-calves individuals of false killer whales using the open-population POPAN parameterization. Considering the effect of time in all the corresponding parameters: capture probability (P) and apparent survival (ф) as in Reisinger and Karczmarski (2010). This initial time effect model was tested for the violation of equal capture probability and survival through the goodness of fit (GOF) TEST 2 and TEST 3 in the package RELEASE, within RMark. Abundance analyses were all performed using RMark v 2.1.14 (Laake, 2013) a program R interface to the software Mark (Cooch & White, 2007). Model selection followed the Akaike Information Criterion (AIC: Burnham & Anderson, 1998).
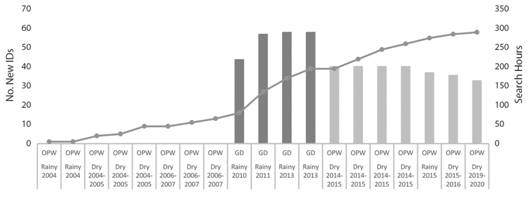
Fig. 2 The discovery curve of P. crassidens in this assessment (cumulative numbers of new photo-IDs= line), contrasted by search effort (search hours= bars), including GD (dark gray bars) and OPW (light gray bars).
Estimating total population size:CMR estimates relate only to the number of distinctive individuals in the population. In order to get a total population size, mark-recapture estimates need to be scaled considering the proportion of distinctive individuals. Dorsal fins were photographed at random, avoiding bias towards marked animals; therefore, distinctive vs. non-distinctive individuals would have the same capture probability. It is therefore expected that the ratio of marked to unmarked fins in each focal group provides an unbiased estimate of the proportion distinctive  :
:

with the variance express as
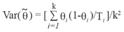
Where:
Ii is the number of photographs of distinctive individuals in group i,
Ti the total number of photographs (including distinctive and non-distinctive individuals) in group i,
k is the number of groups photographically captured.
Each mark recapture estimate of the number of marked individuals ( ) will be scaled up by the matching mark rate ( ) of the population to obtain a total population size (Wilson, Hammond & Thompson, 1999), considering the proportion of non-calves (µ) as in Stensland, Carlen, Särnblad, Bignert & Berggren(2006), such proportion is derived from the best estimates in the field collected sighting data:

The corresponding 95 % confidence intervals were estimated after Zanardo, Parra and Möller (2016).
Results
The Abundance of False Killer Whales: Overall 5 244 pictures have been processed - analyzed to identify and catalogue 43 non-calf individuals. The best fitted model selected through the AIC is displayed in Table 1, along with the rest of the models analyzed. This superpopulation estimate is for the wider study area in OPW, including all of the efforts associated capture occasions in GD, as well as opportunistic collection of photographic capture-recapture. Except for the captured data in GD, the opportunistic data set had no reliable estimation of proportions of non-calves and non-marked individuals. Hence, those aspects were adopted from the capture occasions in GD to obtain the adjusted total population size. At OPW the time effect on capture probability model, with all other parameters constant, was selected as best fit (abundance of marked individuals = 55.65; SE = 1.6; ф ≈ 0.99; P = 0.073, CI= 0.029-0.17). Considering demographic openness to immigration and emigration, the total population size of false killer whales at OPW is ca. 92 individuals (95 % CI: 89-95) as shown in Table 2. It is important to highlight that TEST2 + TEST3 in the GOF were not significant, indicating no violation of equal capture probability and survival.
TABLE 1 POPAN parameterization in program R-MARK: models selection for false killer whales in OPW. Best-fitted model selected in bold
| Model Selection Criteria for False Killer Whale OPW | |||||
| Model | QAICc | ΔQAICc | QAICc-weight | NP | QDEV |
| Φ. Pt b. | 719.01 | 0.00 | 1.00 | 21 | 121.18 |
| Φ. P. bt | 756.77 | 37.75 | 0.00 | 20 | 163.21 |
| Φ. P. b. | 768.82 | 49.80 | 0.00 | 4 | 224.88 |
| Φ. Pt bt | 796.68 | 77.67 | 0.00 | 37 | 90.42 |
| Φt P. b. | 800.35 | 81.34 | 0.00 | 20 | 206.80 |
| Φt Pt b. | 827.44 | 108.43 | 0.00 | 37 | 121.18 |
| Φt P. bt | 841.92 | 122.91 | 0.00 | 36 | 145.83 |
| Φt Pt bt | 1072.03 | 453.01 | 0.00 | 56 | 90.42 |
QAICc = quasi-adjusted akaike information criteria; ΔQAICc = delta quasi-adjusted akaike information criteria; QAICc-weight= weighted quasi-adjusted akaike information criteria; NP = number of parameters; and QDEV = quasi-deviance.
TABLE 2 POPAN parameterization in program R-MARK: super-population estimate for false killer whales in OPW. Best-estimate selected in bold
| Total Population Size for False Killer Whale OPW | ||||
| N total | µ | SE | 95 % CI | |
| 91.95 | 0.68 | 0.89 | 2.77 | 89.22-94.76 |
| 90.09 | 0.68 | 0.89 | 4.52 | 85.68-94.72 |
| 104.31 | 0.68 | 0.89 | 4.98 | 99.45-109.41 |
| 87.95 | 0.68 | 0.89 | 3.37 | 84.65-91.38 |
| 114.77 | 0.68 | 0.89 | 5.86 | 109.06-120.78 |
| 83.69 | 0.68 | 0.89 | 2.75 | 80.99-86.49 |
| 95.44 | 0.68 | 0.89 | 4.93 | 90.63-100.50 |
| 87.95 | 0.68 | 0.89 | 3.37 | 84.65-91.38 |
N total= adjusted total population size; SE= Standard Error; 95 % CI = 95 % confidence interval; = proportion of marked individuals in the studied population and µ = proportion of non-calves in the population.
Discussion
The pattern of abundance of false killer whales in the study area correspond with that of a top predator which frequently venture into shallow, close to coast shelf waters, presumably in the search for prey. Such pattern of abundance and habitat use would be described primarily by an extensive home range with localized core areas of aggregation, where foraging might predominate. In general, 92 (CI: 89-95) individual false killer whales are using the OPW during the entire period (2001-2019). This super-population estimate should be taken as conservative and consider that it could not reflect loses over time (Bradford et al., 2018). We acknowledge that the rarity of P. crassidens in the study area was amplified by the heterogeneous level of search effort, which affects the limited number of individual recaptures at any given year. We have addressed some violations of assumptions and biases derived from the partial sampling of the study area, but as indicated in Bradford et al., (2018) it would not be possible to assess the level of underestimation of the true abundance of distinctive non-calf individual of false killer whales each year.
Such small population size of false killer whales in the whole study area has been hinted before by previous research assessments. Acevedo-Gutierrez et al., (1997) recorded 2 sightings in GD in less than 24 months, Martínez-Fernández et al., (2005) reported 4 encounters in less than 6 months and posteriorly 18 encounters in 18 months (Martinez-Fernández et al., 2007) off Isla del Caño and Drake Bay at OPW. However, Douglas et al., (2011) reported 96 individuals identified within a catalogue for Southern Costa Rica (OPW), which is close to estimates in this assessment.
Even though the species is widespread worldwide, the abundance remains very low. Except for Wade & Gerrodette (1993), who estimated over two decades ago the abundance of P. crassidens for the ETP at 39 800, with very high variability (CV = 64 %). Elsewhere in the wider Pacific Ocean, the population size estimate for insular Hawaiian false killer whales (Baird et al., 2005; Baird et al., 2008, Bradford et al., 2018) through mark capture-recapture analysis is similarly low as the quantities reported in here; these authors have produced a population size estimate of less than 200 individuals. Likewise, in a similar study comprising several locations over 300 km in Northeastern New Zealand (Zaeschmar, 2014), a super-population estimate was calculated at 111 individuals (CI 95 % : 101.17-123.34).
The CMR (POPAN) analysis used in this assessment allows for the estimation of other key demographic parameters such as the capture probability and demographic survival. The low capture probability in the results might reflect those individuals that never used the OPW during the sampling periods. Bradford et al., (2018) argue that there could be a portion of the population unavailable, due to a pattern of occurrence concentrated in areas that could be either difficult to survey, or as in the case of this assessment off the target area for whale-watching, a major source of photo-ID data in this study. The apparent survival of P. crassidens in OPW would concord with the biological survival of the species (0.99, from Taylor, Chivers, Larese, & Perrin, 2007). Apparent (demographic) survival is different to biological survival, since the former is affected by the level of recaptures (Brooks, Palmer, Griffiths, & Pollock, 2017). Even though the apparent survival contrasts with the low capture probability, such high survival estimate could be explained by the lack of major predatory pressure on false killer whales, the only know natural enemy predating on the species would be killer whales (Visser et al., 2010). According to our sighting records, orcas would have an even rarer pattern of occurrence in OPW. This low predation risk would support an important probability of being available for capture.
The present abundance estimate of OPW false killer whales is affected by the sparse nature of the sighting data, as well as, the sampling biases. The scale of this estimate (less than 100 individuals) should be carefully considered as vulnerable in the face of the increasing occurrence of anthropogenic effects in the coastal/inshore seascape in OPW and all around the Nicoya Ecoregion. As in the population of P. crassidens off the Hawaii islands, notably differentiated in three clusters, we hypothesize that this population unit might have a similar structure along the coastal portion of the ETP. Photo ID analysis indicated the concurrent recapture of individuals from the OPW catalogue off Panama (LO data). Whereas a preliminary comparison with documented cases in Nicaragua has not yield any resighting of identified individuals (Pouplard et al., 2019), although a more in depth comparison is currently in progress. Based on the latter, we argue the potential occurrence of coastal population unit and oceanic island associated stock, as the one documented by Acevedo et al., (1997) off Isla del Coco. The appropriate treatment to correct data limitations (bias and uncertainty), facilitates wildlife scientists and managers with a baseline to support planning for conservation and management. The present abundance estimate would be a key step in determining the stock identity of false killer whale in the Pacific waters of the Tropical and Sub-tropical Americas.

