


 English (pdf)
 Article in xml format
 Article references
 Send this article by e-mail
 Cited by SciELO
  Similars in
SciELO
Similars in
SciELO  uBio
uBio 
 Permalink
Introduction
A choice facing many land managers in the tropics is whether to reforest agricultural land by planting trees or by allowing natural secondary forest to grow. New international efforts to restore tropical forests and to sequester carbon are likely to lead to large areas of new tree plantations and secondary forests in the coming years (Laestadius et al., 2011; Alexander et al., 2011). Decisions about the method of reforestation should consider the conservation value of these two types of forests. Tree plantations used for carbon sequestration and forest restoration under light management regimes can support diverse plant communities (Brockerhoff, Jactel, Parrotta, Quine, & Sayer, 2008). However, we know very little about the successional pathway of tree plantations in comparison to the successional pathway of secondary forests. This is important because the successional trajectory of a regenerating forest determines how long it takes to recover native forest communities (Chazdon et al., 2007) and ecosystem functions, which depend on biodiversity (Thompson et al., 2014).
Successional pathways in tropical forests are influenced by both deterministic processes and site history. Turnover of species composition is often predictable based on regeneration guilds, with shade-intolerant pioneers giving way to shade-tolerant mature forest species (Guariguata & Ostertag, 2001; Norden, Chazdon, Chao, Jiang, & Vílchez‐Alvarado, 2009; Lebrija-Trejos, Meave, Poorter, Pérez-García, & Bongers, 2010). In neotropical secondary succession, shifts in growth form are also observed, with shrubs and lianas declining in abundance and palms and canopy trees increasing (Laska, 1997; Capers, Chazdon, Brenes, & Alvarado, 2005). On the other hand, rate of change in abundance, diversity and composition of plants are often highly variable from site to site (Norden et al., 2015). Unpredictability of successional trajectories may arise from unmeasured differences in abiotic conditions or stochasticity in dispersal and establishment. Various historical events and abiotic factors have been shown to impact successional trajectory, including intensity of previous land use (Mesquita, Ickes, Ganade, & Williamson, 2001; Jakovac, Peña‐Claros, Kuyper, & Bongers, 2015), soil type (Finegan & Delgado, 2000), proximity to seed sources (Goosem et al., 2016), species composition of nearby seed sources (Janzen, 1988), dispersal limitation (Hubbell et al., 1999), and amount of remnant vegetation (Schlawin & Zahawi, 2008).
Although successional pathways in secondary forests have been studied extensively in long-term plots (Chazdon et al., 2007; Poorter et al., 2016), investigations of successional dynamics in tree plantations are rare. Research over the past two decades has shown that, in some cases, tree plantations can enhance the initial establishment of woody plants compared to control sites (Parrotta, 1995; Guariguata, Rheingans, & Montagnini, 1995; Powers, Haggar, & Fisher, 1997; Zahawi, Holl, Cole, & Reid, 2013) and alter initial species composition of woody plants (Butler, Montagnini, & Arroyo, 2008; Holl, Reid, Chaves-Fallas, Oviedo-Brenes, & Zahawi, 2017). However, very few studies have evaluated shifts in abundance, diversity and species composition over time in tree plantations. It is unknown if shifts in regeneration guilds and life forms follow patterns similar to secondary forests. If tree plantations affect initial species composition of woody plants species, composition may remain different in these two forest types for extended periods. For instance, many tropical pioneer species live for several decades (Finegan, 1996) and species from different stages of succession establish early following disturbance (Uhl, Buschbacher, & Serrao, 1988; van Breugel, Bongers, & Martínez‐Ramos, 2007).
Whereas structural characteristics of forest sites tend to converge during succession (Williamson, Bentos, Longworth, & Mesquita, 2014), species richness and species composition often become less similar among different sites (Vandermeer et al., 2004; Myster & Malahy, 2008; Longworth et al., 2014). Our hypothesis is that turnover of species composition is slower in tree plantations than in secondary forests due to differences between planted trees and dominant secondary forest trees. We are inclined to think this occurs because commonly planted native trees in our region of study (Piotto, Montagnini, Ugalde, & Kanninen, 2003) are categorized as long-lived pioneer species (sensu Finegan, 1996) and live for more than 40 years, whereas trees that dominate the canopy in young secondary forests have shorter lifespans (SIREFOR, 2010). Also, higher mortality of trees in secondary forests than tree plantations could drive a more rapid change in species composition (van Breugel et al., 2007). In this study, we evaluated changes in woody vegetation in secondary forests (abandoned cattle pastures) and monoculture tree plantations over a three-year period at sites ranging from 8 to 23 years old. Previous research at these sites had shown that species composition of natural regeneration differed between these two forest types (Longworth & Williamson, 2018). With this investigation, we incorporated a second survey to evaluate changes over time in the following characteristics: stem density, basal area, species richness, and species composition. We also examined changes in relative abundance of different growth forms, regeneration guilds and species.
We had two primary questions in this study: first, does the rate and direction of change in characteristics of woody vegetation differ between forest types? We predicted that change in species composition would be greater in secondary forests than in tree plantations. Secondly, do characteristics of woody vegetation in tree plantations become more similar to secondary forests over time? We predicted that the two forest types would become more similar to each other for characteristics that were changing rapidly during our study. We also made general predictions based on previous findings of other researchers. For both forest types, we expected stem density, basal area and species richness to increase between censuses where three years is adequate to observe changes. Also, in both forest types, we expected relative abundance of understory species and short-lived pioneers to decline, and relative abundance of canopy trees, long-lived pioneers and shade-tolerant species to increase.
Materials and methods
Study location: The study was carried out at Universidad Earth, Pocora, Limón Province in north-east Costa Rica (10°10’40” - 10°14’46” N & 83°36’33” - 83°34’2” W; 30-100 m.a.s.l.). The natural vegetation is categorized as tropical moist forest. Average annual temperature and precipitation are 26 °C and 3 500 mm respectively. The university's campus contains a 605 ha forest reserve of selectively logged primary forest, tree plantations, secondary forest, and various agricultural uses, primarily pastures and banana plantations. Study sites were on land cleared of forest and used as cattle pasture at least since the 1960s. When cattle-grazing operations ceased in 1993, some portions of these pastures were abandoned and grew into secondary forests, whereas others were converted to monoculture tree plantations. Site histories were determined from aerial photos and interviews with employees of the university.
The purpose of the plantations that were studied was primarily carbon fixation and they were managed using practices between typical timber plantations and pure restoration plantings. In general, planted trees were of a single species, either Vochysia guatemalensis or Hieronyma alchorneoides (83-100 %) with occasional other species interspersed. Planted trees were spaced at 3 × 3 m. One thinning of planted individuals occurred between three and five years in some sites. As a result, planted tree density at the time of this study ranged between 200 and 755 trees/ha. Understory regeneration was cleared with machetes in tree plantations up to five years following planting. After this period, natural regeneration in these plantations was not disturbed.
Study plots: Seven 30 × 30 m plots were established and sampled between May 2013 and July 2016 in tree plantations: three of V. guatemalensis and four of H. alchorneoides. These species were chosen for this study because they are native species commonly planted in the region in small to medium scale plantations (Piotto et al., 2003). Plots were placed centrally within each site to avoid edge effects (> 10 m from edges). Tree plantations were selected if they were monocultures planted for carbon fixation and were undisturbed since the fifth year after planting. Seven more plots were placed in secondary forests that resulted from natural regeneration on abandoned pastures. We selected secondary forest plots across the landscape that matched the age range and distribution of selected tree plantations. Plots were within 7 km of each other and forest types were distributed evenly across the landscape. Secondary forests ranged in age from 11.5 to 21 years during the initial census and between 5.0 and 20.5 ha in size. On the other hand, selected plantations ranged from 8 to 15.5 years in age during the initial census from 0.54 to 4.8 ha in size. Six other plots were established in tree plantations in 2013 but were cleared before the end of the study and excluded from the analysis.
Data Analysis: Woody plants in each plot with a diameter at breast height (dbh) ≥ 2 cm were measured and identified to species level. Initial censuses were conducted in eleven plots between May and July 2013 and in three plots (two plantations and one secondary forest) in October 2014. A second census was conducted in all plots between June and July 2016. Time between surveys was treated as 3 years for all sites. Those species were classified based on their growth form and regeneration guild. For example, according to maximum adult height, species were categorized into two growth forms: understory species (< 15 m) and canopy species (> 15 m). Information on maximum adult height was obtained from the Digital Flora database at La Selva Biological Station (Castro, 2013); we did not collect this data in the field because we did not have adults of all species. On the other hand, regeneration guilds were classified as short-lived pioneers, long-lived pioneers or shade-tolerant species. These guilds for Costa Rican tree species have been subjectively assigned based on observations by experienced forest ecologists and made available by the national forest resources agency (SIREFOR, 2010).
Based on this data, the following dependent variables were calculated: stem density (stems/m2), basal area (m2/ha), species density (number of species per plot), rarefied species richness (number of species at 70 individuals in rarefaction), and the relative abundances of understory species, canopy species, short-lived pioneers, long-lived pioneers and shade-tolerant species. We used 70 individuals in the rarefaction because the plot with the fewest trees had 70 individuals. Planted individuals were included for calculation of stem density and basal area, but excluded for all diversity and composition analysis. For the analysis, we combined the two types of tree plantations (H. alchorneoides and V. guatemalensis) since we did not observe significant differences in diversity or composition in a previous work we conducted (Longworth & Williamson, 2018).
To evaluate our first primary question, we tested whether change in all variables was significantly different from zero in each forest type and whether there was a difference between forest types in rate of change. All shifts in each dependent variable, between censuses, was calculated for each plot. We also measured the number of species lost and gained in each plot between censuses. If the amount of change had large deviations from normal distributions in several variables (rarefied richness and relative abundances of all growth forms and regeneration guilds), nonparametric tests were used: Wilcoxon’s signed-rank test for differences from zero and Mann-Whitney U test for differences between forest types. Otherwise, one-sample t-tests were used to check differences from zero, and two-sample t-tests for differences between forest types. Values of normally distributed variables are reported as mean ± standard deviation, whereas medians were reported for non-normal variables.
Secondly, to assess our second primary question, we compared the forest types to each other over time to determine if they were becoming more similar to each other. We tested for differences between forest types (tree plantations vs secondary forests) in the dependent variables during the first census and the second census using t-student tests. These variables were normally distributed and had similar variances in tree plantations and secondary forests. Additionally, for each of the nine dependent variables, we conducted five statistical tests (like those described above), resulting in 45 separate tests. These many tests can create the possibility of occasionally finding supposed effects that do not really exist (type I error). On the other hand, since our study involved a limited number of plots and a relatively short time interval, it is possible to conclude that there is no difference where sometimes differences exist (type II error). Thus, prudence is warranted when interpreting our results. Also, spatial autocorrelation was not found to be significant in previous analysis of the plots (Longworth & Williamson, 2018).
In addition to those analyses, we also tested the effect of forest age (time since planting or since pasture abandonment) on these same dependent variables. The age and dependent variables measured in each plot were averaged across the two censuses for this analysis so that these tests would be independent of changes between those periods of time. Then, we ran separate simple linear regressions for each forest type between dependent variables and age. We also used ordination techniques to answer both of our primary questions. Trajectories of species composition during succession were examined by calculating the pairwise Bray-Curtis dissimilarity between each plot-census combination. Abundance data where ln(x+1) was transformed to reduce influence of most abundant species. In particular, the ‘metaMDS’ function in the ‘vegan’ package (Oksanen et al., 2015) was used to construct a nonmetric multidimensional scaling (NMDS) ordination using these dissimilarities. Centroids for both forest types were calculated for the first and second census.
The change in position along Axis 1 and Axis 2 of the NMDS (trajectory, sensuLaurance et al., 2006) was calculated for each plot. For each forest type and each axis, we tested if the trajectory was significantly different from 0 - with Wilcoxon signed-rank test - and whether trajectory differed between forest types. We also evaluated whether forest type had a significant effect on species composition during the first and second census with the permutation test adonis in ‘vegan’. A separate NMDS ordination, with the same procedure, was constructed to compare the 2-3 and > 3 cm dbh size classes in the 2016 data set. This particular size class is presumed to contain the most recent recruits in the community. We combined all plots and size classes on one ordination and tested whether forest type had a significant effect on species composition of either size class.
Finally, we examined the changes in abundance at the species level. Percentage change in raw abundance [(Nf - Ni)/Ni *100] and change in relative abundance [(Nf /Af) - (Ni/Ai)] of each species were calculated separately for each forest type. N is the species abundance during the initial (Ni) and the final (Nf) census; A is the community abundance during the initial (Ai) and the final (Af) census. Abundances were pooled across all plots of the same forest type. Changes in relative abundances were tabulated and examined visually. A simple linear regression was performed to determine the correlation between percentage change in abundance of species in secondary forests and in tree plantations. The purpose of this test was to determine if species turnover was following similar trends in both forest types. Only species with at least five individuals in each forest type were used for this regression.
Results
Excluding the planted trees, we sampled 2 527 individuals and identified 95 species during the initial census, and 2 798 individuals and 116 species during the second census. Forest age (time since planting or pasture abandonment) was not significantly correlated, in either forest type, with species density, rarefied richness, stem density, basal area, or relative abundance of any ecological category (Appendix 1).
Stem density, basal area, and diversity: During the initial census, mean stem density in tree plantations (0.196 ± 0.069 stems/m2) was significantly lower than in secondary forests (0.273 ± 0.041, t12 = 2.32, P = 0.039). By the second census, forest types no longer differed significantly in stem density (Table 1). It actually increased significantly over three years in tree plantations (+0.042 ± 0.034, paired t-test, t6 = 3.26, P = 0.017), but not in secondary forests (+0.002 ± 0.041, t6 = 0.14, P = 0.89). However, rate of change in tree plantations was not significantly different than in secondary forests (t12 = 1.97, P = 0.072). Change in secondary forest plots was highly variable and ranged from -0.05 to 0.054 stems/m2.
TABLE 1 TABLA 1 Means (SD) of several characteristics of woody plant communities in secondary forest plots (SF, n = 7) and tree plantation plots (PL, n = 7) over two censuses 3 years apart from each other. Student’s t-tests (df = 12) were used to examine differences between forest types in each census Promedio (SD) de varias características de las comunidades de plantas leñosas en parcelas de bosque secundario (SF, n = 7) y parcelas de plantación de árboles (PL, n = 7) a lo largo de dos censos con una diferencia de 3 años entre sí. Se utilizaron las pruebas t-student (g.l. = 12) para examinar las diferencias entre los tipos de bosque en cada censo
| First census | Second census | ||||||||
| SF | PL | t | P | SF | PL | t | P | ||
| Stems/m2 | 0.273 (0.055) | 0.196 (0.069) | 2.32 | 0.039* | 0.275 (0.062) | 0.238 (0.059) | 1.15 | 0.27 | |
| Basal area (m2/ha) | 12.2 (6.4) | 20.6 (5.0) | 2.73 | 0.018* | 15.9 (5.5) | 22.3 (4.1) | 2.47 | 0.030* | |
| Species/plot | 27.7 (4.6) | 22.9 (9.1) | 1.3 | 0.23 | 29.1 (7.8) | 29.9 (7.3) | 0.17 | 0.86 | |
| Richness (rarefied) | 17.6 (3.7) | 17.4 (4.9) | 0.10 | 0.91 | 18.0 (5.0) | 20.2 (4.2) | 0.85 | 0.40 | |
| †Understory | 0.685 (0.084) | 0.513 (0.177) | 2.33 | 0.038* | 0.659 (0.080) | 0.447 (0.144) | 3.4 | 0.005* | |
| Canopy | 0.315 (0.084) | 0.487 (0.177) | 2.33 | 0.038* | 0.341 (0.080) | 0.553 (0.144) | 3.4 | 0.005* | |
| SLP | 0.745 (0.127) | 0.548 (0.232) | 1.97 | 0.071 | 0.701 (0.145) | 0.469 (0.203) | 2.47 | 0.030* | |
| LLP | 0.218 (0.097) | 0.428 (0.233) | 2.20 | 0.048* | 0.238 (0.103) | 0.487 (0.199) | 2.94 | 0.012* | |
| ST | 0.037 (0.035) | 0.024 (0.026) | 0.78 | 0.45 | 0.061 (0.050) | 0.044 (0.038) | 0.71 | 0.48 | |
† Relative abundances are of understory species (< 15 m adult height), canopy species (> 15 m), short-lived pioneers (SLP), long-lived pioneers (LLP), and shade-tolerant species (ST).
* indicated values < 0.05
During both censuses, mean basal area of tree plantations (initial census: 20.6 ± 5.0 m2/ha) was significantly larger than secondary forests (12.2 ± 6.4, Table 1). Both forest types had significant increases in basal area over three years (Table 2). The mean increase in basal area in tree plantations (+1.7 ± 1.9) was not significantly different from secondary forests (+3.7 ± 2.1, t12 = 1.81, P = 0.094).
TABLE 2 TABLA 2 Mean change (± SD) over 3 years of several characteristics of woody plant communities in secondary forest plots (SF, n = 7) and tree plantations (PL, n = 7). Statistical results show whether change over 3 years is significantly different from zero (one-sample t-test, df = 6) and whether rate of change differs between forest types (two-sample t-test, df = 12) Cambio promedio (± DS) en 3 años de varias características de las comunidades de plantas leñosas en parcelas de bosque secundario (SF, n = 7) y plantaciones de árboles (PL, n = 7). Los resultados estadísticos muestran si el cambio a lo largo de 3 años es significativo (prueba t de una muestra, g.l. = 6) y si la tasa de cambio difiere entre tipos de bosque (prueba t de dos muestras, g.l. = 12)
| 2013 vs 2016 | SF vs PL | ||||||||||
| Δ in SF | t | P | Δ in PL | t | P | t | P | ||||
| Stems/m2 | 0.002 (0.041) | 0.14 | 0.89 | 0.042 (0.034) | 3.26 | 0.017* | 1.97 | 0.072 | |||
| Basal area (m2/ha) | 3.7 (2.1) | 4.69 | 0.003* | 1.7 (1.9) | 2.83 | 0.030* | 1.81 | 0.094 | |||
| Species/plot | 1.4 (4.3) | 0.88 | 0.41 | 7.0 (3.9) | 4.78 | 0.003* | 2.54 | 0.026* | |||
| †Richness (rarefied) | -0.45 | W = 2 | 0.94 | 1.92 | W = 22 | 0.08 | Z = 1.47 | 0.13 | |||
| † Statistical tests for rarefied richness were non-parametric (Wilcoxon signed-rank and Mann Whitney) and median change is shown. | * indicated values < 0.05 | ||||||||||
On the other hand, mean species density and mean rarefied richness in tree plantations (rarefied richness initial census: 17.6 ± 3.7 species/plot) were not significantly different from secondary forests (17.4 ± 4.9) in either census (P > 0.23, Table 1). However, increase in species density over three years was significantly larger in tree plantations (+7.0 ± 2.9) than in secondary forests (+1.4 ± 3.2, Table 2). The number of species lost did not differ between forest types (SF: 3.7 ± 1.2, PL: 2.6 ± 1.1, t12 = 1.37, P = 0.098), but tree plantations gained more species per plot than secondary forests (SF: 5.1 ± 2.6, PL: 9.4 ± 2.7, t12 = 2.2, P = 0.022). Rarefied richness (species/70 ind.) did not increase significantly in either tree plantations or secondary forests nor did rate of change differ between forest types (Table 2).
Growth forms and regeneration guilds: Rate of change in relative abundance of different growth forms and regeneration guilds did not differ significantly between tree plantations and secondary forests (Mann-Whitney, P > 0.38, Fig. 1, Appendix 2). In secondary forests, the relative abundance of short-lived pioneers decreased significantly between censuses (median: -0.024; Wilcoxon signed-rank test, P = 0.031). In tree plantations, short-lived pioneers decreased and long-lived pioneers increased significantly (median: -0.037 and 0.027, respectively, Appendix 2). Changes in long-lived pioneers in secondary forests, shade-tolerant species and growth forms in both forest types were not statistically significant over three years (Appendix 2). However, all categories followed the predicted direction of change in at least five of the seven plots in each forest type. Median changes of these groups in tree plantations (shade-tolerant and understory species: +0.014, -0.019, respectively) were similar to changes in secondary forests (+0.012, -0.023). Variation in the amount of change in relative abundance of these groups was larger in tree plantations than secondary forests (Fig. 2) due to a large turnover in species composition in one tree plantation plot.
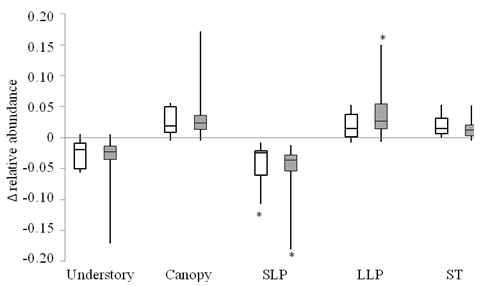
Fig. 1. Fig. 1 Change in relative abundance over 3 years of different categories of woody plants in tree plantation plots (shaded boxes, n = 7) and secondary forest plots (open boxes, n = 7). Categories are understory species (< 15 m adult height), canopy species (> 15 m adult height), short-lived pioneers (SLP), long-lived pioneers (LLP), and shade-tolerant (ST). Line inside the boxes represents the median, top and bottom of boxes represent the 75th and 25th percentile, respectively, and whiskers represent the 10th and 90th percentiles. (*) indicates significant difference from zero (Wilcoxon signed-rank test, P < 0.05). Cambio en la abundancia relativa, a lo largo de 3 años, de diferentes categorías de plantas leñosas en parcelas de plantación de árboles (cajas sombreadas, n = 7) y en parcelas de bosque secundario (cajas abiertas, n = 7). Las categorías son especies de sotobosque (< 15 m de altura adulta), especies de dosel (> 15 m de altura adulta), pioneros de vida corta (SLP), pioneros de vida larga (LLP) y tolerantes a la sombra (ST). La línea dentro de los recuadros representa la mediana, la parte superior e inferior de los recuadros representan los percentiles 75 y 25, respectivamente, y los bigotes representan los percentiles 10 y 90. (*) indica una diferencia significativa con respecto a cero (prueba de Wilcoxon de rango firmado, P < 0.05).
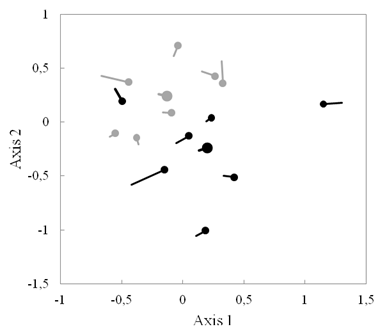
Fig. 2. Fig. 2 Nonmetric multidimensional scaling (NMDS) showing the successional trajectory of species composition of woody plants over 3 years in tree plantation plots (black) and secondary forest plots (gray). Circles mark second census, and centroids of each forest type are shown by larger circles. Escala multidimensional no métrica (NMDS) que muestra la trayectoria sucesional de la composición por especies de plantas leñosas a lo largo de 3 años en parcelas de plantación de árboles (negras) y en parcelas de bosque secundario (grises). Los círculos marcan el segundo censo y los centroides de cada tipo de bosque se muestran en círculos más grandes.
Ordination: Species composition in tree plantations was significantly different from secondary forests in both 2013 and 2016 (adonis tests in 2013: P = 0.042, in 2016: P = 0.041, Fig. 2), with tree plantations having larger Axis 1 values and smaller Axis 2 values than secondary forests. Positive values on Axis 1 were correlated with higher relative abundances of canopy species and long-lived pioneers (R2 = 0.51, R2 = 0.76, respectively).
Additionally, distance between the tree plantation centroid and the secondary forest centroid decreased slightly from 2013 to 2016 (0.619 to 0.586, Fig. 2): the centroids of both forest types had a trajectory towards larger values on Axis 1 (Fig. 2). Also, the median trajectory on Axis 1 of secondary forest plots (+0.044) was significantly different from 0 (Wilcoxon signed-rank test, P = 0.047), but was not for tree plantation plots (+0.076, P = 0.21). However, when removing one plot which began with a larger Axis 1 position than others, change on Axis 1 of tree plantations is statistically different from zero (P = 0.03). In the case of Axis 2, the trajectory was not significantly different from 0 for either forest type (P > 0.25, Appendix 2).
Recent recruits (2-3 cm dbh size class in 2016) account for 48 % and 26 % of individuals in tree plantations and secondary forests, respectively. Also, species composition of recent recruits in tree plantations was significantly different from secondary forests (adonis test, P = 0.021, Fig. 3).
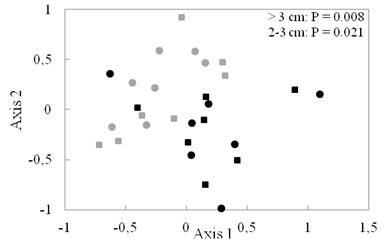
Fig. 3 Ordination (NMDS) of species composition of different size classes (> 3 cm dbh [circles] and 2-3 cm dbh [squares]) in tree plantations (PL, black) and secondary forests (SF, gray). Difference between forest types was significant for both size classes.
Fig. 3. Ordenación (NMDS) de la composición de especies de diferentes clases de tamaño (> 3 cm dbh [círculos] y 2-3 cm dbh [cuadrados]) en plantaciones de árboles (PL, negro) y bosques secundarios (SF, gris). La diferencia entre los tipos de bosque fue significativa para ambos tipos de tamaño.
Species level changes: There was a significant positive correlation between the percentage change in abundance of non-rare species (> 5 individuals in each forest type) in tree plantations and secondary forests (R2 = 0.26, P = 0.004, Fig. 4). Among the ten species with the largest increases in relative abundance, in either forest type, the shrub Piper colonense was the only species in common to tree plantations and secondary forests (Appendix 3). Of the ten species with the largest decreases in relative abundance, there were six species in common to the two forest types: Palicourea guianensis, Senna papillosa, Hampea appendiculata, Piper friedrichsthalli, Conostegia subcrustulata, and Cecropia obtusifolia.
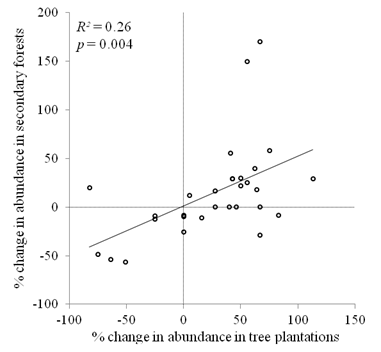
Fig. 4. Fig. 4 Relationship between percent change in abundance in secondary forests and in tree plantations of species with at least 5 individuals in both forest types (n = 30). Relación entre el cambio porcentual de la abundancia en los bosques secundarios y de las plantaciones de especies arbóreas con al menos 5 individuos en ambos tipos de bosque (n = 30).
Discussion
There are few studies (e.g. Gilman et al., 2016) that compare successional dynamics in tree plantations and secondary forests. We found that differences between tree plantations and secondary forests in stem density and basal area declined over time. The increase in species richness did not differ between forest types when accounting for number of individuals, and the species composition followed a similar successional trajectory in tree plantations and secondary forests without leading towards convergence of forest types. This study only covers a three-year period in forests that are in the second decade of succession, so our conclusions do not extend to longer time scales or older forests. However, we did find that shifts in plant communities were consistent enough across plots to make conclusions about succession during this time period.
Stem density and basal area of woody plants in tree plantations became more similar to secondary forests during this study. This agrees with our prediction that these forest types would become more similar over time in variables with rapid changes. If the rates of change observed are projected out, mean stem density and mean basal area in tree plantations would converge with secondary forests in just three and nine more years, respectively. These findings are consistent with convergent patterns in stem density and basal area seen in alternative successional pathways resulting from different restoration approaches (Shoo, Freebody, Kanowski, & Catterall, 2016) or different land-use intensities (Williamson et al., 2014).
Our study suggests that in tree plantations which undergo early understory clearings, abundance of woody plants reaches similar levels as in secondary forests within two or three decades. Stem density often reaches a stable equilibrium or peaks during the first 30 years of tropical forest succession (Aide, Zimmerman, Herrera, Rosario, & Serrano, 1995; Feldpausch, Riha, Fernandes, & Wandelli, 2005; Lebrija-Trejos et al., 2010; Dupuy et al., 2012) because growth, mortality and recruitment rates are density dependent (Uriarte, Condit, Canham, & Hubbell, 2004; Wills et al., 2016). In this study, secondary forests, on average, had little change in stem density, with some plots increasing and others are decreasing. This finding indicates that some secondary forest plots had reached the stem exclusion phase of succession (Oliver & Larson, 1996) during which mortality rates increase (Lebrija-Trejos et al., 2010; Longworth et al., 2014). On the other hand, tree plantations, which had significant increases in stem density, had not yet reached the stem exclusion phase.
The latter location, in our study, also had higher basal area than secondary forests. This result is consistent with general findings that recovery of above ground biomass is marginally more rapid in tree plantations than in secondary forests (Bonner, Schmidt, & Shoo, 2013). Above ground biomass is correlated with important ecosystem processes such as productivity and litter decomposition during secondary succession (Lohbeck, Poorter, Martínez-Ramos, & Bongers, 2015). Additionally, the difference between tree plantations and secondary forests in basal area decreased during our study, possibly because planted trees have exceeded the dbh of peak growth increments, whereas canopy trees in secondary forests have not. Ontogenetic changes in dbh growth increments are common with peaks around 60 % of maximum size (Herault et al., 2011). Also, growth rates of pioneer tree species in our secondary forest sites are likely faster than our planted trees, especially for H. alchorneoides which does not grow as quickly as V. guatemalensis.
Whereas several forest traits showed significant changes over three years, plot age was not significantly related to stem density, basal area, or any other characteristics of woody vegetation. This was not surprising given the small sample size and small span in stand age (8-23 years) in our study. The rate of forest recovery has been shown to be highly variable from site to site (Norden et al., 2015) and chronosequences such as ours may not be able to detect successional trends as well as short time series data.
Although species density of woody plants increased more rapidly in tree plantations than in secondary forests, rarefied number of species did not change significantly in either forest type. Therefore, the change in species accumulation was primarily due to a difference in stem accumulation. Previous research has shown that species density is highly sensitive to stem density during secondary succession (Chazdon, Colwell, Denslow, & Guariguata, 1998). Even though, it is important to point out that there may have been a difference between forest types that we could not detect with our limited time frame and sample size. Tree plantations have been shown to enhance the diversity of woody plants within the first decade of succession compared to abandoned pastures (Powers et al., 1997; Zahawi et al., 2013), but it is unknown for how long species accumulation rates differ. Furthermore, slow rate of change in species richness has been observed in other secondary forests. Although species density often does increase after stem density stabilizes, long-term plots often exhibit periods without a significant increase in species density (Chazdon et al., 2007; Norden et al., 2015). Since many species are rare in species-rich tropical forest (Gentry, 1988), species accumulation during tropical forest succession depends on infrequent dispersal events of rare mature forest species. In highly fragmented landscapes with few intact primary forests, seed disperser movement can be limited (McConkey et al., 2012). The isolation of our sites from primary forest, likely prevents rapid accumulation of species during succession.
Conversely, magnitude and direction of changes in relative abundances of woody plant growth forms and regeneration guilds were very similar in tree plantations and secondary forests. This is contrary to our prediction that the rate of change would be faster in secondary forests. This study is the first to examine shifts in functional groups, such as growth form and regeneration guilds, in tree plantations. Direction of changes followed our predictions (decreases in understory species and short-lived pioneers; increases in canopy species, long-lived pioneers and shade-tolerant species), nevertheless change over the three-year period was only significant for short and long-lived pioneers. Similarity between tree plantations and secondary forests in these patterns may reflect their deterministic nature. Directional changes in abundance of different growth forms and regeneration guilds are ubiquitous in chronosequence and time series studies of secondary succession of tropical forests (Capers et al., 2005; van Breugel et al., 2007; Lebrija-Trejos et al., 2010; Chazdon et al., 2010; Dent, DeWalt, & Denslow, 2013).
Also, shrub seedling relative abundance decreases predictably in this region: declining from above 0.5 in a 14-year-old secondary forest to below 0.1 at 30 years (Capers et al., 2005). Short-lived pioneers reach peaks in abundance during the first two decades of succession, whereas long-lived pioneers and mature forest species continue to increase (Chazdon et al., 2010; Lebrija-Trejos et al., 2010). Regeneration guild composition of secondary forests has been shown to converge with old growth forest over time, even in sites where overall species composition is not strongly predicted by forest age (Dent et al., 2013). Shifts in regeneration guilds during tropical succession result from differences in demographic rates, with early pioneers having higher recruitment and growth rates than mid to late successional species during the first decade, but also higher mortality rates as canopy closure occurs (Finegan, 1996; Lebrija-Trejos et al., 2010). Our results suggest that demographic rates of different regeneration guilds are similar in tree plantation understory and in young secondary forests.
Furthermore, trajectory of species composition of woody plants in ordination space was similar in secondary forests and tree plantations. Also, percentage changes in abundance of individual species were correlated across forest types, indicating similar successional dynamics. Gilman et al. (2016) also observed similar successional trajectories in tree plantations and secondary forests based on ordination analysis at sites ranging from one to five years old. Several studies of tropical secondary forest succession have observed consistent shifts in species composition with forest age often leading to increased similarity to primary forest (Peña-Claros, 2003; DeWalt, Maliakal, & Denslow, 2003; Letcher & Chazdon, 2009; Lebrija-Trejos et al., 2010), although in some cases composition turnover is unpredictable (Dupuy et al., 2012; Dent et al., 2013).
Therefore, our prediction that secondary forests would have greater turnover in species composition was not correct. We expected that mortality of short-lived pioneers would drive rapid compositional changes in the secondary forest. The similarity in successional trajectory between tree plantations and the latter seems to be largely due to similar declines in relative abundance of short-lived pioneers, such as the shrub Palicourea guianensis and the tree Hampea appendiculata. Although, short-lived pioneers made up a larger proportion of secondary forests than tree plantations, it appears that the decline of this guild occurred at a similar rate. However, it is still possible that the dominant canopy tree in secondary forests, Hampea appendiculata, a short-lived species, could reach senescence over the next two decades, resulting in rapid compositional turnover. Other planted species in these plantations have life spans of several more decades.
Finally, despite following similar directional changes in species composition of woody plants, tree plantations did not appear to move towards convergence with secondary forests. Differences between both areas were detected in ordination space and in relative abundance of growth forms and the regeneration guilds did not decline greatly. This can be explained by the fact that species with the largest increases in relative abundance in each forest type were mostly already present in high abundances. Evidence of this is that the species composition of the smallest size class (most recent recruits) in tree plantations was different from secondary forests. Also, although our study covered changes over only three years, these results may reflect the importance of priority effects and historical events in these sites. Species composition in a marked location often becomes less similar or maintains differences during long-term studies of tropical secondary succession (Vandermeer et al., 2004; Capers et al., 2005; Longworth et al., 2014) and successional sites retain the legacy of initial colonizers for many decades (van Gemerden, Olff, Parren, & Bongers, 2003; Mesquita, Massoca, Jakovac, Bentos, & Williamson, 2015). Therefore, tree plantations may have long-term impacts on species composition of natural regeneration by altering the initial recruitment conditions. Propagation within the same site of rapidly reproducing shrubs and slow turnover of long-lived species may prevent rapid convergence of species composition of tree plantations and secondary forest with each other.

