


 Espanhol (pdf)
 Artigo em XML
 Referências do artigo
 Enviar este artigo por email
 Citado por SciELO
  Similares em
SciELO
Similares em
SciELO  uBio
uBio 
 Permalink
Introduction
Rotifera is a group of microscopic animals (< 2 mm) that encompasses approximately 2 000 species (Segers, 2007). They are globally distributed in freshwater and brackish habitats, from large lakes to small ponds, along with a small number of marine habitats (Wallace, Snell, Ricci, & Nogrady, 2006). Rotifers play a pivotal role in aquatic food webs by transferring energy to higher trophic levels (Xiang, Xi, Zhu, & Xu, 2017). The subclass Monogononta, which includes most species in the phylum, comprises planktonic, littoral and benthic organisms (Segers, 2008). Monogonont rotifers reproduce by cyclical parthenogenesis, alternating periods of asexual reproduction with sexual phases (Wallace, 2002). When sexual reproduction is carried out, they produce resting eggs that are resistant to harsh environmental conditions and are adapted to passive dispersal (Mills, Lunt, & Gómez, 2007). These eggs can also accumulate in sediments providing an archive of the species genetic variability (Gómez, Carvalho, & Lunt, 2000).
As with other zooplankton, the taxonomy of rotifers is understudied (Segers, 2007; Fontaneto, Kaya, Herniou, & Barraclough, 2009). The causes of this are well known: 1) there are few taxonomists that can identify a rotifer reliably, 2) rotifers are typically morphologically austere and as such have few recognizable morphological characters and 3) the small size of rotifers makes it difficult to identify some taxa to the species level, this is particularly the case for littoral and benthic rotifers (Mark Welch & Mark Welch, 2005). Among monogonont rotifers, morphology may not be sufficient to differentiate between species due to 1) limited or not morphological variation among cryptic species (Campillo, Serra, Carmona, & Gómez, 2011; Mills et al., 2017), and 2) phenotypically plastic morphological variation within a single species resulting from cyclomorphosis and inducible defenses (Gilbert, 2001; Wallace, 2002). Phenotypic plasticity is an important characteristic of monogonont rotifers, and different morphological variants have in the past erroneously been described as different subspecies, forms or varieties (Segers & De Smet, 2008). Nevertheless, the taxonomic status of these morphotypes remains unclear for most monogonont rotifers (Segers, 2007).
Molecular results of the best studied monogonont rotifers Brachionus plicatilis and B. calyciflorus have shown that each of these two taxa contains at least 15 genetically divergent lineages (Mills et al., 2017; Papakostas et al., 2016). In the case of the B. plicatilis species complex, some cryptic taxa show little interspecific morphological differentiation. Therefore, it seems that extensive genetic and ecological variation in some rotifers can occur along with an apparent absence of morphological differentiation (Serra, Galiana, & Gómez, 1997; Mills et al., 2017). Cryptic species have also been reported in other monogonont rotifer based on genetic data, for example in Epiphanes senta (Müller, 1773) (Schröder & Walsh, 2007), Lecane bulla (Gosse, 1851) (Walsh, Schröder, Wallace, & Rico-Martinez, 2009), Testudinella clypeata (Müller, 1786) (Leasi et al., 2013), Polyarthra dolichoptera Idelson, 1925 (Obertegger et al., 2014), Synchaeta pectinata (Ehrenberg, 1832) (Kimpel, Gockel, Gerlach, & Bininda-Emonds, 2015), Euchlanis dilatata Ehrenberg, 1832 (Kordbacheh, Garbalena, & Walsh, 2017), Keratella cochlearis Gosse, 1851 (Cieplinski et al., 2017), Limnias melicerta Weisse, 1848 and L. ceratophylli Schrank, 1803 (Kordbacheh, Wallace, & Walsh, 2018) and several more (García-Morales & Elías-Gutiérrez, 2013). In addition some studies have used morphological and ecological analysis as well as crossmating experiments to examine cryptic diversity. For example in the B. plicatilis complex, morphology and molecular analysis and mating experiments were carried out (Suatoni et al., 2006). A same approach was used by Schröder & Walsh (2007) to study the Ephiphanes senta complex. Whereas Papakostas et al. (2016) used morphological, ecological and molecular analyses to studied B. calyciflorus species complex. All these studies provide evidence of how molecular approaches are important tools for understanding the nature of genetic differentiation and are also relevant to rotifer taxonomy.
In the most recent revision of Rotifera, the genus Brachionus (Pallas, 1766) contained approximately 62 taxa (Segers, 2007), most of them predominantly inhabiting warm water. Brachionus is diagnosed by a loricated body that is formed by a dorsal and a ventral plate. Dorsal anterior margin of the lorica can contain six, four or two spines, whereas the ventral anterior margin is generally undulated. Some species have spines on the posterior edges of the lorica or at the foot opening. For the genus a malleate trophi is characteristic (Koste & Shiel, 1987). Brachionus are polymorphic in some species groups. One of these polymorphic species is Brachionus quadridentatus Hermann, 1783 which is typically found in the littoral zone of fresh and brackish water (Koste & Shiel, 1987). B. quadridentatus is a cosmopolitan species reported in all continents including Antarctica (Dumont, 1983; Segers, 2007). This species exhibits broad intraspecific morphological variation associated with spine development, which is reflected in different forms, varieties and synonyms of doubtful taxonomic validity (Koste, 1978; Segers, 2007). Two of these forms are B. quadridentatus f. brevispinus (Ehrenberg, 1832) and B. quadridentatus f. cluniorbicularis (Skorikov, 1894), which are common in waterbodies worldwide (Koste & Shiel, 1987). García-Morales and Elías-Gutiérrez (2013) reported a significant difference in mtDNA sequence in some populations of B. quadridentatus collected from southeast Mexico, suggesting the presence of cryptic species.
In the present study we used sequence variation in the mitochondrial cytochrome c oxidase subunit I (COI) and the nuclear ribosomal 18S genes to explore the diversity of Brachionus quadridentatus from inland waterbodies of Mexico. In particular, we investigated whether different morphotypes in this taxon may represent putative cryptic species, with some remarks on the variation in the lineages distribution patterns.
Materials and methods
Sampling and identification: Samples were collected in 12 locations across Mexico (Fig. 1; Table 1 and Table S1). Geographic data from another five water bodies were obtained from a previous study (see Table 1) (García-Morales & Elías-Gutiérrez, 2013). Our study area covered four biogeographic provinces: the Trans-Mexican Volcanic Belt (TMVB) and Baja California Peninsula (temperate zones), as well as the Gulf of Mexico and Yucatan Peninsula (tropical zones) (Fig. 1; Table S1). Samples were collected using a 50 µm mesh size plankton net and preserved in 96 % ethanol. Brachionus quadridentatus specimens were sorted from the samples under a compound microscope, rinsed with distilled water to remove debris, and transferred into PCR tubes for DNA extraction.
Specimens were identified morphologically using the features of the lorica, in particular its overall shape, the shape of its posterior margin, length and shape of the median anterior spines and the posterior caudal spines. We identified the specimens following the taxonomic keys of Koste (1978) and Koste & Shiel (1987). Specimens from different locations and morphogroups were illustrated using a camera lucida attached to an optical microscope.
DNA extraction, amplification, sequencing, and alignment: DNA extraction and amplification for the COI gene were conducted following the protocol described by García-Morales and Elías-Gutiérrez (2013). Details of the 18S rRNA amplification profile are provided in Table S2. The primers for the COI gene were LCO1490: 5´-GGT CAA CAA ATC ATA AAG ATA TTG G-3´ and HCO2198: 5´-TAA ACT TCA GGG TGA CCA AAA AAT CA-3´ (Folmer, Black, Hoeh, Lutz, & Vrijenhoek, 1994). The primers for the 18S gene were 18SF new: 5´-AGA TTA AGC CAT GCA TGT CT-3´ and 9R: 5´-GAT CCT TCC GCA GGT TCA CCT AC-3´ (Tang et al., 2012). PCR products were sequenced in the High Throughput Genomics Center in Seattle, USA. Obtained sequences were deposited in GenBank under accession numbers COI: MN627001-MN627154; 18S: MN636060-MN636184. To increase the geographic range of the samples we included 22 mitochondrial sequences of B. quadridentatus from La Escondida, Vernet, Charco 1, Parque Ecologico and El Rosario locations (Fig. 1; Table 1 and S1), reported by García-Morales and Elías-Gutiérrez (2013), and downloaded from GenBank (accession numbers JX216559-JX216569, JX216571-JX216573, JX216575-JX216580, JX216582-JX216583). COI gene sequences were aligned in MEGA v. 6.0 (Tamura, Stecher, Peterson, Filipski, & Kumar, 2013) using ClustalW with default settings, whereas 18S gene sequences were aligned with MAFFT v. 7 using the Q-INS-I algorithm regarded as the optimal strategy for ribosomal markers (Katoh, Asimenos, & Toh, 2009). This last aligment was carried out on the MAFFT webserver http://mafft.cbrc.jp/alignment/server/index.html (accessed June 9, 2017). Final alignments were checked visually.
Species delimitation: We applied five methods of species delimitation for mtDNA, rRNA, and the concatenated datasets:
1) The algorithm of Statistical Parsimony (SP) implemented in TCS 1.2.2 (Clement, Posada, & Crandall, 2000), that was designed to construct intraspecific relationships in haplotype networks, but has also been used to detect candidate species (Jörger, Norenburg, Wilson, & Schrödl, 2012). We used this algorithm applying the 95 % connection probability limit, with gaps coded as missing.
2) The Generalized Mixed Yule-Coalescent model (GMYC) (Pons et al., 2006), that uses a maximum likelihood approach to optimize the threshold identifying the shift in the branching patterns of the gene tree from interspecific branches (Yule model) to intraspecific branches (coalescent). This method has been previously used on rotifers (Fontaneto et al., 2009). For the GMYC model we generated ultrametric trees from the three datasets using BEAST v. 2.1.3 (Bouckaert et al., 2014). The parameters comprised a GTR+G+I substitution model, a relaxed lognormal clock, and a birth-death prior (Tang, Obertegger, Fontaneto, & Barraclough, 2014). The analyses were run with 50 000 000 MCMC for the COI and 18S genes, and 70 000 000 MCMC for the concatenated dataset, sampling every 1 000 generations. Because of the absence of a molecular clock specific to Rotifera, we used calibration clocks for COI of 1.76 % sequence divergence per Myr tested in aquatic invertebrates (Wilke, Schultheiß, & Albrecht, 2009) and 0.02 % per Myr for 18S, both recently applied to rotifers (Tang et al., 2014). The MCMC runs were checked for convergence in Tracer v.1.6 (Rambaut, Suchard, & Drummond, 2013). Trees were combined in TreeAnnotator v.2.1.2 using a maximum credibility tree, with the first 10 % discarded as burn-in. The GMYC model was run through the GMYC webserver, using the multiple threshold option (http://species.h-its.org/gmyc/; accessed Juanary 8, 2017).
3) Bayesian implementation of the Poisson Tree Processes model (PTP) (Zhang, Kapli, Pavlidis, & Stamatakis, 2013), that uses a rooted phylogenetic tree as input and model speciation or branching events in terms of number of substitutions, adding Bayesian support values to delimited species on that tree. We used the ML phylogenetic trees (see below), and the analyses were run with 500 000 MCMC generations on the PTP webserver (http://species.h-its.org/). 4) The Automatic Barcode Gap Discovery (ABGD) model clusters sequences based on genetic distances by detecting differences between intra and interspecific distances. This difference between intra and interspecific distances produce a barcoding gap that can be observed whenever the genetic distance among individuals belonging to the same species is smaller than distance among individuals from different species (Puillandre, Lambert, Brouillet, & Achaz, 2012). Therefore, groups of individuals united by smaller genetic distances were considered to be equivalent to species. ABGD was applied only to the COI gene as this method is based on genetic distances calculated in a single marker, therefore was not used in the concatenated data. The 18S rRNA ABGD did not yield any result due to the poor variation of the gene. ABGD analysis was carried out through its online webserver (http://wwwabi.snv.jussieu.fr/public/abgd/abgdweb.html) using default settings. 5) a multispecies coalescent model was performed using *BEAST v.2.0 (Heled & Drummond, 2010) as implemented in the software package BEAST 2 (Bouckeart et al., 2014). All the specimens for which both COI and 18S rRNA sequences were available were used in the analyses, consequently some specimens show in the COI phylogenetic tree that did not have available 18S sequences were not used. In order to test all well differentiated monophyletic groups found in the phylogenetic results two independent hypothesis were tested: 1) three species, based on the 18S phylogeny and 2) six species based of the monophyletic groups found in the concatenated phylogenetic analyses (since the Charco 1 genetic group is not available for 18S rRNA). Species tree analysis for the two assignments were performed as follows; the best fit models of nucleotide evolution for the model of molecular evolution that best fit the mtDNA (TVM+G) and rRNA (TrN) were used with four gamma categories. We used calibration clocks for COI of 1.76 % sequence divergence per Myr (Wilke et al., 2009) and 0.02 % per Myr for 18S (Tang et al., 2014). For species tree priors and population size models, a Birth-Death process and a constant species tree population size were chosen. Three independent MCMC runs were performed for 500 000 000 generations, sampling every 5 000 generations. Chains convergence was assessed by visualizing the sampled parameter values in Tracer 1.6 (Rambaut et al., 2013). Ten percent of the generations were discarded as burn-in and pooled using the module Log-Combiner in the BEAST 2 package. The maximum clade credibility species tree was obtained by the module Tree-Annotator in the BEAST 2 package.
Phylogenetic relationships: Bayesian inference (BI) and maximum-likelihood (ML) analyses were used to infer phylogenetic relationships among populations of B. quadridentatus, with mitochondrial DNA (mtDNA COI) and nuclear ribosomal DNA (rRNA 18S) analyzed separately and concatenated. The BI and ML analyses were conducted using MrBayes v. 3.1.2 (Ronquist & Huelsenbeck, 2003) and RaxML v. 1.3.1 (Stamatakis, Hoover, & Rougemont, 2008), respectively. For the BI analysis, the jModelTest v. 2.1.1 (Darriba, Taboada, Doallo, & Posada, 2012) was used to identify the model of molecular evolution that best fit the mtDNA (TVM+G), rRNA (TrN), and concatenated (GTR+I+G) data under the Akaike information criterion (AIC). The settings for the BI analyses for each molecular dataset were four simultaneous Markov Chain Monte Carlo (MCMC) runs for 4 000 000 generations for mitochondrial and nuclear data, and 6 000 000 for the concatenated dataset, with trees sampled every 100 generations, and a burn-in of 25 %. Finally, a majority-rule consensus tree was obtained. For ML analyses we used GTR+G (mtDNA data), GTR (rRNA data), and GTR+I+G (concatenated) models as implemented in RaxML v. 1.31. Maximum likelihood analyses were run with 10 000 bootstrap replications.
Genetic diversity and differentiation: We measured genetic diversity and genetic differentiation in order to provide some biogeographic remarks of the B. quadridentatus lineages found using mainly COI gene data. The number of haplotypes, haplotype diversity (Hd), and nucleotide diversity (π) were calculated using DnaSP v. 5.10 (Librado & Rozas, 2009) for mtDNA data for each location, as well as for each lineage discriminated by the phylogenetic analyses of the COI gene, and for two of the three lineages found in the phylogenetic trees for 18S gene. Genetic distances (uncorrected p-values) for the COI gene within and among the lineages discriminated by the phylogenetic analyses for the mitochondrial and the nuclear genes were calculated in MEGA v. 6.0. To assess genetic differentiation among the lineages discriminated by the phylogenetic analyses for COI gene (see results), a hierarchical Analysis of Molecular Variance (AMOVA) was performed in Arlequin v. 3.5 (Excoffier, Smouse, & Quattro, 1992), and its significance was tested using 20 000 permutations. To test the hypothesis that genetic differentiation among these mitochondrial lineages increases with geographic distance, the correlation between the F ST distances and geographic distance (km) was obtained using a Mantel test (Mantel, 1967) in Arlequin v. 3.5. Significance of the correlation was determined via 10 000 permutations.
Results
Sequence variation: The final alignment for the mitochondrial COI gene had 635 bp, with 242 polymorphic sites and 233 parsimony informative sites, defining 38 unique haplotypes from 176 sequences (154 de novo and 22 from GenBank). For the nuclear 18S gene 830 bp were obtained, with eight polymorphic sites and seven parsimony informative sites defining seven haplotypes from 125 sequences (all de novo). Most mtDNA haplotypes were unique for a single population, but two haplotypes were shared between two populations that belong to the same watershed (COLVEG1 and VERCH1-1) (Fig. 1; Table S1). Cuitzeo Lake had the highest number of mitochondrial haplotypes (8) followed by La Colorada Lake (6) (Table 1). Cuitzeo was also the site with the highest number of specimens. The highest number of nuclear haplotypes (2) was found in the Cuitzeo, La Zarcita and Ixtlahuaca sites (Table 1).
TABLE 1: Name and acronym of the sampling sites, number of individuals sequenced (N) and number of haplotypes (H) for COI and 18S genes. Hd and π are the haplotype and nucleotide diversity, respectively of the COI gene. Standard deviation is shown within parentheses
| COI mtDNA 18S rDNA | |||||||||
| Locality | Code | Collecting dates | Coordinates | N | H | Hd | π | N | H |
| 1. La Colorada♠ | COL | 17/11/14 | 20°45’37”N & 103°59’39”W | 15 | 6 | 0.810 (0.075) | 0.08757 (0.01617) | 15 | 1 |
| 2. La Vega | VEG | 17/11/14 | 20°40’46”N & 103°50’59”W | 7 | 2 | 0.476 (0.171) | 0.00225 (0.00081) | 6 | 1 |
| 3. Atotonilco | ATO | 18/11/14 | 20°24’28”N & 103°39’59”W | 3 | 1 | 0 | 0 | 3 | 1 |
| 4. Yuriria | YUR | 27/09/14 | 20°13’16”N & 101°08’10”W | 5 | 1 | 0 | 0 | 9 | 1 |
| 5. La Joya | JOY | 27/09/14 | 20°12’27”N & 101°07’55”W | 11 | 1 | 0 | 0 | 11 | 1 |
| 6. Cuitzeo | CUI | 25/02/14 | 19°57’24”N & 100°55’32”W | 48 | 8 | 0.428 (0.085) | 0.00158 (0.00054) | 16 | 2 |
| 7. La Zarcita♠ | ZAR | 05/07/14 | 19°49’22”N & 101°47’42”W | 14 | 3 | 0.659 (0.072) | 0.07113 (0.00810) | 13 | 2 |
| 8. Teremendo | TER | 23/03/14 | 19°48’21”N & 101°27’10”W | 12 | 2 | 0.167 (0.134) | 0.00131 (0.00106) | 12 | 1 |
| 9. Uranden | URA | 04/09/14 | 19°32’29”N & 101°38’25”W | 11 | 2 | 0.509 (0.101) | 0.00641 (0.00127) | 11 | 1 |
| 10. La Magdalena | MAG | 12/07/14 | 19°12’31”N & 101°28’29”W | 6 | 2 | 0.533 (0.172) | 0.00084 (0.00027) | 9 | 1 |
| 11. Ixtlahuaca | IXT | 17/08/14 | 19°29’13”N & 99°44’04”W | 12 | 2 | 0.485 (0.106) | 0.01680 (0.00367) | 10 | 2 |
| 12. Lerma | LER | 17/08/14 | 19°14’03”N & 99°31’13”W | 10 | 2 | 0.467 (0.132) | 0.00294 (0.00083) | 10 | 1 |
| 13. Escondida* | ESC | 27/08/10 | 18°35’31”N & 95°05’17”W | 5 | 1 | 0 | 0 | - | - |
| 14. Vernet*♠ | VER | 25/06/11 | 17°52’37”N & 92°33’01”W | 5 | 2 | 0.600 (0.175) | 0.10338 (0.03020) | - | - |
| 15. Charco 1*♠ | CH1 | 26/06/11 | 18°06’33”N & 92°04’41”W | 2 | 2 | 1.000 (0.500) | 0.15298 (0.07649) | - | - |
| 16. Parque Ecologico* | PEC | 29/10/10 | 18°30’25”N & 88°19’08”W | 5 | 2 | 0.600 (0.175) | 0.00193 (0.00056) | - | - |
| 17. El Rosario* | ROS | 21/01/11 | 23°45’11”N & 110°05’24”W | 5 | 1 | 0 | 0 | - | - |
* Obtained from García-Morales and Elías-Gutiérrez (2013).
♠ In these locations two morphotypes were found together.
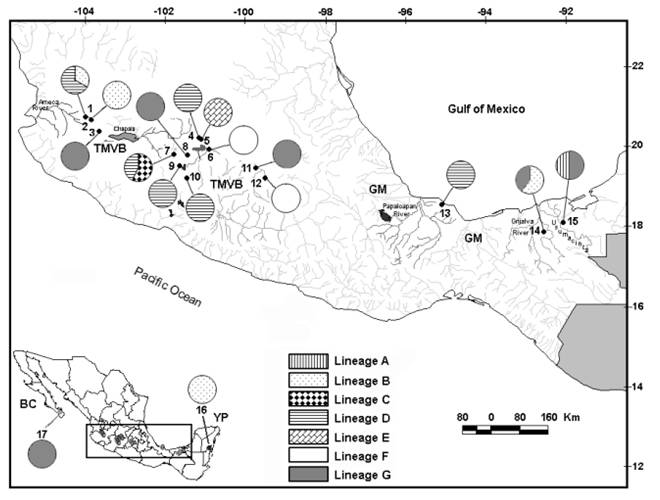
Fig. 1 Sample locations in Central and Southeast Mexico. Numbers on the map correspond to the numbers in Table 1. Biogeographic provinces are TMVB = Trans-Mexican Volcanic Belt, GM = Gulf of Mexico, BC = Baja California and YP = Yucatan Peninsula. The region within black rectangle in the inset map corresponds to the enlarged map. Samples for location 13 to 17 were obtained from García-Morales and Elías-Gutiérrez (2013). Pie charts represent mitochondrial lineages (Fig. 3) found at each sampling locality.
Species delimitation: The number of putative cryptic species based on COI gene sequences ranged from seven to 13 (Table 2, Fig. S1). The ABGD method discriminated seven, the GMYC method revealed 11 putative species (confidence interval: 5-13, likelihood ratio: 11.15828, LR test: 0.00377), whereas SP and PTP methods delimited 13 putative species (Fig. S1). For 18S rRNA, estimates of putative species ranged from one to four (Table 2, Fig. S1). Statistical Parsimony revealed a single species, whereas the PTP model delimited four putative species. The GMYC model found three putative species (Table 2, Fig. S1) (confidence interval: 1-5, likelihood ratio: 0.23773, LR test: 0.88792). The concatenated dataset detected similar number of putative species as the COI analyses, with exception of those samples in which 18S sequences were not available.
The species tree analyses reveal that the most supported hypothesis is that of 18S rRNA that supports the presence of three putative species with high branch support > 95 % (see Fig. 2). We called these three putative species BqI, BqII and BqIII (see Fig. 2 and Fig. 4). For the six putative species hypothesis (see Fig. 3 and Fig. S2), the branch support was < 75 % for some of the branches (Fig. S2).
TABLE 2: Results of the different species delimitation methods conducted on Brachionus quadridentatus
| Method | COI | 18S | Concatenated |
| SP | 13 | 1 | 8 |
| PTP | 13 | 4 | 10 |
| GMYC | 11 (5-13) | 3 (1-5) | 9 (7-13) |
| ABGD | 7 | NA | NA |
NA means that the test cannot be performed on the dataset
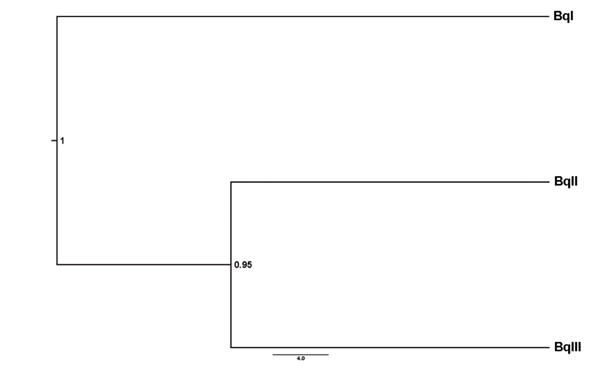
Fig. 2 Species tree for the Brachionus quadridentatus complex based on 18S gene sequences. Tree was obtained through a multispecies coalescent model using the *BEAST v.2.0. Posterior probabilities are shown at each node.
Phylogenetic relationships and specimen identification: The mtDNA trees produced by BI and ML were identical for all the analyses. The mitochondrial COI gene retrieved seven major lineages (A-G) which are genetically divergent (> 10 %) (Fig. 3). Lineage A was formed by only one individual from Charco 1 (Fig. 3, see also Fig. S3). Lineage B is represented by 20 samples from four locations (La Colorada, La Vega, Vernet and Parque Ecológico) (Fig. 3). Lineage C includes eight samples from La Zarcita spring, being the sister group with high support of the lineage D. Lineage D includes 43 samples from six locations (Escondida, La Zarcita, Uranden, Magdalena, La Colorada and Yuriria) (Fig. 3). Lineage E form a group composed by 11 specimens in one haplotype from La Joya Maar Lake. Finally, two genetically divergent lineages, F and G are sister clades. The lineage F that includes 58 samples from Cuitzeo and Lerma and the lineage G that is represented by 35 specimens collected in five locations (Atotonilco, Ixtlahuaca, Vernet, El Rosario and Teremendo) (Fig. 3). Uncorrected p distances for mtDNA gene within the seven lineages ranged from 0-3.1 %, whereas, pairwise distances among the seven lineages ranged from 12-18 % (Table S3).
All specimens belonging to the lineages F and G were identified as B. quadridentatus f. cluniorbicularis, and all individuals of lineage B were identified as B. quadridentatus quadridentatus. Lastly, lineages A, C, D, and E were identified as B. quadridentatus f. brevispinus (Fig. 3). In addition, seven clearly morphologically differentiated groups were found. These morphogroups were congruent with the seven lineages found based on COI gene sequences (Fig. 3). Within all the specimens identified as the brevispinus form we found four different morphotypes, which belong to the COI lineages A, C, D and E. Moreover, with the specimens identified as the cluniorbicularis form we discriminated two morphotypes, which are coincident with the COI lineages F and G.
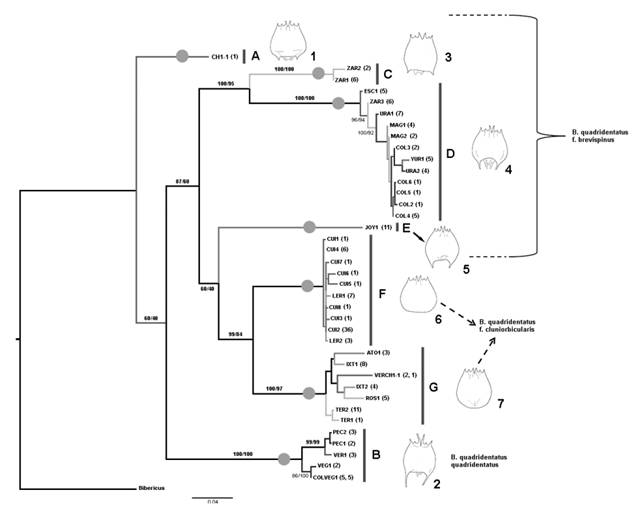
Fig. 3 Bayesian Inference phylogram of the COI gene showing the relationship of the 38 Brachionus quadridentatus haplotypes. Haplotype names are indicated by the acronym of the water body in which they were collected and are in accord with names in Table 1. Number after name corresponds to the number of samples within each haplotype. Numbers on major branches are the percentages of branch support in the Bayesian and maximun-likelihood analyses, respectively. Different morphotypes are drawn in front of their corresponding sequences. Gray circles on branches indicate the putative species discriminated in the ABGD analysis for the COI gene. A sequence of B. ibericus (accession GQ894740) was used as outgroup.
The topologies reconstructed by BI and ML methods for the 18S gene were identical and revealed a polytomy comprising three lineages that we called BqI, BqII and BqIII (see above) (Fig. 4). Percentages of uncorrected distances among the three ribosomal lineages ranged from 0.3-0.5 %. Lineage BqI is formed for all specimens identified as B. quadridentatus f. cluniorbicularis and include the mitochondrial lineages F and G. Lineage BqII was identified as B. quadridentatus f. brevispinus and is concordant with the mitochondrial lineage E. Finally, lineage BqIII encompasses all specimens belonging to lineages B, C, and D in mtDNA analyses. This latter lineage is a mix of specimens identified as B. quadridentatus quadridentatus and B. quadridentatus f. brevispinus (Fig. 4).
In the concatenated analyses, the topologies reconstructed by BI and ML were also identical, revealing the same lineages as the mitochondrial gene analyses (see Fig. 3 and Fig. S4), but with some differences in relationships of the lineages B and E compared to the mtDNA phylogenetic analyses. The lineage A is absent due the lack of sequences for the 18S gene (Fig. S4).
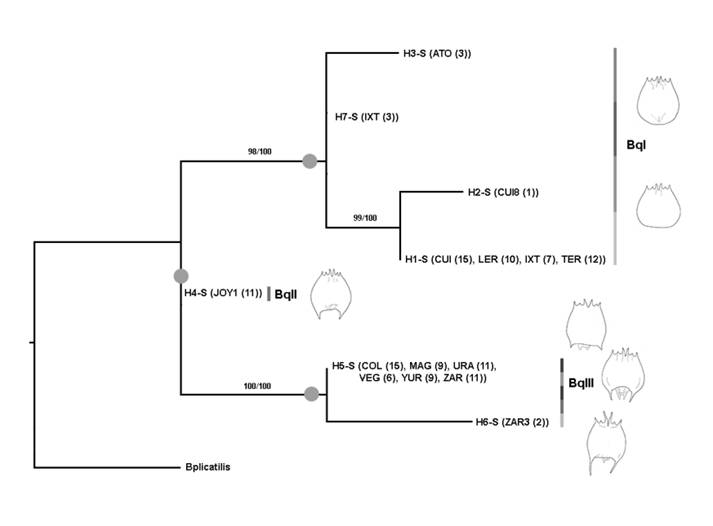
Fig. 4 Bayesian Inference phylogram of the 18S gene showing the relationship of the seven Brachionus quadridentatus haplotypes. Haplotypes are accompanied between parentheses by the water system(s) in which they were collected and the number of haplotypes within each location. Numbers on branches are the percentages of branch support in the Bayesian and maximun-likelihood analyses, respectively. Gray circles on branches indicate the putative species discriminated in the coalescent species tree and GMYC analyses for the 18S rRNA gene. A sequence of B. plicatilis (accession U29235) was used as outgroup.
Morphological differences between the seven lineages based on COI gene sequences include the length, width, and shape of lorica, length and shape of the caudal spines, length of median anterior spines, shape of foot opening, and size. Specimens from lineage B are the larger in size than specimens from other lineages. Also lineage B presents median anterior spines and caudal spines longer than the other lineages (Fig. 3, Table S4). Specimens from lineage C are smaller than lineages D and E. Length of the median anterior spines in lineage C are similar to those in lineages D and E, but the caudal spines in lineage C are shorter than the other lineages (Fig. 3, Table S4). In lineage C the body shape is barrel-like with the caudal spines directed outward. Specimens from lineages D and E are similar in size and in the length of the median anterior spines, but differ in body width, with lineage E being wider than lineage D (Fig. 3, Table S4). Caudal spines in lineage D are slightly longer than in lineage E, and their base is narrower than the base of the spines in lineage E (Fig. 3). Lineage D and E also differ in the shape of the foot opening and posterior margin of the lorica. In lineage D the foot opening has two terminal spines of the same size and width, whereas in lineage E the two spines are of different sizes and one is wider. Also in lineage D the posterior margin of the lorica is more concave than in lineage E. Lineage F and G have no caudal spines. Specimens in lineage G are larger and wider than specimens in lineage F. Length of the median anterior spines are similar in lineage F and G. Posterior margin of the lorica in lineage G is rounded in its distal part whereas in lineage F the lorica is rounded laterally and almost straight in its postero distal part (Fig. 3).
Genetic diversity and differentiation: Haplotype diversity (Hd) and nucleotide diversity (π) for most locations were low, with the exception of La Colorada Lake (Hd = 0.810 and π = 0.08757) (Table 1). The Hd and π of the mtDNA lineages B, D and G were high, whereas for the lineages C and F were low (Table S5). Lineage E has only one haplotype in 11 sequences. The haplotype and nucleotide diversity in the 18S rDNA lineages BqI and BqIII were low: Hd = 0.253, π = 0.00050 and Hd = 0.062, π = 0.00016, respectively. AMOVA indicated a high level of genetic differentiation for the seven lineages found in the COI phylogenetic analyses for B. quadridentatus complex (F ST = 0.9819, F CT = 0.8602, P < 0.00) (Table S6). The Mantel test did not show correlation between genetic distances and geographic distances among mtDNA lineages (r = 0.0882, p = 0.5846), thus providing no evidence for an isolation by distance pattern in the B. quadridentatus complex.
Discussion
Despite the economic, evolutionary and ecological importance of the Brachionus genus its systematics and taxonomy remains unclear (Segers, 2007). This is true for B. quadridentatus, where its high level of phenotypic variation confuses the taxonomy of the taxon (Segers, 2007). Our study demonstrates that morphology-based taxonomy is not effective at providing an accurate assessment of the diversity of B. quadridentatus. Based upon the results of analysis of the 18S gene at least three putative species exist within B. quadridentatus, however as many as seven species may be present based upon the results of analysis of the COI gene and morphological analysis. Analyses of a larger number of molecular markers as well as breeding and ecological studies will be required to further resolve the taxonomy of B. quadridentatus in this study region. In the case of the B. plicatilis species complex, accompanying the morphology-based taxonomy with the use of two or more molecular markers has been demonstrated to be a more reliable approach to delimit species than use of morphology alone (Fontaneto, Flot, & Tang, 2015; Mills et al., 2017).
Using morphology-based taxonomy, we clustered all the sequenced specimens into three recognized morphological variants: B. quadridentatus quadridentatus (long spines), brevispinus form (short spines) and as cluniorbicularis form (without spines). For the first putative species (BqI) identified by GMYC (Fig. S1) and species tree analyses (BqI lineage in 18S Fig. 2), all the 51 specimens belonging to the group lacking spines. Therefore, these specimens were identified as B. quadridentatus f. cluniorbicularis. This morphotype without spines was exclusive to this lineage (Fig. 4), showing congruence between the genetic and morphological approaches despite the high geographic distance among sampling location. In the case of BqII, that was identified as a putative species in the GMYC and species tree analyses (Fig. 2, Fig. 4 and Fig. S1), all 11 specimens were identified as B. quadridentatus f. brevispinus. However, this morphotype with short spines was also found in some specimens belonging to the BqIII lineage. It is noteworthy that specimens from BqIII had differences in the body shape, length of the anterior and caudal spines and shape of the foot opening. The lineage BqIII in 18S tree (Fig. 4), also delimited as a putative species by the GMYC (Fig. S1) and species tree analyses (Fig. 2), is represented by 52 specimens with short spines, thus classified as B. quadridentatus f. brevispinis and 11 with long spines identified as B. quadridentatus quadridentatus. As such, this putative species is a mixture of morphotypes.
Although the most conservative result found in the 18S gene was three putative species within each of those putative species, there was genetic variation in the COI gene and morphological differentiation. The 18S gene is therefore not suitable to delimit species within the B. quadridentatus species complex, as this gene underestimates diversity (Tang et al., 2012). We found seven morphotypes that display clear diagnostic morphological differences (e. g. length of the median anterior and posterior spines, body shape and shape of the foot opening) (Fig. 3). However, using morphological features alone to differentiate groups has been demonstrated to be problematic. This is especially true of animals that exhibit few morphological attributes as is the case of the B. plicatilis species complex (Mills et al., 2017) and meiofaunal Pontohedyle slugs (Jörger et al., 2012), or that are morphologically plastic (due cyclomorphosis and predators), for instance corals (Ow & Todd, 2010), and the rotifers Euchlanis dilatata, Brachionus havanaensis and Keratella cochlearis (Koste & Shiel, 1989; García-Morales & Elías-Gutiérrez, 2013; Cieplinski et al., 2017). Thus, accompanying morphology-based taxonomy with the use of molecular markers has been demonstrated to be a more reliable approach to identify such diversity (Fontaneto et al., 2015; Mills et al., 2017). Accordingly, in the phylogenetic analysis, ABGD and AMOVA based on COI gene sequences, we also found seven monophyletic lineages that are divergent.
The uncorrected genetic distances calculated among the seven lineages and morphologic variants of the B. quadridentatus species complex are high (12-18 %) in comparison with distances known in other animals (Hebert, Cywinska, Ball, & De Waard, 2003), exceeding the values usually found between congeneric species (Gómez et al., 2002). These genetic distances are similar to the values found between distinct species within the related B. plicatilis (12-23 %, Gómez et al., 2002; 11.9-23.2 %, Mills et al., 2017) and the B. calyciflorus species complexes (9-13 %, Gilbert & Walsh, 2005; 11-22 %, Xiang, Xi, Wen, Zhang, & Ma, 2010; 10.4-26.8 %, Xiang et al., 2011). Moreover, the seven observed morphotypes and monophyletic lineages are congruent. Therefore, we propose the existence of seven putative species within B. quadridentatus from Mexico based on the COI gene and morphological data.
In addition, we compared our COI sequences from Mexico with 23 COI sequences of B. quadridentatus from other parts of the world (Iberian Peninsula, United Kingdom and China) deposited in GenBank (see accessions in Table S7) to determine if they are similar or not. We found that sequences from Iberian Peninsula, United Kingdom and China formed five independent lineages. Genetic distances among these five COI lineages and our seven COI lineages ranged from 13-24 %. Thus increasing the number of putative species in B. quadridentatus. Only five sequences from the Iberian Peninsula reported by Moreno et al. (2017) fell within mitochondrial lineage G of this study (see Fig. S5).
We found evidence for phylogenetic mitonuclear discordance between the mitochondrial COI and the nuclear 18S genes, as the nuclear marker revealed fewer putative species than mitochondrial marker. Other studies of rotifers have also reported varying levels of mitonuclear discordance. COI and ITS1 markers in the B. calyciflorus species complex, shown a high level of discordance (Papakostas et al., 2016), and the Keratella cochlearis, Polyarthra dolichoptera and Synchaeta pectinata species complexes presented intermediate levels of mitonuclear discordance among the same genetic markers (Obertegger et al., 2018). By contrast, in the B. plicatilis species complex a complete mitonuclear concordance between the COI and ITS1 markers was found (Mills et al., 2017). The mitonuclear discrepancies reported in these previous studies have been attributed to processes such as hybridization or incomplete lineage sorting (Papakostas et al., 2016; Obertegger et al., 2018). However, it has also been reported that mitonuclear discordance may be attributed to other factors such as horizontal gene transfer, androgenesis and unresolved phylogenetic polytomies (Obertegger et al., 2018). In our study, phylogenetic analyses conducted on the 18S gene recovered a polytomy. However, we suggest that incomplete lineage sorting is the most likely cause of the mitonuclear discordance observed in our work. This is because differentiation has not been completed in the nuclear gene (18S) and therefore nuclear lineages share haplotypes, retaining ancestral polymorphism. There are lineages living in sympatry (COI lineages: A and G, B and D, B and G) but there is not evidence that hybridization has occurred. Future research will be needed to determine what process is responsible for the mitonuclear discordance observed in the B. quadridentatus species complex by the sequencing of a greater number of molecular markers.
Currently two explanations for the geographic patterns observed in zooplankton species have been outlined in the literature. Firstly, the high dispersal capacity of resting eggs allows high levels of gene flow across large areas resulting in widely separated areas with similar haplotypes and morphotypes. In this case, zooplankton displays little or no geographic structure (Xiang et al., 2010). Long-distance dispersal and colonization of distant habitats, even transcontinental, have been recorded in several zooplankton taxa (De Gelas & De Meester, 2005; Mills et al., 2007; Campillo et al., 2011). Secondly, a rapid adaptation of resident populations to local environmental conditions after a historical colonization event reduces effective gene flow among populations, and cause high levels of genetic differentiation and population subdivision (De Meester, Gómez, Okamura, & Schwenk, 2002).
High dispersal and colonization capacity are evident in B. quadridentatus populations investigated in this study. This is demonstrated by the presence of highly divergent haplotypes and morphotypes within La Colorada, La Zarcita, Vernet and Charco 1 locations (Fig. 1, Fig. 3), which contain specimens belonging to different lineage separated by > 18 mutation steps and that are also morphologically differentiated. This pattern can be explained as a secondary contact between distinct lineages. Other examples that may have stemmed from high dispersal capacity in the group are the presence of specimens showing little genetic and morphological differences within the lineages B, D and G (see Fig. 3, Table S1), but separated by large distances and biogeographic barriers. For example, the most widespread lineage was G, encompassing north, central and southeast Mexico and unexpectedly also found in the Iberian Peninsula (see Fig. S5). Closely genetic and morphologically related haplotypes in lineage G were collected in El Rosario, Baja California and Charco 1, Tabasco, locations that are separated by distances > 1900 km. This suggests a high colonization and adaptation ability of the lineages. A similar scenario was also found in the B. calyciflorus species complex (Xiang et al., 2010), in which wide geographic distribution from one of the cryptic species was attributed to its high capacity for adaptation and colonization of several habitats in East China (Xiang et al., 2010).
In the present study, mitochondrial analysis recovered seven (A-G) deeply divergent lineages, which also exhibited exclusive haplotypes and morphotypes. This may suggests a low level of gene flow among the seven lineages, even between those found in the same water body. Therefore, the high level of genetic structure and the high number of private haplotypes suggests a history of geographic isolation between these lineages. In addition, the high level of genetic differentiation among lineages was not related to the geographic distance with some highly divergent lineages found in geographic proximity. In this case other factors may influence the genetic differentiation among lineages of B. quadridentatus. Similarly, several molecular surveys conducted on rotifers, including Brachionus, Synchaeta and Euchlanis have found high levels of genetic differentiation despite high dispersal ability of the studied species (Gómez et al., 2000; 2002; Xiang et al., 2010; Obertegger, Fontaneto, & Flaim, 2012; Kimpel et al., 2015; Kordbacheh et al., 2017).
For instance, the lineages E and F, which contain specimens from La Joya and Cuitzeo Lakes, respectively, have a high genetic and morphological differentiation with respect to other lineages. These lineages are separated by < 50 km from other highly divergent lineages, thus the observed differentiation is unlikely to be due to dispersal limitations. La Joya and Cuitzeo Lakes display salt levels up to 5 g/L (Sarma, Nandini, Morales-Ventura, Delgado-Martínez, & González-Valverde, 2006), therefore having very distinct environmental conditions from other studied water bodies. Cuitzeo is the second largest lake in Mexico (± 400 km2), and despite the high number of samples collected all around the lake, it is surprising that only one genetic and morphotype group with low genetic diversity was found. This could be explained by founder effects and local adaptation to the environmental conditions of the lakes as has been shown in other studies (e. g. Ishida & Taylor, 2007; Xiang et al., 2010). In addition, the haplotype and nucleotide diversity (Table 1), as well as the star like shape of the haplotype network of the Cuitzeo Lake (Fig. S6), suggest that population experienced a bottleneck with a subsequent expansion. Past bottleneck events and subsequent range expansions have also been documented for other zooplankton taxa (Ishida & Taylor, 2007; Crease, Omilian, Costanzo, & Taylor, 2012).
In summary, this is the first study conducted on the littoral rotifer B. quadridentatus integrating molecular data from COI and 18S genes to examine cryptic diversity in this taxon. The diversity delimited in our study was higher in the mitochondrial COI gene than the nuclear 18S gene, thus providing evidence of mitonuclear discordance. This incongruence might be due to differences in mutation rate between markers, resulting in incomplete lineage sorting. Results from analysis of the COI gene along with the morphotypes observed here support the existence of seven putative species. Moreover, five additional COI lineages were found from sequences obtained from Europe and China (Table S7). Therefore the results presented herein support B. quadridentatus as a species complex with a high diversity comparable to that of the B. plicatilis and B. calyciflorus species complexes. Integrative taxonomic frameworks, including additional nuclear markers, as well as morphological, reproductive, and ecological analyses including samples from all over the world are needed in order to assess the species richnes, species boundaries and mechanisms driving the speciation in B. quadridentatus.

