


 Inglés (pdf)
 Articulo en XML
 Referencias del artículo
 Enviar articulo por email
 Citado por SciELO
  Similares en
SciELO
Similares en
SciELO  uBio
uBio 
 Permalink
Introduction
Barilius bendelisis (Hamilton, 1807) commonly called as “Indian hill trout” is a member of the family Cyprinidae that occurs in shallow and cold waters of rivers and streams of the Himalayan region, northeastern India and several parts of Uttarakhand. This fish species is considered a fishery resource and also is found in the lentic and lotic water bodies where the exotic carp (Cyprinus carpio and Hypophthalmichthys molitrix) and Indian major carp (Labeo. rohita, L. calbasu, L. bata, Cirrhinus miragla and C. reba) cannot be raised successfully (Sahoo, Saikia, & Das, 2009).
Barilius bendelisis reaches a maximum length of 22.7 cm and is characterized by dark blue bars on the body, an elongated and compressed body and a dorsal fin inserted posterior to the mid length of the body (Rahman, 1989). Adults of Barilius bendelisis inhabit base hills streams and rivers with pebbles at bottom (Talwar & Jhingran, 1991; Menon, 1999). As per IUCN (2012) the species has been placed as least concerned but in the future anthropogenic activity, causing habitat destruction and over exploitation are the main threats to this species. The overuse of B. bendelisis in the rural fishing and aquarism is negatively impacting on its populations in the Himalayan region in the last years (Sah, Barat, Pande, Sati, & Goel, 2011). The species is mainly identified by means of morphological features, which sometimes are not useful to correctly identify all the existing populations because of its inherent high variability (Victor, Hanner, Shivji, Hyde, & Caldow, 2009).
Interspecific variation shown by using COI barcodes in several studies is higher as compared to the intraspecific variation (Hubert et al., 2008; Rock, Costa, & Walker, 2008; Swartza, Mwalea, & Hanner, 2008; Steinke, Zemlak, & Hebert, 2009; Ward, Hanner, & Hebert, 2009). The present study aimed at to compare and illustrate morphometrics and molecular characters of Barilius bendelisis from the two geographically isolated tributaries of Alaknanda and Chenab Rivers.
In spite of high aquaculture scope, very limited morphometric and molecular studies have been conducted for this fish species. The Truss Network Analysis overcomes the disadvantages of manual morphometry and this method produces a more systematic geometric characterization of fish shape and describes inter-specific shape differences with high resolution (Humphries et al., 1981; Strauss & Bookstein, 1982). Molecular characterization supports morphometric analysis. Therefore, the present study was designed to characterize and compare the fish morphometrically and at molecular level from two isolated rivers of Western and Central Himalaya.
Materials and methods
Collecting and identification of samples
The Chenab River is the largest tributary of the Indus River of Western Himalaya while the Alaknanda River is the largest tributary of Ganga River of Central Himalaya. Fresh specimens of B. bendelisis were captured using various fishing gears (cast nets, gill nets and traditional Thali method) with the help of local fishermen from March 2015 to April 2017. A total of 267 specimens were collected from three different tributaries of the Chenab River Jhajjar, Dhudhar and Jhuni and 300 specimens were collected from other three tributaries of the Alaknanda River: Dugadda, Khankhra and Khandah Gad (Table 1). All the specimens were collected before the breeding season and after the spawning season. A solution of 10 % of formalin was utilized to fix and preserve the collected samples that were morphometrically analysed. Some samples were stored in 95 % ethanol to perform the DNA analysis. The captured specimens were identified with the help of taxonomic keys of Day (1878), Talwar and Jhingran (1991), Mirza (1991), and Kullander, Fang, Delling, and Ahlander (1999). The present specimens of B. bendelisis were deposited in the museum of the Department of Zoology and Biotechnology, HNB Garhwal University, Srinagar (Garhwal).
TABLE 1 GPS coordinates and number of samples of Barilius bendelisis collected from the Indian Himalaya
| Variables | Sampling sites | |||||
|---|---|---|---|---|---|---|
| Alaknanda River (Central Himalaya) | Chenab River (Western Himalaya) | |||||
| Dugadda | Khankhra | Khandah | Dhudhar | Jhajjar | Jhuni | |
| Latitude °N | 30°15'31'' | 30°14' 32'' | 30°11'47'' | 32°55' 15'' | 32°52' 25'' | 32°53' 51'' |
| Longitude °E | 78°43'7.89'' | 78°55' 36'' | 78°46' 34'' | 75°01' 42'' | 74°59' 54'' | 74°57'17'' |
| Number of samples collected | 98 | 94 | 108 | 91 | 89 | 87 |
Morphological analysis
Digitalization of specimens: The specimens were firstly cleaned in running water, soaked by blotting paper and then placed on a flat platform with graph paper as background for digital images. To make the insertion points visible, the fins were erected and each individual was labelled with a specific code for own identification. Photographs were taken by means of a digital camera of (Nikon D3400). To avoid errors during the image capture, all photographs were taken by a single person from the same angle and height.
Truss analysis: A set of three software platforms, tpsUtil, tpsDig2 v2.1 (Rohlf, 2006) and Paleontological Statistics (PAST) (Hammer, Harper, & Ryan, 2001) was used to measure the truss distances of the digital images. The truss analysis was based on 14 landmarks (Fig. 1) (Strauss & Bookstein, 1982; Mir, Sarkar, Dwivedi, Gusain, & Jena, 2013).
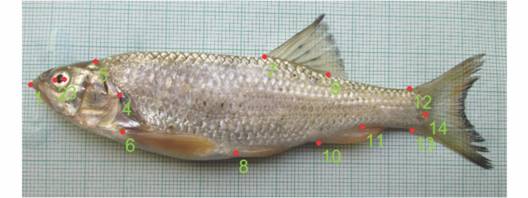
Fig. 1 Schematic image of B. bendelisis showing the 14 landmarks used to compare among the populations. 1 tip of snout; 2 anterior border of eye; 3 posterior border of eye; 4 posterior border of operculum; 5 forehead (end of frontal bone); 6 pectoral fin origin; 7 dorsal fin origin; 8 pelvic fin origin; 9 dorsal fin termination; 10 origin of anal fin; 11 termination of anal fin; 12 dorsal side of caudal peduncle, 13 ventral side of caudal peduncle; 14 termination of lateral line.
Statistical procedures: Size dependent variation was conducted by using an allometric method suggested by Elliott, Haskard, and Koslow (1995) as “Madj = M (Ls/L0)b”, where M is original measurement, Madj is the size adjusted measurement, L0 is the standard length of the fish, Ls the overall mean standard length, and b was estimated for each character from the observed data as the slope of the regression of log M on log L0 using all fish from every group. The significance of the correlation between transformed variables and standard length was tested using SPSS and the results derived from the allometric method were confirmed (Turan, 1999). Ninety morphometric characters were subjected to a univariate analysis of variance (ANOVA) to compare the populations of the different sampled sites of B. bendelisis. Then the significant variables (P<0 .05) were subjected to Factor analysis. A maximum likelihood method was used to extract the factors. The cumulative variance explained by the factors and loading of significant traits were retained. The retained factors were subjected to varimax rotation procedure to identify the variables demonstrating high loading for a given factor as described by Hatcher (1994). The Wilks  was used to compare the difference between all groups. Additionally, the significant measurements were also subjected to the discriminant function analysis (DFA) to calculate percentage of correctly classified fish. Statistical analysis for morphometric data were performed using the SPSS vers.20 and Microsoft Excel 2007.
DNA analysis
Isolation of DNA, amplification and sequencing: Approximately 50 mg tissue was used for genomic DNA isolation following Phenol-Chloroform -Isoamyl alcohol method of Sambrook Fritsch, and Maniatis (2001). Genomic DNA quality was checked using 0.8 % agarose gel electrophoresis (Genei, Banaglore) while the qualitative and quantitative estimation was done by observing the bands in ultraviolet light on UV transilluminator (BioRad, USA) with UV shield and UV protective goggles. The genomic DNA was stored at -20 ºC for future use. The mitochondrial gene cytochrome c oxidase subunit I (COI) was amplified with primers FishF1-CGTATTTTTTGCTTGAGCCG and FishR-AATAAGCCCAAACCCGGGAA in a 50 ml volume with 100 ng template DNA, 10 pmol of each specific primer, 250 mM of each dNTPs, 1.0 U of Taq DNA polymerase and 1_Taq buffer containing 1.5 mM MgCl2. The PCR conditions were consisted of initial denaturation at 95 ºC for 3 minutes, 30 cycles, cycle denaturation at 95 ºC for 20 seconds, cycle annealing at 47 ºC for 20 seconds, cycle extension at 72 ºC for 45 seconds, final extension at 72 ºC for 10 minutes. To visualize the PCR products after that, a 1.2 % agarose gel was used, the amplicons were purified and sequenced in both directions commercially in automated genetic analyzer ABI 3730 (Applied Biosystem, Carlsbad, CA) following Bigdye terminator v.1.1 cycle Sequencing Kit (Applied Biosystem, Carlsbad, CA). Simplicity and un-ambiguity were observed among the sequences of the mitochondrial region. A total of 18 sequences of COI gene of B. bendelisis were analysed as follow: nine samples were obtained from the three collecting sites at the Chenab River and nine samples were obtained from the other three sites at the Alaknanda River. The sequences were submitted to the NCBI Genbank having accession number MF445031, MF445032, MF445033, MF445028, MF445029, MF445030, MF445034, MF445035, MF445036 for B. bendelisis of Chenab River and MG797659, MG797660, MG797661, MG797662, MG797663, MG797664, MG797665, MG797666, MG797667 for B. bendelisis of Alaknanda River.
Sequence analysis: the raw sequences were initially trimmed and aligned using the Clustal W (Thompson, Gibson, Plenwniak, Jeanmougin, & Higgens, 1997). The COI sequence confirmation was carried out using BLAST program of NCBI.
Estimation of Genetic distance and Phylogenetic relationship
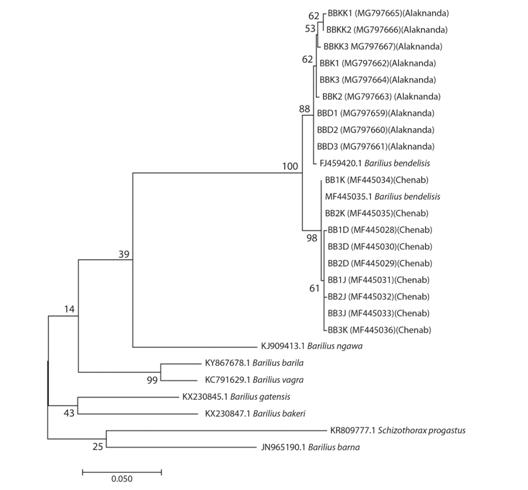
The number of polymorphic sites (including the number of constant, variables, and parsimony informative sites) and nucleotide composition were determined by DnaSpver 3 (Rozas & Rozas, 1999). The sequence divergence, determination of pairwise evolutionary distance among haplotype and Maximum likelihood tree was constructed by using MEGA 6.0 (Tamura, Stecher, Peterson, Filipski, & Kumar, 2013). Maximum likelihood tree with bootstrap value 100 was constructed on the basis of COI data and taking some other sequences of genus Barilius (Barilius ngawa KJ909413.1, Barilius barna JN965190.1, Barilius gatensis KX230845.1, Barilius bakeri KX230847.1, Barilius barila KY867678.1, Barlius vagra KC791629.1, Barilius bendelisis MF445035, Barilius bendelisis FJ459420 and Schizothorax richardsonii KR809777) from NCBI- GenBank just to increase the resolution among the species.
Results
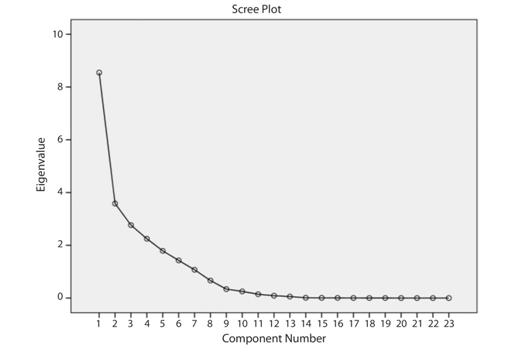
Ninety variables were obtained from the14 landmarks using the truss analysis (Fig. 1). The ANOVA for 90 parameters extracted 23 significant characters (P < 0.05). Principal component analysis of 23 truss measurements extracted 7 factors with eigen-value > 1, explaining 93.15 % of variance (Fig. 2). The first principal component (PC1) accounted for 37.11 % of variation followed by PC2 15.57 %, PC3 12.02 %, PC4 9.7 %, PC5 7.77 %, PC6 6.20 % and PC7 4.65 % are shown in Table 2 and their loadings are shown in Table 3.
TABLE 2 Total variance explained on the basis of PCA
| Component | Initial Eigen values | Extraction sums of squared loadings | ||||
|---|---|---|---|---|---|---|
| Total | % of variance | Cumulative % | Total | % of variance | Cumulative % | |
| PCA1 | 8.546 | 37.1555 | 37.1555 | 8.546 | 37.115 | 37.115 |
| PCA2 | 3.582 | 15.575 | 52.730 | 3.582 | 15.575 | 52.730 |
| PCA3 | 2.765 | 12.020 | 64.750 | 2.765 | 12.020 | 64.750 |
| PCA4 | 2.247 | 9.769 | 74.519 | 2.247 | 9.769 | 74.519 |
| PCA5 | 1.789 | 7.777 | 82.296 | 1.789 | 7.777 | 82.296 |
| PCA6 | 1.426 | 6.201 | 88.497 | 1.426 | 6.201 | 88.497 |
| PCA7 | 1.070 | 4.654 | 93.151 | 1.070 | 4.654 | 93.151 |
TABLE 3 Extracted principal components with significant loadings
| Component | |||||||
| PC 1 | PC 2 | PC 3 | PC 4 | PC 5 | PC 6 | PC 7 | |
| VAR 1-2 | -0.796 | .516 | -.179 | .037 | .039 | -.044 | .103 |
| VAR 1-3 | -0.802 | .528 | -.106 | .041 | .021 | -.063 | .108 |
| VAR 1-4 | -0.798 | .500 | .102 | .056 | -.034 | -.015 | .084 |
| VAR 1-5 | -0.654 | .518 | .008 | .108 | -.050 | .110 | .197 |
| VAR 1-6 | -0.565 | .131 | .644 | .202 | -.241 | .290 | -.132 |
| VAR 1-7 | -0.232 | .381 | .339 | -.293 | -.086 | -.385 | .031 |
| VAR 1-9 | 0.092 | .259 | .397 | -.262 | .802 | .202 | .023 |
| VAR 1-10 | 0.011 | .193 | .456 | .561 | .120 | -.583 | -.256 |
| VAR 1-11 | 0.325 | .807 | -.162 | .386 | -.030 | .192 | -.088 |
| VAR 1-13 | 0.201 | -.069 | .260 | .572 | .068 | -.058 | .731 |
| VAR 2-6 | -0.192 | .034 | .697 | .213 | -.289 | .502 | -.132 |
| VAR 2-7 | 0.110 | .138 | .413 | -.257 | .841 | .132 | -.011 |
| VAR 2-9 | 0.578 | .425 | .408 | -.444 | -.286 | -.060 | .108 |
| VAR 2-10 | 0.488 | -.080 | .475 | .458 | .085 | -.475 | -.253 |
| VAR 2-11 | 0.792 | .438 | -.076 | .258 | -.031 | .249 | -.095 |
| VAR 2-13 | 0.700 | -.374 | .242 | .280 | .007 | .043 | .464 |
| VAR 2-14 | 0.814 | -.476 | .121 | -.138 | -.030 | .109 | -.044 |
| VAR 3-9 | 0.618 | .393 | .377 | -.443 | -.290 | -.055 | .099 |
| VAR 3-11 | 0.816 | .394 | -.094 | .240 | .006 | .253 | -.102 |
| VAR 4-9 | 0.785 | .264 | .242 | -.353 | -.225 | -.089 | .055 |
| VAR 4-11 | 0.871 | .222 | -.199 | .250 | .013 | .162 | -.120 |
| VAR 6-9 | 0.654 | .492 | -.224 | -.279 | -.021 | -.270 | .132 |
| VAR 6-11 | 0.652 | .401 | -.544 | .205 | .192 | -.074 | -.003 |
In the DFA five discriminant functions (DFs) were obtained. The first discriminant function accounted for 48.3 %, second, third, fourth and fifth discriminant functions accounted for 24.3, 17.7, 6.5 and 3.1 % of the total variance respectively (Table 4). The DF1 vs DF2 plot explained variance among the samples and formed six groups. Group 1, 2, 3 from the Alaknanda River and group 4, 5, 6, from the Chenab River. The plot shows that these groups are clearly separated towards left and right showing their isolation. However, the group 4, 5, 6 from the Chenab River shows resemblance with the group 2 of the Alaknanda River (Fig. 3). The results obtained from the truss-based morphometrics indicated that the B. bendelisis have phenotypic heterogeneity between the two geographically isolated rivers of the Western and Central Himalayan regions. Individual’s classification into their original population varied between 79.1 and 92.6 % by discriminant function analysis being highest in the Khankhra gad drainage, a tributary of the Alaknanda River. In total 83.8 % of the examined individuals could be classified into their original groups (Table 5).
TABLE 4 Total variance explained on the basis of DFA
| Component | Eigen value | % variance | Cumulative % | Canonical correlation |
|---|---|---|---|---|
| DFA1 | 2.995a | 48.3 | 48.3 | 0.866 |
| DFA2 | 1.507a | 24.3 | 72.6 | 0.775 |
| DFA3 | 1.099a | 17.7 | 90.4 | 0.724 |
| DFA4 | .404a | 6.5 | 96.9 | 0.536 |
| DFA5 | .193a | 3.1 | 100 | 0.402 |
TABLE 5 Percentage of specimens in each group and their percentage after cross validation for morphometric measurements of Barilius bendelisis from two rivers across Indian Himalaya
| Sampling sites | Predicted group membership | ||||||||
| Alaknanda River | Chenab River | ||||||||
| Dugadda | Khankhra | Khandah | Dudhar | Jhajjar | Jhuni | Total | |||
| Dugadda | 81 | 6 | 7 | 0 | 3 | 1 | 98 | ||
| Khankhra | 2 | 87 | 4 | 0 | 1 | 0 | 94 | ||
| Khandah | 8 | 4 | 90 | 0 | 6 | 0 | 108 | ||
| Dudhar | 0 | 0 | 0 | 72 | 11 | 8 | 91 | ||
| Jhajjar | 0 | 3 | 0 | 10 | 74 | 2 | 89 | ||
| Jhuni | 0 | 3 | 0 | 12 | 1 | 71 | 87 | ||
| Cross validated results (%) | |||||||||
| Dugadda | Khankhra | Khandah | Dudhar | Jhajjar | Jhuni | Total | |||
| Dugadda | 82.7 | 6.1 | 7.1 | 0.0 | 3.1 | 1.0 | 100.0 | ||
| Khankhra | 2.1 | 92.6 | 4.3 | 0.0 | 1.1 | 0.0 | 100.0 | ||
| Khandah | 7.4 | 3.7 | 83.3 | 0.0 | 5.6 | 0.0 | 100.0 | ||
| Dudhar | 0.0 | 0.0 | 0.0 | 79.1 | 12.1 | 8.8 | 100.0 | ||
| Jhajjar | 0.0 | 3.4 | 0.0 | 11.2 | 83.1 | 2.2 | 100.0 | ||
| Jhuni | 0.0 | 3.4 | 0.0 | 13.8 | 1.1 | 81.6 | 100.0 | ||
83.8 % of original grouped cases correctly classified.
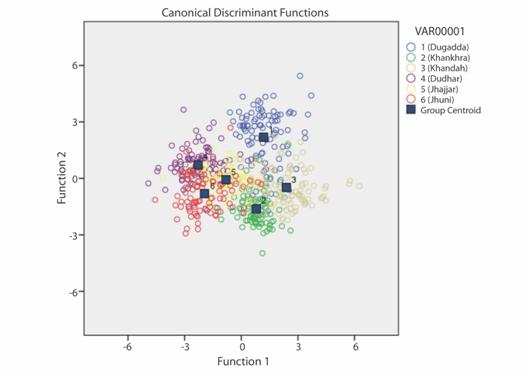
Fig. 3 Discriminant analysis plot of Barilius bendelisis from two isolated rivers of Indian Himalaya.
A cross-validation test using leave one out procedure also revealed that the samples were correctly classified into their original populations. A slight intermingling was observed among the samples of streams of the Western Himalayan River (Chenab) and Central Himalayan River (Alaknanda) (Fig. 3).
Sequence alignment resulted into 640-642 bp per sequence after exclusion of the primer sequence and equal length alignment. No insertions, deletions or stop codons were observed in any of the sequence and all the amplified sequences derive from a functional mitochondrial COI gene. The COI sequence analysis revealed average nucleotide composition in B. bendelisis from the Alaknanda River as 30.8 (T), 27.2 (C), 22.5 (A), and 19.6 (G) while 30.0 (T), 27.8 (C), 24.8 (A), and 19.9 (G) in case of B. bendelisis from the Chenab River.
COI gene revealed seven variable polymorphic sites and six parsimony informative sites in the specimens from the Alaknanda River, whereas four variable polymorphic sites and one parsimony informative site in the specimens from the Chenab River. A total of 11 different haplotypes were observed in the groups under study of B. bendelisis, six haplotypes were found among the populations from the Alaknanda River and 5 haplotypes for the population of the Chenab River, which indicate a gene flow within the tributaries of both rivers. The haplotype gene diversity Hd of the studied specimens from the Alaknanda River was higher (0.889) than that of the studied specimens from the Chenab River (0.806). A similar pattern was found for the value of nucleotide diversity (Alaknanda region = 0.00475) (Chenab region = 0.00175). In the Maximum likelihood tree, constructed on the basis of COI data and taking some other sequences of genus Barilius and Schizothorax richardsonii (Gray) from NCBI- GenBank just to increase the resolution among the species, formed two major clusters of B. bendelisis one from the Alaknanda River and other from the Chenab River (Fig. 4). The maximum value of genetic distance between the B. bendelisis of both the rivers was 0.031.
Discussion
Among vertebrates, fishes show higher degree of variation within and between populations than other vertebrates, and are more prone to environmentally induced morphological variation (Wimberger, 1992). Such variation in morphology is commonly due to isolation of populations. The results of present study also revealed that B. bendelisis have phenotypic heterogeneity between the two Himalayan Rivers (Alaknanda and Chenab) which are geographically isolated. Karakousis, Triantaphyllidis, and Economidis (1991) reported DFA to be useful method to distinguish different stocks of the some species. Mir, Saxena, Patiyal, and Sahoo (2015) analysed morphometric heterogeneity among different populations of Barilius bendelisis in four rivers from Central Indian Himalaya by applying DFA. They analysed three discriminant functions (DFs) which accounted for 98.9, 0.6 and 0.5 % of total variation for DF1, 2 & 3. of the total variation, the second discriminant function (DF II) and third discriminant function (DF III) accounted for 0.6 and 0.5 % respectively, among the populations. Whereas in the present study five discriminant functions were extracted and accounted for 48.3, 24.3, 17.7, 6.5 and 3.1 % variation respectively for DFI, 2, 3, 4 and 5.
Sajina, Chakraborty, Jaiswar, Pazhayamadam, and Sudheesan (2011) analysed stock structure of Megalaspis cordyla (Linnaeus, 1758) based on principal component analysis and reported that the first three factors together explained 81.67 % of total morphometric variation. However in the present study seven principal components were extracted and it explains 93.15 % of variance among the six populations of B. bendelisis from two Himalayan Rivers.
Hossain, Nahiduzzaman, Habiba, Mst, and Alam (2010) applied DFA and PCA on three populations of Labeo calbasu from the Jamuna, Halda and Hatchery Rivers and reported morphological discrimination among them, being attributed to the environmental factors and local migration of the fish. Khan, Miyan, and Khan (2012) also observed similar results in case of Channa punctatus from three rivers of India and concluded that environmental conditions have played a role in the movement, spatial distribution, and isolation of the fish stocks. Mir, Mir, and Chandra (2013) also pointed out that the closeness between the stocks may be due to their similar habitat attributes and environmental impacts. Some similar environmental parameters or the habitats could be the reason of closeness between the stocks. However the ecological factors were not studied in the present study. The variation in the populations of B. bendelisis of two Himalayan Rivers (Alaknanda and Chenab) is most probably because of the geographic isolation.
Two mitochondrial genes, 16S rRNA gene and the protein-coding COI genes highly conserved have been extensively studied in fish phylogenetics and have also been sequenced in various invertebrate and vertebrate taxa (Brown 1985; Bermingham & Lessios 1993; Santos, Schneider, & Sampaio, 2003; Munasinghe, Burridge, & Austin, 2004; Vinson, Grazielle, Schneider, & Sampaio, 2004; Ward, Zemlak, & Innes, 2005; Lakra, Goswami, & Gopalakrishnan, 2008). In the present study, the molecular divergence among the stocks of Barilius bendelisis was analysed with the help of COI gene which was mostly used in past studies for molecular characterization of fishes. All the studied sequences of COI in the present study were A+T rich, which was also reported earlier in fishes by Johns and Avise (1998). Sah et al. (2011) observed 8 different haplotypes among three populations of B. Bendelisis from Saryu, Kalsa and Kosi River, while in our study 11 haplotypes, (six haplotypes from the populations of Alaknanda River and five haplotypes for the population of Chenab River) were found. Sah et al. (2011) also found 17 polymorphic sites, 14 parsimony informative sites in cytochrome b gene sequences in all three populations while in our case 7 polymorphic sites and six parsimony informative sites in the specimens from the Alaknanda River whereas four polymorphic sites and one parsimony informative site in the specimens from the Chenab River were found. Maximum likelihood tree shows 9 sequences of B. bendelisis from three different streams of Alaknanda forming one cluster and 9 other sequences of same species from three different streams of Chenab River forming other cluster. Thus both morphometric and molecular data support each other, in identification and phylogeny of B. bendelisis from two isolated rivers, Alaknanda and Chenab of India. The morphometric and molecular characterization of distinct populations of B. bendelisis is an important tool for conservation management and breeding programmes.

