


 English (pdf)
 Article in xml format
 Article references
 Send this article by e-mail
 Cited by SciELO
  Similars in
SciELO
Similars in
SciELO  uBio
uBio 
 Permalink
Seagrasses are among the most productive and important coastal ecosystems in the tropics (Duarte, Borum, Short, & Walker, 2008; Nielsen-Muñoz, & Cortés, 2008). Seagrass meadows support a highly diverse community and remove nutrients (Duarte et al., 2008). They are important in food webs, as nurseries for crustaceans, finfishes and shellfishes, and they have an important role in the filtration of contaminants (Short & Coles, 2001; Short, Carruthers, Denninson, & Waycott, 2007). Seagrasses can be considered biological indicators of marine ecosystem health and water quality, especially in the vicinity of a nutrient source (Govers, Lamers, Bouma, Brouwer, & van Katwijk, 2014). Unfortunately, seagrasses have been decreasing due to human activity such as tourism, eutrophication and the growing contamination by industries, agriculture endeavors and coastal urban developments (Govers et al., 2014; Waycott et al., 2009; Orth et al., 2006). The reduction in coastal water clarity because of nutrient loading and increased sediment loads is a concerning cause of seagrass loss globally (Waycott et al., 2009; Duarte et al., 2008; Orth et al., 2006).
The Caribbean coast of Costa Rica has well developed seagrasses beds, especially in Cahuita National Park (CNP) and in Gandoca-Manzanillo National Wildlife Refuge (GMNWR) (Cortés, 2016). In both locations Thalassia testudinum is the dominant species mixed in with Syringodium filiforme (Krupp, Cortés, & Wolff, 2009; Fonseca, Nielsen, & Cortés, 2007; Paynter, Cortés, & Engels, 2001), as in most locations in the Greater Caribbean (van Tussenbroek et al., 2014; van Tussenbroek, Barba, Wong, van Dijk, & Waycott, 2010).
The Caribbean Coastal Marine Productivity Program (CARICOMP) was a collaborative international program established to monitor mangrove forests, seagrass meadows and coral reefs in the Greater Caribbean. The focus of the program was to study productivity, structure and function of these ecosystems over extended time periods (CARICOMP, 2001). Within the CARICOMP program, 52 seagrass stations at 22 sites were monitored from 1993 to 2007, and in some cases up to 2012. A recent synthesis of those sites showed wide variation in seagrass productivity and biomass across the Caribbean, unfortunately, CARICOMP seagrass monitoring is now scarce, with many monitoring efforts ending in 2007 (van Tussenbroek et al., 2014).
In Costa Rica, coral reefs and seagrass ecosystems have been continually monitored in Cahuita, and the mangrove forest in Gandoca-Manzanillo since 1999. Previously, Cortés et al. (2010) summarized the data from 1999 to 2008 to determine trends in the marine ecosystems in the Caribbean coast of Costa Rica. Fonseca et al. (2007) analyzed the monitoring data at the seagrass beds in Cahuita in the 1999 to 2005 time period.
This study analyzes the CARICOMP seagrass monitoring data in Cahuita, Costa Rica, for the 2009-2015 time period in order to assess potential variations over time in the seagrass meadows at this location. We hypothesize that seagrass biomass, productivity, turnover rate, density and leaf area index, and environmental parameters such as water clarity, salinity, temperature and rainfall, remained stable within this time period, with seasonal variation within years.
Materials and methods
Site description: The seagrass bed monitoring site is known as Perezoso (9°44’’13’’ N-82°48 ‘24’’ W), off the Perezoso Creek, Cahuita National Park (CNP), Limón, on the Caribbean coast of Costa Rica. The seagrass monitoring location is at less than 1m depth and is dominated by T. testudinum, with interspersed S. filiforme (Cortés et al., 2010; Fonseca et al., 2007). Tides are mixed, predominantly diurnal, and range between 30 to 50 cm (Lizano, 2006). In the region, there are two rainy seasons: from November to March, and from June to August (Cortés et al., 2010). Mean annual rainfall during the monitoring period (2009-2015) was 2 764.6 ± (213.7 S.E.) mm, and mean annual temperature 25.7 ± (0.1 S.E.) °C (IMN, 2016).
Methodology: The Caribbean Coastal Marine Productivity Program methodology was used (CARICOMP, 2001). This protocol was created to compare monitoring results among coastal ecosystems of the Greater Caribbean (Cortés et al., 2010). A permanent station to monitor seagrasses was established in 1999 at Perezoso, CNP. The amount and frequency of field trips during this time period varied among years due to weather and economic constraints (Table 1).
Table 1: Sampling dates at the seagrass meadow of Perezoso, CNP, Limón, Costa Rica, during the study period 2009-2015
| 2009 | 2010 | 2011 | 2012 | 2013 | 2014 | 2015 | |
| January | √ | ||||||
| February | √ | √ | √ | ||||
| March | √ | ||||||
| April | √ | √ | |||||
| May | √ | √ | √ | ||||
| June | √ | ||||||
| July | √ | √ | √ | ||||
| August | √ | √ | |||||
| September | √ | √ | |||||
| October | √ | √ | √ | ||||
| November | √ | √ | |||||
| December | √ |
Total seagrass biomass was determined by collecting six core samples randomly from the seagrass bed per field trip using a PVC corer 40 cm long by 15 cm in diameter. In the laboratory, samples were frozen until they could be processed. Biomass samples were separated into the components: short shoots, rhizomes, roots, leaves, flowers, fruits and dead below ground material. Each component was dried at 60 °C for at least 72 hr until they reached a constant weight.
To measure productivity, all T. testudinum shoots were marked with a needle in six 10 x 20 cm quadrants (CARICOMP, 1997). Between eight and 15 days after marked, all shoots from each quadrat were extracted from the seagrass bed and transported to the laboratory. In the laboratory, samples were frozen until they could be processed. Leaves were measured and separated into three fractions: new leaves, new leaf since marking, and old standing crop. Separated fractions were decalcified in 10 % hydrochloric acid, rinsed and dried at 60 °C for at least 72 hr until they reached a constant weight. Shoot density was calculated from these six small quadrats. Turnover rate (% day-1) was obtained from productivity data, dividing the daily productivity between the standing crop. Five shoots were collected from the meadow and width and length were measured for each leaf using a hand-held ruler, leaf area was subsequently calculated for each shoot. Five replicates of LAI (leaf m2 surface m-2) per sample were calculated using the same density per sample.
Water temperature was measured every 30 min with in situ Hobo® Temp continuous recorders. To determine water clarity, four horizontal Secchi disk measurements were taken in the study site on each field outing. For each sampling date, three measurements of salinity from subsurface seawater collected at the site were carried out with a hand refractometer in the laboratory.
Statistical analysis: Linear mixed-effect models fitted with maximum likelihood to test inter-annual and intra-annual variations on the seagrass parameters (biomass, productivity, turnover rate, density, leaf area and LAI) were carried out in R (R Development Core Team, 2012). Kruskal-Wallis tests for equal medians were used to determine if environmental parameters varied significantly among the years of the study period. Spearman tests were used to analyze correlations between seagrass parameters and environmental measures obtained from the National Meteorological Institute (IMN) database (precipitation and air temperature), and direct measurements in seawater (temperature, salinity, water clarity). For Kruskal-Wallis and Spearman tests the PAST statistical program was used (Hammer, Harper, & Ryan 2001).
Results
Biomass, productivity, turnover rate, density and leaf area: Mean biomass (n = 27) was 1 255.4 ± 146.2 gm-2 and ranged from 834.2 gm-2 in March 2015 to 1 654.4 gm-2 in January 2013 (Figure 1). There were no significant differences in biomass among years (F = 1.81, d.f. = 151, P ≥ 0.05), nevertheless, there were significant differences among sampling months (F = 2.64, d.f. = 151, P ˂ 0.05). Above (AG) and below (BG) ground biomass ratio for T. testudinum was 0.86. Flowers and fruits of T. testudinum were found in the meadow between March and May.
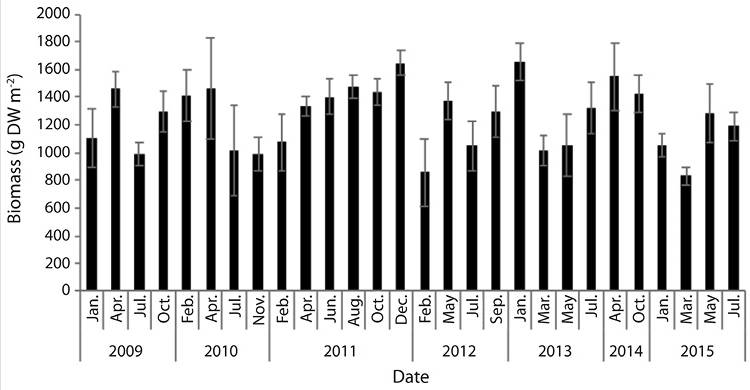
Figure 1 Thalassia testudinum mean biomass (gDWm-2) at Perezoso, Cahuita, Costa Rica (N = 169, S.E = 34.1).
Mean S. filiforme biomass (n = 19) was 27.3 ± 33.9 gm-2 and ranged from 0.2 gm-2 in February 2012 to 109.9 gm-2 in September 2012. There were no significant differences in S. filiforme biomass among years (F = 1.81, d.f. = 115, P ≥ 0.05), or months (F = 0.79, d.f. = 115, P ≥ 0.05). AG and BG biomass ratio of S. filiforme was 0.86.
Mean productivity (n = 23) ranged from 0.5 gm-2d-1 in July 2009 to 3.0 gm-2d-1 in February 2011. Total mean productivity was 1.5 ± 0.7 gm-2d-1 (Figure 2). Productivity was significantly different among years (F = 9.05, d.f. = 112, P ˂ 0.05), and sampling months (F = 4.08, d.f. = 112, P ˂ 0.05).
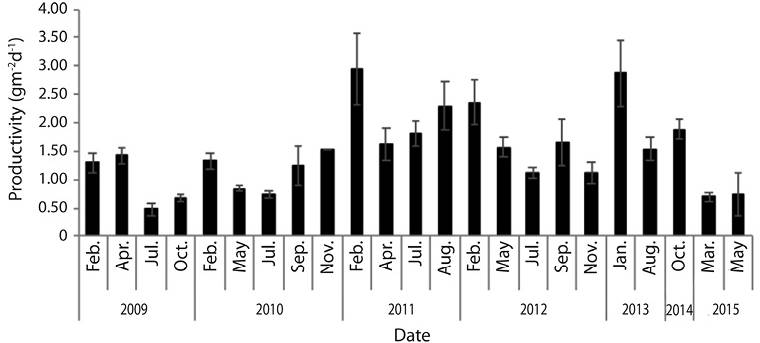
Figure 2 Thalassia testudinum mean productivity (gm-2d-1) at Perezoso, Cahuita National Park, Costa Rica (N = 129, S.E. = 0.08).
Mean turnover rate (n = 23) was 4.3 ± 1.3 %d-1, with a minimum in March 2015 (2.3 %d-1) and maximum in June 2011 (8.1 %d-1) (Figure 3). There were significant differences in the turnover rates among years (F = 10.10, d.f. = 112, P ˂ 0.05) and months (F = 6.08, g.l. = 112, P ˂ 0.05).
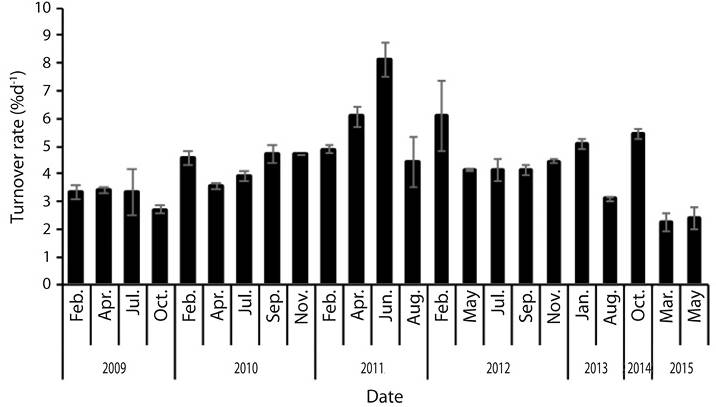
Figure 3 Thalassia testudinum mean turnover rate (%d-1) at Perezoso, CNP, Costa Rica (N = 129. S.E. = 0.1).
Mean density (n = 24) was 1 088.4 ± 318.5 shoots m-2, with minimum density in June 2011 (491.7 shoots m-2) and maximum in October 2014 (1 810 shoots m-2) (Figure 4). There were significant differences in density among years (F = 8.46, d.f. = 112, P ˂ 0.05) and months (F = 6.07, d.f. = 112, P ˂ 0.05).
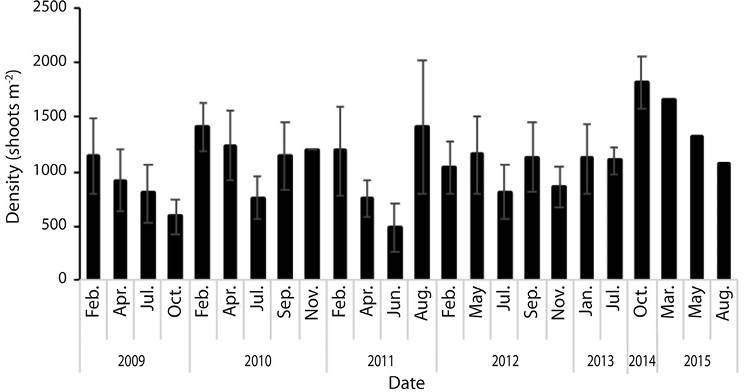
Figure 4 Thalassia testudinum mean density (shoots m-2) at Perezoso, CNP, Costa Rica (N = 129, S.E. = 35.2).
From 2009 to 2015, mean leaf length of the second youngest leaf was 7.4 ± 0.4 cm, mean width 0.8 ± 0.1 cm, and mean leaf area (n = 21) 4.9 ± 2.3 cm2. Mean Leaf Area Index (n = 21) (LAI) was 1.9 ± 0.8 m2 leaf m-2. There were significant differences in LAI among years (F = 2.81, d.f. = 89, P ˂ 0.05) and months (F = 4.79, d.f. = 89, P ˂ 0.05) (Table 2).
Table 2: Leaf Area Index (LAI), mean leaf length, mean leaf width and leaf area of Thalassia testudinum at Perezoso, CNP, Costa Rica, 2009-2015
| Year | LAI (m2 m-2) | Mean leaf length (cm) | Mean leaf width (cm) | Leaf area (cm2) |
| 2009 | 1.85 | 5.86 | 0.77 | 3.22 |
| 2010 | 1.79 | 5.91 | 0.79 | 4.46 |
| 2011 | 1.82 | 6.26 | 0.83 | 5.52 |
| 2012 | 2.06 | 7.20 | 0.78 | 5.97 |
| 2013 | 1.55 | 8.12 | 0.89 | 6.90 |
| 2014 | - | - | - | - |
| 2015 | 2.32 | 2.81 | 0.59 | 0.18 |
| Average | 1.90 | 6.02 | 0.78 | 4.37 |
Macroalgae were commonly observed associated with the seagrass bed at CNP, mainly Halimeda, Dictyota, Caulerpa, Sargassum, and Padina. Marks of the gastropod, Smaragdia viridis (B. van Tussenbroek, personal communication, 2016) were present on some T. testudinum leaves.
Water temperature, salinity, and clarity: Mean water temperature (n = 1 926) was 28.8 ± 0.1 °C, and ranged from 26.3 °C in February 2009 to 30.2 °C in September 2010 (Table 3). Mean salinity (n = 117) was 31.7 ± 3.3 PSU and ranged from 20.2 PSU in April 2015 to 36.4 PSU in May 2012. Mean Secchi disk (n = 179) was 3.2 ± 2.2 m and ranged from 0.3 m in January 2009 to 8.1 m in April 2015 (Table 2). There were no significant variations in mean values of water temperature and Secchi disk (Kruskal-Wallis, P ≥ 0.05) during the study period, while there were significant differences among mean salinity values (Kruskal-Wallis, P ˂ 0.05). Salinity was lowest during October 2014 and April 2015, and highest during September 2012 and August 2013 (Table 3).
Table 3: Mean annual, minimum and maximum seawater temperature (°C), mean salinity and mean Secchi distance at Perezoso, Cahuita National Park, Costa Rica, 2009-2015
| Year | Mean temperature (°C) | Mininum temperature (°C) | Maximum temperature (°C) | Mean salinity (PSU) | Secchi (m) |
| 2009 | 28.65 | 27.72 | 29.81 | - | 3.69 |
| 2010 | 29.03 | 28.02 | 30.27 | 30.62 | 3.66 |
| 2011 | 28.82 | 27.79 | 30.13 | 31.68 | 1.98 |
| 2012 | 28.66 | 27.64 | 29.97 | 34.94 | 2.26 |
| 2013 | 29.00 | 26.98 | 31.84 | 33.80 | 2.77 |
| 2014 | 28.73 | 26.82 | 31.42 | 25.00 | 6.12 |
| 2015 | 29.22 | 27.71 | 31.72 | 30.03 | 4.13 |
The environmental parameters measured in situ for the period 2009-2015, salinity, Secchi (water clarity), and temperature, did not exhibit a significant correlation with any of the seagrass measurements (Table 4). Most of the seagrass parameters were negatively correlated with precipitation (Table 4). Density of T. testudinum (Spearman, r = 0.14) and biomass of S. filiforme (Spearman, r = 0.14) were the only two seagrass parameters that did not have a strong correlation with precipitation.
Table 4: Correlation analyses between Thalassia testudinum parameters and Syringodium filiforme biomass with environmental variables (seawater temperature, salinity, Secchi disk, air temperature and rainfall) at Cahuita National Park, Costa Rica, 2009-2015
| Leaf área (cm-2) | Productivity (g m-2 d-1) | Turnover rate (% d-1) | Density (shoots m-2) | Biomass (g m-2) | S. filiformebiomass (g m-2) | |||||||
| Seawater parameters | ||||||||||||
| r | p | r | p | r | p | r | p | r | p | r | p | |
| Seawater Temp (°C) | -0.66 | 0.33 | 0.32 | 0.57 | -0.28 | 0.50 | 0.07 | 0.84 | 0.32 | 0.48 | -0.61 | 0.22 |
| Salinity (PSU) | 0.25 | 0.76 | 0.37 | 0.42 | 0.03 | 1 | 0.54 | 0.24 | -0.26 | 0.56 | 0.60 | 0.17 |
| Secchi (m) | -0.41 | 0.53 | -0.41 | 0.38 | -0.43 | 0.30 | -0.61 | 0.14 | -0.04 | 0.90 | -0.43 | 0.36 |
| Environmental parameters | ||||||||||||
| Air Temp (°C) | 0.23 | 0.65 | 0.40 | 0.38 | -0.05 | 0.92 | 0.61 | 0.15 | 0.41 | 0.58 | 0.14 | 0.71 |
| Precipitation (mm) | -0.83 | 0.03 | -0.96 | 0.00 | -0.78 | 0.05 | 0.14 | 0.71 | -0.78 | 0.05 | -0.03 | 1.00 |
Discussion
There were no significant differences in biomass among years in the 2009 to 2015 time period revealing biomass stability in the seagrass meadows at Cahuita National Park (CNP), Caribbean coast of Costa Rica. This stability follows a period of a decreasing tendency in T. testudinum biomass in Cahuita from 1999 to 2006; which was attributed to an increase of the maximum water temperature at the site of approximately 10 ºC and to differences of 14.3 °C between maximal (39.6 °C) and minimal water temperature (25.3 °C) (Fonseca et al., 2007). Water temperature and light regime, determined by latitude, are considered to be good predictors for community biomass in the Greater Caribbean (Van Tussenbroek et al., 2014). Nonetheless, from 2009 to 2015 the variance between minimum and maximum temperature at Cahuita was 4.9 °C, much smaller than from 1999 to 2006.
Mean biomass in the 2009-2015 monitoring period increased compared to Fonseca et al. (2007) and Cortés et al. (2010). Mean biomass of T. testudinum between 2009 and 2015 in CNP was also higher than the mean biomass reported for this species in Tobago from 1992 to 2002 (Juman, 2005) and Mexico from 1993 to 2005 (Rodríguez-Martínez et al., 2010). López-Calderón, Guzmán, Jacome, & Barnes (2013) found a mean biomass from 1999 to 2010 of 1 481 gDWm-2 for T. testudinum and an increase of this biomass with time, in Bocas del Toro (Table 5). Contrary to Fonseca et al. (2007), López-Calderón et al. (2013) attributes biomass increase to an increase in water temperature and nutrient availability.
Table 5: Summary table of the mean seagrass variables presented in different CARICOMP studies during different periods. CNP: Cahuita National Park
| Study | Site | Biomass (g/m2) | Productivity (g/m2/d) | Turnover rate (%) | Foliar área (cm2) | LAI | Density (shoot/m2) | Period |
| Paynter, Cortés & Engels 2001 | Cahuita National Park, Costa Rica | 1 057 | 2.4 | 3.69 | 1 418 | 1999 | ||
| Guzmán et al. 2005 | Bocas del Toro, Panamá | 560 | 1.82 | 2.54 | 3.72 | 17.6 | 1999 | |
| Juman 2005 | Bon Accord Laggon, Tobago | 437.7 - 319.2 | 3.0 - 5.0 | 4.2 - 5.6 | 1998-1999 | |||
| Fonseca, Nielsen & Cortés. 2007 | Cahuita National Park, Costa Rica | 822.8 | 2.7 | 5.5 | 9.68 | 0.92 | 1 184 | 1999-2005 |
| Nielsen-Muñoz & Cortés. 2008 | Cahuita National Park, Costa Rica | 696.8 | 2003-2006 | |||||
| Krupp, Cortés & Wolff. 2009 | Gandoca Manzanillo National Wildlife Refuge, Costa Rica | 1 564 | 1.5 - 2.5 | 3.0 - 3.8 | 2.1-3.2 | 2005-2006 | ||
| Martínez-Daranas, Cabrera & Pinas-Amargós 2009 | Nuevitas Bay, Cuba | 2.08 | 617 | 2001-2002 | ||||
| Cortés, Fonseca, Nivia-Ruiz & Nielsen-Muñoz. 2010 | Cahuita National Park, Costa Rica | 978.6 | 1.6 | 4.4 | 2.5 | 1.4 | 1 079 | 1999-2008 |
| Rodríguez-Martínez et al. 2010 | Puerto Morelos, México | 531 - 699 | 1.5 - 0.9 | 731 | 1993-2005 | |||
| Rodríguez-Ramírez et al. 2010 | Chengue bay, Colombia | 2.5 | 4.0 | 650 | 1993-2008 | |||
| López-Calderón et al. 2013 | Bocas del Toro, Panama | 1 481 | 1.74 | 2.62 | 4.65 | 1999-2010 | ||
| This study | Cahuita National Park, Costa Rica | 1 255 | 1.52 | 4.26 | 4.86 | 1.87 | 1 197 | 2009-2015 |
There was no discernable pattern of seasonal variability in seagrass biomass, despite there being clear variations among sampled months. Fonseca et al. (2007) did not find any seasonal differences in the biomass of T. testudinum. No seasonal biomass patterns were found either for the biomass in a study of T. testudinum at the CARICOMP site of Bocas del Toro (López-Calderón et al., 2013). Martínez-Daranas, Cabrera, & Pinas-Amargós (2009) in Cuba and Rodríguez-Martínez et al. (2010) in México, found lower values of biomass during winter months, and they associated these low values to a lower production of tissues induced by low temperatures, variations in solar cycle, as well as a reduction of photosynthesis activity during winter. The variations among months in the 2009-2015 monitoring period do not reveal any clear seasonal pattern, since high and low peaks were reached during the rainy season.
At the Cahuita CARICOMP monitoring location mean productivity of T. testudinum during 2009-2015 was lower than the 1999-2008 time period (Cortés et al., 2010; Fonseca et al., 2007; Paynter et al., 2001). During the 2005-2006 period, Gandoca-Manzanillo National Wildlife Refuge (GMNWR) in the Caribbean coast of Costa Rica, had higher productivity than in this study (Krupp et al., 2009) (Table 5). However, in the compilation done by van Tussenbroek et al. (2014), leaf productivity at Costa Rica sites was higher than at many CARICOMP sites.
Productivity of T. testudinum in CNP seems to be one of the lowest in the Caribbean region during recent periods. For example, in Bocas del Toro, Panama, mean productivity for T. testudinum between 2000-2010 was 1.7 gm-2d-1(López-Calderón et al., 2013), while in 1999 it was 1.8 gm-2d-1 (Guzmán, Barnes, Lovelock & Feller, 2005). Between 1998 and 1999 mean productivity ranged from 3.0 to 5.0 gm-2d-1 at two sites of Bon Accord, Tobago (Juman, 2005). In Nuevitas Bay, Cuba, mean productivity was 2.1 gm-2d-1 between 2000 and 2001 (Martínez-Daranas et al., 2009). In Colombia, Chegue Bay, mean productivity of T. testudinum was 2.5 gm-2d-1 (Rodríguez-Ramírez et al., 2010). Only in Puerto Morelos, México, was productivity close or lower to our results, with a mean value between 1.5 and 0.9 gm-2d-1 (Rodríguez-Martínez et al., 2010) (Table 5). However, van Tussenbroek et al. (2014) found that leaf productivity at Costa Rica sites (2.08 and 2.94 gm-2d-1) was higher than at many other CARICOMP sites.
Turnover rates also appear to be quite low compared to previous studies at CNP. In the 2009-2015 monitoring period a turnover rate of 4.3 %d-1 was obtained, while in the 1999-2008 period turnover rates of 4.4 %d-1 and 5.5 %d-1were obtained for the same meadow at CNP (Cortés et al., 2010; Fonseca et al., 2007). However, Paynter et al. (2001) obtained a lower turnover rate (3.7 %d-1) between March and April 1999 in CNP. On the other hand, mean turnover rate reported in this study is higher or similar than the ones reported for GMNWR in Costa Rica, Tobago, and Panama (Krupp et al., 2009; Juman, 2005; López-Calderón et al., 2013) (Table 5). Fonseca et al. (2007) suggested that turnover rates are higher in seagrasses beds that are subject to a large discharge of terrestrial nutrients. According with the compilation done by van Tussenbroek et al. (2014), turnover rates for Costa Rica sites (4.4 and 5.5 % d-1) were higher than at many other CARICOMP sites.
In the 2009-2015 period, productivity and turnover rate of T. testudinum presented significant intra-annual differences and among years; nevertheless, this was not explained by seawater parameters (salinity, temperature, Secchi). In CNP, Fonseca et al. (2007) and Cortés et al. (2010) found a high correlation between productivity of T. testudinum and seawater temperature. However, in GMNWR there was no relation between salinity and seawater temperature and productivity of T. testudinum (Krupp et al., 2009).
In Mexico and Tobago respectively, there was a high productivity during the dry season and low productivity during the wet season (Rodríguez-Martínez et al., 2010; Juman, 2005). Van Tussenbroek et al. (2014) found seasonal differences in leaf productivity only in seagrass beds above latitude 16°48’ N, and confirmed a high growth season from March to August and a low-growth season between September and February, but, since Costa Rica is below this latitude, marked seasonal differences are not expected. A significant production and turnover rate peak was observed during July 1999 in CNP (Fonseca et al., 2007). However, the highest productivity found in this study was during February 2011 and January 2013; and the lowest during July 2009, October 2009 and March 2015; for turnover rate, the lowest mean values were found during October 2009, March and May 2015. These results seem to have no clear seasonal patterns for productivity and turnover rate in CNP seagrasses. In accordance to this, it is important to highlight that T. testudinum production, leaf area, biomass and turnover rate were negatively correlated with precipitation, and 2009 was an ENOS year that particularly intensified during July and October 2009 (IMN, 2009). The period 2014-2015 also presented an ENOS event of high intensity (IMN, 2015).
Thalassia testudinum shoot density between 2009 and 2015 was similar to previous time periods in CNP (Cortés et al., 2010; Fonseca et al., 2007; Paynter et al., 2001). At the same time, mean shoot density in CNP is generally higher than the mean shoot density reported for other countries like Colombia, (Rodríguez-Ramírez et al., 2010), México (Rodríguez-Martínez et al., 2010) and Cuba (Martínez-Daranas et al., 2009) (Table 5). Van Tussenbroek et al. (2014) already determined seagrass shoot density in Costa Rica (934.5 and 1078.2 shoots/m2) as one of the highest among CARICOMP sites. Mean density showed inter-annual and intra-annual variations, with increasing peaks in February 2010 and October 2014, and decreasing peaks in October 2009 and June 2011. In Nuevitas Bay, Cuba, Martínez-Daranas et al. (2009) recorded higher density values during spring and summer; however, in Mexico, T. testudinum’s density remained constant throughout the monitoring period (Rodríguez-Martínez et al., 2010).
Mean Leaf Area diminished considerably in the study period (2009-2015) compared to 1999-2000 (Fonseca et al., 2007), but it was higher than between 2000-2008 (Cortés et al., 2010). Conversely, LAI between 2009 and 2015 was higher than in 1999-2000 and 1999-2008 periods (Fonseca et al., 2007; Cortés et al., 2010). This could be explained because leaves of T. testudinum are now shorter and narrower than in 2000 for the same seagrass bed but, on the other hand, there is more leaf area per m2 than in 2000, which is due to a density increase. Van Tussenbroek et al. (2010) defined a mean leaf length for T. testudinum between 10 and 80 cm, being much longer than what we found in Cahuita. There are two reasons that could help explain this pattern, one could be due to an increase in herbivory of T. testudinum (Valentine & Duffy, 2006), or an increase of epibiotia living on the leaves (Borowitzka, Lavery, & van Keulen, 2007). Another explanation could be the clonal recruitment of new seagrass shoots, since new leaves are smaller, and density increases where small leaves appear (Krupp et al., 2009), however, it is very unlikely that the whole seagrass bed consisted of juvenile shoots.
On the other hand, LAI for T. testudinum in CNP was lower than LAI found for another bed in the Caribbean of Costa Rica (Krupp et al., 2009), Panamá (López-Calderón et al., 2013) and Colombia (Rodríguez-Ramírez et al., 2010) (Table 5). Rodríguez-Ramírez et al. (2010) argued that a low LAI indicates a greater number of new leaves in a developing community or a decrease in length and width of leaves because of stress caused by unfavorable environmental factors.
The higher and lower values of mean productivity and mean biomass were obtained during the same sampling months. The higher mean values for both parameters occurred during January 2013. On the other hand, one of the lowest values reached for mean productivity and mean biomass was during March 2015, when an intense ENOS occurred (IMN, 2015). In Cahuita, between 2003 and 2006, average T. testudinum below ground biomass was more than double the above ground biomass (Nielsen-Muñoz & Cortés, 2008). This was attributed to a necessity of nutrient absorption and anchorage to a carbonate fragment substrate. However, below ground biomass of T. testudinum was similar throughout 2009-2015, and close to 50 % (46.1-57.4 %) of the total mean biomass. And it agrees with an increase in total mean biomass of T. testudinum in this study, because total biomass of seagrasses is expected to increase with the increase of nutrient input if they are nutrient limited (van Tussenbroek et al., 2014). The higher values of mean biomass and above-ground biomass proportion, and a lower mean productivity compared to previous observations, suggest that T. testudinum in CNP may have been under the influence of increasing nutrient input in the 2009-2015 monitoring period.
The flowering and fruit observations of T. testudinum at CNP match with others in the region, where flowers are observed between March and May (van Tussenbroek, 1994; van Tussenbroek et al., 2010). However, Nielsen-Muñoz & Cortés (2008) reported flowering for T. testudinum between April and June, and a fruiting period between May and August in the Caribbean coast of Costa Rica. On the other hand, according to what we found in our samples, in the Caribbean region the parrotfish, S. viridis, are closely associated to T. testudinum, and has a trophic dependence on this seagrass (Rueda & Salas, 2007).
In CNP, most seagrass parameters were negatively correlated with rainfall. High levels of precipitation and therefore increased freshwater runoff from Perezoso creek could lead to decreased water clarity and decreased salinity. Nevertheless, water clarity (Secchi depth) did not decrease during the study period, and Secchi depth and salinity were not strongly correlated with any T. testudinum parameter. When comparing three sites in CNP, it has been observed that the higher productivity and biomass of T. testudinum is given at intermediate environmental conditions, such as sediment size (coarse or fine sand), temperature (25 °C) and salinity (37 ppm) (Paynter et al., 2001). Based on the results of this study, precipitation seems to be an important factor influencing T. testudinum parameters in CNP, shedding light on the importance of external environmental agents acting on this ecosystem.
In the Caribbean coast of Costa Rica the largest seagrass beds are located in marine protected areas, where anthropogenic influence is low, trawling, fisheries, marinas, and excessive snorkeling tourism occur far away from the seagrasses beds. But human activities in the watersheds, such as monoculture plantations and pollutant discharges, could affect these ecosystems, as seen in the coral reef (Cortés & Risk, 1985; Cortés et al., 2010). Based on this study, CNP appears to offer conditions suitable for seagrass presence with no evidence of seagrass biomass loss during the study period of 2009-2015. However, there are indirect signals that point to a potential nutrient increment in the seagrass bed. To continue protecting this seagrass bed, it is necessary to continue and improve the seagrass monitoring effort, not only in the National Park but in the rest of the country. Also, the watersheds should be monitored because of their potential impact on the coastal and marine environments and seagrass meadows must be included in national conservation policies.

