


 Inglés (pdf)
 Articulo en XML
 Referencias del artículo
 Enviar articulo por email
 Citado por SciELO
  Similares en
SciELO
Similares en
SciELO  uBio
uBio 
 Permalink
On a global scale, dry forests represent 46 % of all of tropical forests (Cao, Yu, SanchezAzofeifa, Feng, Rivard, & Gu, 2015); in particular, tropical dry forest in South America covers an area of 268 875 km2, which represents 51 % of the total extent of tropical dry forest in the Americas (Portillo-Quintero & Sánchez-Azofeifa, 2010). Tropical dry forests have been defined by Mooney, Bullock, and Medina (1995) as forests occurring in tropical regions characterized by pronounced seasonality in rainfall distribution with several months of drought. These ecosystems are among the most threatened in the world, and both, their structure and function are little known (Becknell, Kucek, & Powers, 2012). In Colombia, the replacement of the original vegetation of dry areas with farming systems and livestock production has led to the progressive loss of tropical dry forest (Flórez-Flórez, León-Peláez, Osorio-Vega, & Restrepo-Llano, 2013); thus, of the original 80 000 km2 of dry sub-humid forests, about 1 200 km2 remain (MAVDT, 2004). In Colombia’s Caribbean region, the dry forest ecosystem is highly degraded, due both to its replacement with production systems and to rapid urban growth, which causes the generation of small, isolated patches that become the dominant landscape matrix (IAvH, 1998; De Chant, Gallego, Saornil, & Kelly, 2010).
The high population density in cities leads to reductions in green areas (Soares, Rego, McPherson, Simpson, Peper, & Xiao, 2011) which in turn generates a critical shortage of these spaces that would help improve residents’ perception of well-being (Madureira, Andresen, & Monteiro, 2011). Urban forests represent an integrated and coherent system of multifunctional areas, which are perceived as living spaces that fulfill important ecological, social and economic functions (Kulchelmeister, 2000; Ferrini & Fini, 2011). These spaces provide goods such as food and energy, and services such as macro and microclimate regulation, recreation, air quality improvement, noise control (Molina & Vargas, 2007; Lima, Staudhammer, Brandeis, Escobedo, & Zipperer, 2013). They can also play an important role from the perspective of conservation biology, by maintaining wildlife metapopulations, acting as reservoirs of genetic material, and favoring conditions for seedling establishment and dry forest regeneration (Ruiz-Jaén & Aide, 2006; Lopes et al., 2012; Valencia-Duarte, Trujillo-Ortiz, & Vargas, 2012).
The assessment of ecosystem functioning through ecological indicators represents a useful tool for integrating ecosystem services into urban development, adaptive planning and environmental management (Pataki et al., 2011). Thus, by monitoring ecological processes in urban forests in order to generate scientific data, universities and research institutes could help produce basic information to incorporate into planning systems and land management processes.
Ecosystem services are supported in ecological processes, such as nutrient cycling, through litter production and decomposition. These processes represent the main transfer of organic matter and nutrients from the vegetation to the soil surface (Celentano et al., 2011), and determine positive trajectories in the process of rehabilitating degraded land and restoring ecosystem resilience (León & Osorio, 2014).
Several authors point out the importance of the study of these processes in the trajectory of these forest fragments, for example, RuizJaén and Aide (2006) evaluated the recovery of fragments of urban secondary forests in Puerto Rico and found a positive effect on the site. These authors recorded high contributions of organic materials via leaf litterfall (12.86-15.52 Mg ha-1 y-1) and high nutrient fluxes to the forest floor (P:1.35-10.14 kg ha-1 y-1, N: 22.90140.42 kg ha-1 y-1). In fragmented landscapes of Costa Rica, Celentano et al. (2011) evaluated litter production, accumulation and decomposition under three restoration strategies. Intermediate values of litterfall (1.1-5.7 Mg ha-1 y-1) and high values of litter accumulation (2.4-10.5 Mg ha-1 y-1) were recorded. The results of this study indicated the acceleration of these processes and the restitution of the nutrient cycle in these previously degraded ecosystems.
The aim of this study was to evaluate the contributions of organic materials and nutrients through the characterization of fine litter by leaf litter in an urban successional dry forest fragment. The results are expected to assist in determining the restoration potential of the biogeochemical cycle of this fragile ecosystem after disturbance.
Materials and methods
Study area: The study was conducted in a seven-year-old secondary dry forest fragment located in the city of Santa Marta, Colombia (11º13’18” N - 74º11’09” W; 21 m above sea level). The annual average temperature is 27 °C, with an average annual rainfall of 608.8 mm (Montes-Correa, Jiménez-Bolaño, Vergara-Ríos, Ávila-Silva, Saboyá-Acosta, & Renjifo, 2015). The fragment is embedded in a matrix of approximately 25 ha, occupied by buildings, experimental crop areas, impoundments, fisheries management, and pastures (Montes-Correa et al., 2015; Strewe et al., 2009).
The forest fragment was 6-12 meters in height. The dominant tree species were Albizia niopoides, Cordia alba and Machaerium milleflorum (Rojano & España, 2013). The soils were alkaline (pH: 8.24), with high organic matter content (4.0 %) and exchangeable bases (Table 1).
Fine litter production: Fine litter production was monitored using 29 circular litter traps of 0.5 m2 made of fine mesh cloth (Muslin cloth, 1 mm pore) and arranged at a height of about 1 meter above the surface of the terrain. Litter traps were placed systematically every 10 meters and distributed across five transects (approximately 50 meters each) within the fragment. Material was collected every 15 days during one year (January 2013 - January 2014) and brought to the INTROPIC laboratory at the University of Magdalena. The fine litter (leaves, reproductive materials and woody material with diameter ≤ 2 cm: Proctor, 1983) was classified into the following fractions: LA: leaf litter of A. niopoides, LC: leaf litter of C. alba, LM: leaf litter of M. milleflorum, LO: leaf litter of other species, RA: reproductive material of A. niopoides, RC: reproductive material of C. alba, RM: reproductive material of M. milleflorum, RO: reproductive material of other species, TL: total leaf litter, TR: total reproductive material, WM: woody material, OR: other remains, TF: total fine litter. This material was subsequently oven-dried to constant weight at a temperature of 65 °C.
Leaf nutrient resorption and nutrient use efficiency: To evaluate the leaf nutrientresorption process, mature green leaves were collected from 10 individuals representing each dominant species (Table 1). Leaves were collected once a month for six months. The combined leaf material collected for each species was labeled and packed into plastic bags. Collected material was oven-dried to constant weight in the laboratory, at a temperature of 65 °C. Subsequently the collected leaves of each species were mixed and homogenized separately, and taken to a muffle for calcination, and subsequent chemical analysis. Leaf nutrient resorption was determined as the difference between the nutrient amount in the mature leaves and the leaf litter collected in the traps (Hagen-Thorn, Varnagiryte, Nihlgård, & Armolaitis, 2006). This value, related to the amount of nutrient in the mature leaves, allows to obtain an approximation of the reabsorbed amount of each nutrient that, multiplied by 100, expresses it in percentage (León, González, & Gallardo, 2011). The nutrient use efficiency was determined through the nutrient use-efficiency index (NUEI, Vitousek, 1984), which considers the efficiency with which a nutrient is used as the amount of dry matter produced in the litterfall, per unit of that nutrient contained in it, this is the inverse of the leaf litter nutrient concentration (1/[nutrient concentration]).
Leaf litter decomposition: The experiment was conducted over a period of six months (August 2013-January 2014). The litter-bags used (20 x 20 cm, 2 mm pore) were made of polypropylene mesh. The bags were filled with 2 g of unmixed leaf litter of the C. alba and M. milleflorum species, which was previously collected in the field and laboratory-dried at a temperature of 65 °C. A. niopoides could not be evaluated by the leaf litter size was smaller than the pore mesh of the litter-bags. Three bags of each species were collected monthly from the field for a total of 18 bags by species and taken to the laboratory. The remaining material was extracted from each litter-bag and cleaned manually to eliminate roots, invertebrates, and soil. Subsequently, the material was dried at 65 ºC until reaching constant weight. The leaves of each species and by collection event, were mixed, milled and heated to 600 ºC for elemental analysis.
Table 1: Structural characteristics and chemical properties of soils (0-20 cm) in an fragment of urban tropical dry forest
| Dominant species | SD | G | RF | RA | RD | IVI | |||||
| A. niopoides | 50 | 8.40 | 12.70 | 20.30 | 48.30 | 81.30 | |||||
| C. alba | 85 | 2.71 | 12.70 | 33.90 | 15.60 | 62.10 | |||||
| M. milleflorum | 36 | 2.30 | 11.40 | 13.90 | 13.20 | 38.50 | |||||
| Average | 57 | 4.47 | 12.27 | 22.70 | 25.70 | 60.63 | |||||
| Species in the Forest fragment | 251 | - | - | - | - | - | |||||
| Site | pH | OM | N | C | C/N | P | Ca | Mg | K | CIC | |
| -- % -- | mg kg-1 | -- cmol(+) kg-1-- | |||||||||
| Fragment | 8.24 | 4.0 | 0.20 | 2.32 | 11.60 | 242.60 | 16.59 | 4.52 | 1.47 | 22.59 | |
| Control Sites* | |||||||||||
| C1 | 8.22 | 2.27 | 0.14 | 1.32 | 9.42 | 240.10 | 13.97 | 4.32 | 1.28 | 19.57 | |
| C2 | 7.82 | 3.36 | 0.17 | 1.95 | 11.47 | 212.80 | 14.85 | 4.93 | 0.96 | 20.74 | |
| C3 | 8.63 | 2.63 | 0.17 | 1.53 | 9.08 | 226.10 | 14.35 | 4.73 | 1.28 | 20.35 | |
| C4 | 7.92 | 1.01 | 0.31 | 0.59 | 1.90 | 237.40 | 15.72 | 4.32 | 1.92 | 21.95 | |
| Average | 8.15 | 3.52 | 0.20 | 2.04 | 8.00 | 229.10 | 14.72 | 4.58 | 1.36 | 20.65 | |
SD: Stand density for trees with dbh >10 cm/ha, G: Basal Area (m2/ha), RF: Relative Frequency (%). RA: Relative Abundance (%), RD: Relative Dominance (%), IVI: Importance Value Index (Rojano & España, 2013), OM: Organic Matter, CEC: Cation Exchange Capacity. * Soils of sites around the urban fragment of dry forest.
Chemical analysis: Nutrient analysis was performed in the Biogeochemistry Laboratory at the National University of Colombia. The concentration of nitrogen (N) in the leaf material of the dominant species selected was determined by the micro-Kjeldahl method. Phosphorus (P) was estimated by the acid digestion method (L-ascorbic acid) and colorimetry. Calcium (Ca), magnesium (Mg) and potassium (K) were analyzed by atomic absorption. Soil samples (20 cm depth) taken from the forest and control sites were air-dried and sifted in a sieve with a mesh eye size of 2.0 mm. Total soil P was determined by the Bray II / L-ascorbic acid method and colorimetry. Ca, Mg and K, were determined through extraction with ammonium acetate (CH3COONH4) and the respective neutral 1N reading by atomic absorption spectrophotometry. Total N was determined by the micro-Kjeldahl method. The texture was determined by the Bouyoucos Hydrometer method and the pH was determined by potentiometry (soil:water 1:2). Details about foliar and soil analysis methods are available in Westerman (1990) and Kalra (1998).
Data processing: Nutrient potential return of dominant species was obtained by multiplying leaf litter production by the concentration of the nutrient in it. The simple exponential decay model X t =X 0 e -kt (1) was employed to estimate decomposition rates (Jenny, Gessel, & Bingham, 1949; Olson, 1963), where X 0 is the initial dry mass, X t is the dry mass at time t, and k is the decay constant. Residual dry matter (RDM - remaining material in the litter-bags at time t) was calculated as X t /X 0 . The amount of residual nutrients during the decomposition process was calculated by multiplying the RDM by the concentration of the element at time (t), and then dividing by the initial concentration. Correlation coefficients were calculated to determine the association between rainfall and litter processes (litterfall and decomposition). A Kruskal-Wallis nonparametric test was used to detect significant differences in the production and decomposition of leaf litter among species and fractions, since the data were not normally distributed (Shapiro-Wilks, P≤0.05). Data were analyzed using Statgraphics Centurion software, version 15.2.11.0.
Results
Fine litter production: The annual production of fine litter in the dry forest fragment was 8.6 Mg ha-1 (Table 2). Among the fractions, the largest contribution was recorded for total leaf litter (TL: 4.7 Mg ha-1, 55 % of TF), followed by woody material (WM). The lowest contribution was recorded for the other remains fraction (OR). Among species, the greatest annual contributions of leaf litter were recorded for C. alba (1.1 Mg ha-1).
Table 2 Mean monthly litterfall fractions (kg ha-1) at the urban dry forest fragment
| Month | T (days) | LA | LC | LM | LO | RA | RC | RM | RO | TL | TR | WM | OR | TF |
| J | 29 | 61.4 (114.6) | 31.3 (63.0) | 30.8 (110.1) | 416.4 (29.1) | 28.5 (81.4) | 26.6 (107.3) | 13.2 (120.7) | 92.3 (113.8) | 540.0 (27.0) | 160.6 (65.1) | 240.3 (47.6) | 59.5 (47.4) | 1000.4 (29.5) |
| F | 31 | 57.7 (81.7) | 31.3 (50.3) | 26.7 (46.0) | 142.3 (23.7) | 48.7 (63.7) | 2.5 (82.0) | 3.7 (47.3) | 33.7 (126.5) | 258.0 (25.3) | 88.6 (34.0) | 138.2 (26.1) | 36.6 (83.4) | 521.4 (19.9) |
| M | 21 | 3.4 (101.9) | 31.7 (90.0) | 22.4 (89.7) | 140.7 (49.0) | 54.5 (89.7) | 2.9 (146.5) | 1.9 (72.8) | 94.4 (166.1) | 198.3 (36.8) | 153.7 (131.2) | 96.0 (38.6) | 13.7 (113.1) | 461.6 (62.3) |
| A | 39 | 6.9 (124.1) | 42.4 (77.7) | 39.4 (70.5) | 230.3 (48.0) | 150.9 (57.1) | 26.7 (149.3) | 1.2 (123.4) | 85.7 (95.0) | 319.0 (38.1) | 264.5 (58.9) | 129.2 (36.5) | 19.5 (27.8) | 732.2 (38.6) |
| M-J | 63 | 0.5 (75.4) | 105.2 (90.2) | 112.8 (106.9) | 262.8 (77.8) | 69.4 (53.4) | 125.4 (162.6) | 7.7 (172.8) | 14.4 (184.8) | 481.4 (41.2) | 217.0 (95.2) | 618.4 (146.4) | 75.9 (76.0) | 1392.7 (50.6) |
| J | 42 | 4.5 (114.9) | 84.0 (41.6) | 21.00 (48.1) | 154.4 (30.9) | 6.9 (81.9) | 39.8 (50.1) | 5.7 (101.9) | 5.0 (67.7) | 263.9 (23.9) | 57.4 (31.7) | 141.9 (48.5) | 23.3 (104.7) | 486.5 (23.8) |
| A | 30 | 1.0 (41.4) | 180.5 (48.6) | 27.3 (53.1) | 189.8 (18.6) | 1.1 (111.2) | 15.4 (68.9) | 4.4 (81.2) | 18.9 (52.00) | 398.6 (24.9) | 39.8 (28.9) | 82.4 (24.5) | 9.6 (47.3) | 530.4 (19.5) |
| S | 32 | 1.9 (62.0) | 100.0 (27.2) | 33.5 (51.7) | 175.8 (17.4) | 1.7 (124.9) | 20.9 (38.4) | 5.9 (76.9) | 5.3 (71.5) | 311.2 (11.8) | 33.7 7(20.4) | 77.7 (23.1) | 12.5 (55.9) | 435.2 (11.5) |
| O | 35 | 2.6 (76.1) | 226.9 (31.1) | 50.2 (56.8) | 293.9 (15.2) | 1.1 (112.7) | 47.3 (60.7) | 75.6 (79.6) | 12.6 (118.4) | 573.7 (13.2) | 136.7 (37.9) | 149.6 (27.9) | 21.6 (77.9) | 881.6 (16.3) |
| N | 27 | 74.4 (32.6) | 186.3 (32.8) | 45.1 (48.8) | 329.3 (12.3) | 13.7 (45.9) | 6.2 (55.4) | 24.0 (106.2) | 22.6 (67.5) | 635.2 (9.2) | 66.6 (42.5) | 172.4 (27.9) | 5.0 (46.6) | 879.3 (9.2) |
| D | 32 | 34.5 (32.6) | 114.2 (33.4) | 65.4 (42.8) | 504.8 (27.7) | 51.9 (49.8) | 2.0 (87.9) | 11.2 (66.4) | 56.4 (67.4) | 719.0 (21.9) | 121.5 (34.0) | 395.7 (27.4) | 16.1 (60.7) | 1252.3 (17.7) |
| Total | 381 | 249 | 1134 | 474.7 | 2840.7 | 428.5 | 315.7 | 154.6 | 441.4 | 4698.3 | 1340.1 | 2241.9 | 293.2 | 8573.5 |
| Average | 34.6 | 22.6 a (78.0) | 103.1 b (53.3) | 43.2 a (65.9) | 258.2a (31.8) | 39.0a (79.2) | 28.7a (91.7) | 14.1 (95.4) | 40.1 (93.7) | 427.1 (24.9) | 121.8 (52.7) | 203.8 (43.1) | 26.7 (67.4) | 779.4 (27.2) |
Values in parentheses represent the coefficient of variation (%). LA: leaf litter of A. niopoides, LC: leaf litter of C. alba, LM: leaf litter of M. milleflorum, LO: leaf litter of other species, RA: reproductive material of A. niopoides, RM: reproductive material of M. milleflorum, RC: reproductive material of C. alba, RO: reproductive material from other species, TL: total leaf litter, TR: total reproductive material, WM: woody material, OR: other remains, TF: Total fine litter (Add of TL, TR, WM, OR) . Different letters indicate significant differences (Kruskal-Wallis test, P <0.05) for litter fraction among species.
Monthly litterfall peaks were recorded during May-June and December; these are the months when high and low rainfall occurred, respectively (Figure 1a). The species C. alba showed the highest leaf litter production (P < 0.05), with maximum values occurring between May-June and October (Figure 1b). Although no significant correlations were found between fine litterfall and rainfall, higher litterfall values were observed during the wettest months (May-June 2013). For the leaf litterfall of A. niopoides, a significant inverse relationship with rainfall was found (r-Spearman = -0.79), indicating that the highest defoliation rates for this species were recorded during periods of lowest rainfall.
The reproductive material of the A. niopoides species (RA) showed a high production peak in April and a lower production peak in November (Figure 1c). The reproductive material in the litterfall of C. alba (RC) was positively related to rainfall (r-Spearman = 0.67) (Figure 1c). In contrast, an inverse pattern was found for the reproductive material of other species fraction (RO) (r-Spearman = -0.76).
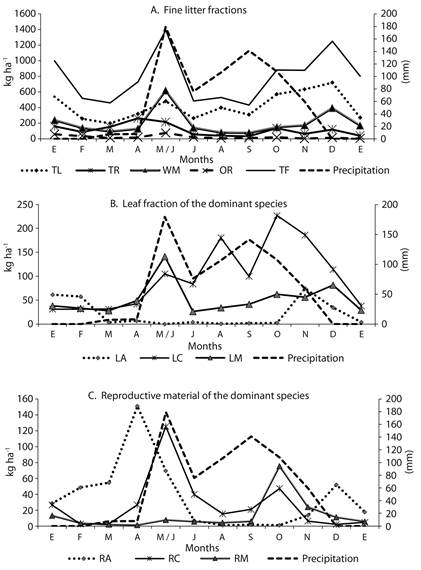
Figure 1 Monthly production of fine litter (kg ha-1) in an urban tropical dry forest fragment and monthly precipitation. LA: leaf litter of A. niopoides, LC: leaf litter of C. alba, LM: leaf litter of M. milleflorum, LO: leaf litter of other species, RA: reproductive material of A. niopoides, RM: reproductive material of M. milleflorum, RC: reproductive material of C. alba, RO: reproductive material from other species, TL: total leaf litter, TR: total reproductive material, WM: woody material, OR: other remains, TF: Total fine litter.
Nutrient potential return via leaf litter: For all species, high values for nutrient return through leaf litter were found for N, Ca, Mg, and K, and low return values were found for P. The highest annual nutrient potential return was recorded for C. alba and the lowest was recorded for A. niopoides (Table 3).
Leaf nutrient resorption and nutrient use efficiency: In general, higher leaf nutrient resorption values of N and P were recorded for C. alba (N: 54.6 % and P: 5.19 %) and lower for A. niopoides (N: 33.2 % and P: 7.1 %) (Table 4). The highest nutrient use efficiency values were recorded for P in the A. niopoides and M. milleflorum species (NUE: 1 207.3 and 1 538.5, respectively) and the lowest was recorded for C. alba (913.8). The lowest NUE values were recorded for Ca in A. niopoides (26.8). A high N-use efficiency value was found for C. alba (NUE: 80.09), while A. niopoides showed the lowest NUE for this nutrient (51.6).
Table 3 Annual nutrient potential return (kg ha-1 y-1 ± SD) through leaf litter in the urban dry forest fragment studied
| Species | N | P | Ca | Mg | K |
|---|---|---|---|---|---|
| A. niopoides | 6.2±0.7a (127.0) | 0.2±0.0a (127.1) | 4.7±0.5a (129.3) | 0.5±0.0a (129.3) | 1.3±0.1a (135.4) |
| M. milleflorum | 7.7±0.4b (62.2) | 0.3±0.0a (67.7) | 18.7±1.1a (66.9) | 1.8±0.1a (66.0) | 2.8±0.2a (70.0) |
| C. alba | 14.4±0.9b (68.6) | 1.3±0.1b (68.6) | 36.0±2.5b (77.1) | 16.9±0.9b (60.1) | 15.8±0.9b (62.2) |
| Average | 9.4 | 0.6 | 19.8 | 6.4 | 6.6 |
Values in parentheses represent the coefficient of variation of the dominant species. Different letters indicate significant differences (Kruskal-Wallis test, P<0.05) among species.
Table 4 Mean values of leaf nutrient resorption (NR) and leaf nutrient use efficiency (NUE) for the dominant species in the urban dry forest fragment studied
| - | - | - | NR (%) | - | - |
|---|---|---|---|---|---|
| Species | N | P | Ca | Mg | K |
| A. niopoides | 33.23a | 7.14a | ---- | ---- | 27.78a |
| M. milleflorum | 35.21a | 23.06a | ---- | ---- | 21.95a |
| C. alba | 54.60b | 5.19b | ---- | ---- | 45.41a |
| - | - | - | NUE | - | - |
| Species | N | P | Ca | Mg | K |
| A. niopoides | 51.60a | 1207.26a | 52.02a | 538.13 a | 268.68a |
| M. milleflorum | 61.25a | 1538.46b | 26.80b | 271.37b | 224.88a |
| C. alba | 80.09b | 913.75c | 35.44c | 64.83c | 71.40b |
Different letters indicate significant differences among species (Test-Kruskal-Wallis, P<0.05).
Leaf litter decomposition: The RDM of C. alba and M. milleflorum showed an initial mass loss phase in the first 30 days, after which losses were equal to about 50 % of the initial mass litter placed in the litter-bags. After this period, slower mass loss occurred until the end of the experiment (day 183), when decomposition reached 80 % of the initial mass for C. alba and 70 % for M. milleflorum (Figure 2). No significant differences in the RDM through time (P > 0.05) were found among species.
The simple exponential model showed a good fit for C. alba but not for M. milleflorum. The decomposition rate was higher for C. alba (Table 5); consequently, a shorter leaf litter residence time was found for this species (t0.5 = 0.15 years and t0.99 = 1.0 years). This means that about 55 days and 365 days are needed to decompose 50 % and 99 % of the leaves of this species, respectively.
Leaf litter nutrient release: No significant differences were found between species in leaf litter nutrient release for any nutrient. Nevertheless, with the exception of K, residual amounts of nutrients were consistently lower for M. milleflorum during the study, indicating a higher nutrient release rate (Figure 3). For all nutrients, it was found a general net release pattern from the leaf litter. Most nutrient release for both species generally occurred within 30 days. At the end of the experiment, P losses higher than 80 % and 60 % of the initial P amount were found for M. milleflorum and C. alba, respectively. The maximum nutrient release rate was found for K, particularly in the first 30 days of the study, during which more than 90 % of the K amount in the litter bags was released for both species.
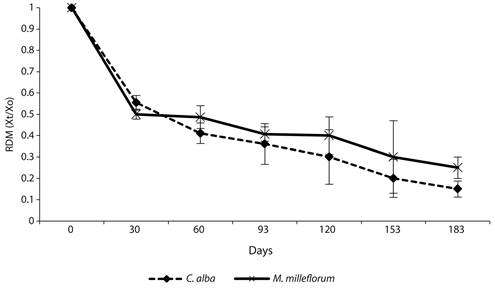
Figure 2 Residual dry mass (RDM: Xt/Xo) from leaf litter for the dominant species in the urban tropical dry forest fragment. Values are means (n=3), and bars indicate standard deviation.
Table 5 Litter decomposition models adjusted for residual dry mass of C. alba and M. milleflorum in the urban dry forest fragment
| Species | Model | k (1/year) | t 0.5 | t 0.99 | R2 | D-W |
|---|---|---|---|---|---|---|
| C. alba | 2*e-0.0124696*t | 4.6 | 0.1 | 1.0 | 83 | 1.2 |
| M. milleflorum | 2*e-0.00966381*t | 3.5 | 0.2 | 1.3 | 52 | 0.9 |
k: annual decomposition rate. R2: Coefficient of determination. D-W: Durbin-Watson statistic.
Discussion
The annual litterfall values obtained in the urban dry forest fragment studied were higher than those recorded in other successional tropical dry forests (0.9-6.8 Mg ha-1 y-1: (Descheemaeker et al., 2006; Kalácska, Calvo-Alvarado, & Sánchez-Azofeifa, 2005; Lawrence, 2005; Maass, Vose, Swank, & Martínez-Yrízar, 1995; Martinez-Yrizar & Sarukhan, 1990; Restrepo, Flórez, Osorio, & León, 2013), representing a valuable potential return of organic matter to these urban soils.
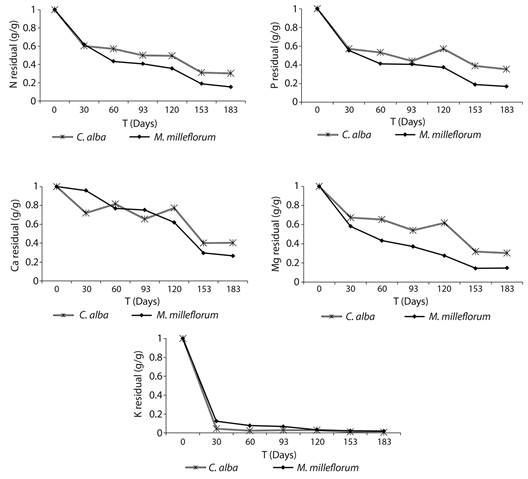
Figure 3 Residual amounts of nutrients in the decomposition of leaf litter of the dominant species in a fragment of urban tropical dry forest.
The leaf litter fraction accounted for approximately 55 % of total litterfall (Table 2). Similar values were recorded by Restrepo et al. (2013) in a dry successional forest (53 %) in Colombia. The clear dominance of the leaf litter fraction in fine litterfall found in this study suggests that it is a potential source of nutrients for improving soil dynamics, since the higher decomposition rate of this fraction represents a faster nutrient return path (León & Osorio, 2014). The highest annual leaf litterfall values were obtained in this study for C. alba; this species accounted for nearly 25 % of the total leaf litterfall (1 134 kg ha-1y-1), with its values two- and five-times higher than those of A. niopoides and M. milleflorum, respectively (Table 2).
In contrast to the findings for A. niopoides, leaf litterfall of C. alba and M. milleflorum did not markedly depend on rainfall, and their contributions were more permanent throughout the year. The provision of this permanent energy source to the soil microbiota could have a positive effect on ecosystem functioning and resilience. This issue is fundamental to urban planning, since the correct selection of tree species for use in restoration initiatives in urban greening will enable the achievement of objectives associated with the maintenance or restoration of ecosystem functions (Ramírez et al., 2014).
On the other hand, from the perspective of ecological restoration, the production of reproductive material in urban forest fragments such as the one studied here, favors the possibility of generating natural regeneration cohorts for species that reach reproductive maturity, thus, allowing the succession process to advance. The peaks of fall of reproductive material in this study showed no synchrony among the dominant species in the forest fragment (Figure 1c); however some degree of differential association with the rain was observed for each of them, as well as for all the other species (RO), which likely reflects the reproductive strategy of the species, as it could be represented by the ocurrence of a phenophase (Aronson, Kigel, Shmida, & Klein, 1992). This situation implies the existence of a seed bank that is potentially available for forest regeneration throughout the year, thus enhancing structural diversity and spatial variability in tree seedling regeneration (Ares, Neill, & Puettmann, 2010).
It is widely recognized that in tropical forests, fine litterfall represents a key process that determines the potential return of organic matter and nutrients to the soil, thus supporting plant development and soil biota (Norgrove & Hauser, 2000; Dutta & Agrawal, 2001). However, during the litter decomposition process these inputs must be considered as potential returns (Restrepo et al., 2013). In fact, the rates at which litter decomposition and subsequent nutrient release occur constitute the main factors for ecosystem functioning (León & Osorio, 2014). Through litter decomposition and associated nutrient release, vegetation can contribute to improving soil quality by inducing ecological and physicochemical changes in the soil (Garten, 2002; Singh, Singh, Kuppusamy, & Vala, 2002). This potentially represents a remarkable function for supporting ecosystem services in urban environments. Consistent with the above, in this urban dry tropical forest fragment, we not only found high rates of organic matter and nutrient return through leaf litter (Table 2 and Table 3), but also high decomposition rates and net release patterns for most nutrients (Table 5 and Figure 3).
In fact, the potential values of nutrient return through leaf litter were clearly higher than those recorded by Restrepo et al. (2013) for a successional tropical dry forest and a plantation of Azadirachta indica (N: 0.20-0.44, P: 0.005-0.02, Ca: 0.39-0.76, Mg: 0.07-0.25, K: 0.04-0.09). Similarly, the decomposition constants (k) obtained in this study were located near the upper limit of the interval corresponding to tropical dry forests from other studies (k = 0.1-4.8: Dutta & Agrawal, 2001; Singh, Singh, & Tripathi, 1999; Sundarapandian & Swamy, 1999; Singh, Dutta, & Agrawal, 2004; Martínez-Yrízar, Núñez, & Búrquez, 2007; Tripathi, Deora, & Singh 2013).
It has been suggested (Brinson, Lugo, & Brown, 1981; Vitousek, Turner, Parton, & Sanford, 1994) that decay rates are higher in tropical lowland forests because high temperatures and rapid succession processes favor the activity of microbiota involved in litter decomposition. Thus, from the k values obtained for both species (Table 5), and their respective leaf litterfall values (Table 2), very high annual returns of organic matter may be reached after leaf litter decomposition: 1 122 kg ha-1 for C. alba and 460 kg ha-1 for M. milleflorum.
Nevertheless, water availability is a limiting factor in dry ecosystems for the development and growth of vegetation. The mass loss and nutrient release patterns found in this study were similar to those that have been reported for a wide variety of ecosystem types (León & Osorio, 2014). Thus, there was an initial phase of very rapid mass loss, during which degradation and washing of more soluble compounds occurred, followed by a second phase of slower mass loss, caused by recalcitrant compound remnants in the decomposing material (Castellanos-Barliza & León-Peláez, 2011; Goma-Tchimbakala & Bernhard-Reversat, 2006). However, the direct relationship found between precipitation and weight loss in this study is noteworthy (r-Spearman: 0.49). This has also been reported for other tropical dry forests (Restrepo et al., 2013; Anaya, Jaramillo, Martínez-Yrízar, & García-Oliva, 2012), which could reflect the favorable effect of precipitation in these dry environments, as a source of moisture for the decomposer microorganisms that promotes litter decomposition, as well as for washing out of water-soluble compounds and nutrients.
Although the apparent high soil P availability in this forest fragment (230 mg kg-1 P, Table 1), the N/P ratio for the leaf litter of the three species (A. niopoides = 31, M. milleflorum = 25, C. alba = 12) indicated some degree of P limitation. This limitation derives from the soil P extraction method (Bray II) in the laboratory, which strongly acidifies the soil sample and overestimates plant-available soil P in this alkaline soil. It is known that phosphate ions readily precipitate with metal cations, forming a range of P minerals, which primarily depend on soil pH. In neutral to alkaline soils, P ions will instead precipitate as Ca phosphates, including dicalcium or octacalcium phosphates, hydroxyapatite and, occasionally, least soluble apatites (Hinsinger, 2001). Indeed, the N/P ratio values for A. niopoides and M. milleflorum leaf litter were higher than the critical value of 12 reported for the leaf litterfall (Aerts, 1997). This suggests some degree of P shortage for decomposers, since in fungal and bacterial cells this ratio is around 10-15, promoting the biological immobilization of this nutrient (Castellanos-Barliza & León-Peláez, 2011).
Of the three species studied, C. alba presented the least restriction due to the low soil P availability; this species had both the highest decomposition rate (Figure 2) and the highest amount of P released at the end of the experiment (Figure 3). Furthermore, the lowest leaf P resorption and P use efficiency were obtained for this species (Table 4). On the other hand, this species showed greater nitrogen dependence than M. milleflorum and A. niopoides, which are leguminous species. Thus, lower N release and the development of nutrient conservation strategies were observed in the decomposing litter of C. alba; this was reflected in higher values of leaf N resorption and N use efficiency.
In regard to the separate study of each of the three species, C. alba was notable for its effective contribution to the biogeochemical cycle, since the highest values of organic matter and nutrient return through leaf litter production and decomposition were obtained for this species. This species also showed an efficient use of the N in the site (NUE: 81 y NR: 54 %). The species that played the second-most important role in the biogeochemical cycle, after C. alba, was found to be M. milleflorum. For both species, their high litterfall values, nutrient inputs and decomposition rates represent significant contributions of organic matter and nutrients to the soil, and serve as a primary energy source for soil microbiota. Consequently, these species have been proposed for incorporation into future vegetation plans and programs in tropical dry weather urban environments.
Our findings regarding nutrient cycling at the ecosystem level in this urban dry forest fragment matches the general pattern described in the literature for nutrient cycling during the early stages of succession in secondary forests (Lugo, 1992; Guariguata & Ostertag, 2001). This is characterized by rapid nutrient accumulation accompanied by high nutrient turnover rates (high litterfall and leaf decomposition rates). These large inputs of organic matter and nutrients released from the litter can help improve the physical and chemical soil properties and biological activity, thus creating the necessary conditions for the establishment of other plant species (León & Osorio, 2014).
From a functional point of view, the development of this successional dry forest fragment within the urban matrix, represents a source of provision of ecosystem services in these human-dominated landscapes (Colding, 2011). Furthermore, the contribution of reproductive material via fine litterfall can generate a potential seed bank for tree regeneration and the expansion of the forest fragment, since seed dispersal by animals is the predominant form of propagule dissemination and has the potential to facilitate vegetation recolonization near the original site and in more remote sites (Wunderle, 1997). This could be notable in urban areas, since the green spaces in these environments are not usually connected, or connectivity is greatly reduced (Whitford, Ennosa, & Handley, 2001). This often results in fragmentation, which affects ecological processes that require connectivity, such as nutrient cycling and biological diversity maintenance (Leitão & Ahern, 2002).
The biogeochemical cycle monitoring carried out in this urban dry forest fragment revealed some important aspects of the functioning of an ecosystem as seriously threatened as the tropical dry forest (Flórez-Flórez et al., 2013). The complexity of the processes studied in this successional ecosystem indicate its importance for territorial planning bodies looking to implement passive restoration initiatives (Restrepo et al., 2013) aimed at producing more sustainable cities. It could be advantageous to incorporate urban spaces with the appropriate characteristics for the implementation of such passive restoration strategies into the urban mosaic as green infrastructure. This would contribute to improving connectivity with other consolidated urban green areas. Active restoration strategies might also be considered (Flórez-Flórez et al., 2013), since human intervention is sometimes needed to promote the advancement of natural succession and, thus, increased ecosystem complexity.
The monitoring biogeochemical cycles through fine litterfall could serve as a possible indicator of the ecosystem services provided by urban green spaces. This is the basis for evaluating and providing feedback on the planning and management process. However, it is essential for such monitoring efforts to be consistent and to meet the needs of the urban land management system that requires the information resulting from these efforts.

