


 Inglés (pdf)
 Articulo en XML
 Referencias del artículo
 Enviar articulo por email
 Citado por SciELO
  Similares en
SciELO
Similares en
SciELO  uBio
uBio 
 Permalink
The guidelines for fishing regulations and the preservation of resources are based on the biological and ecological knowledge of the target species. However, the efficient design of these guidelines depends greatly on the available information regarding the basic levels (that comprise) of biodiversity within a species, such as the genetic diversity, population structure, and interaction with other populations (Gray, 1997; Palumbi, 2003; Kenchington, Heino, & Nielsen, 2003). Therefore, its inclusion in management plans is essential for the identification of conservation entities (Roberts, 1997).
Marine fishing resources are often managed under the assumption of panmixia, taking into account that their populations are genetically homogenous due to: i) the absence of geographical barriers, ii) the capacity for dispersion, iii) the tendency to have large population numbers, iv) and the migrations which influence the low level of genetic drift, delaying differentiation amongst populations (Ward, Woodwark, & Skibinski, 1994; Nesbø, Rueness, Iversen, Skagen, & Jakobsen, 2000). Despite all this, evidence of intraspecific differentiation has been found, in which environmental limits and historical phenomena have impeded genetic flow, giving rise to population structuring (Bohonak, 1999; Jolly, Jollivet, Gentil, Thiebaut, & Viard, 2005). These regional tendencies have been supported by analysis of nuclear and mitochondrial DNA, and alloenzymes (Taylor & Hellberg, 2003; Baums, Miller, & Hellberg, 2005).
Among the fishing resources of great importance in the artisanal fishing sector of the Colombian Caribbean, the crevalle jack (Caranx hippos) stands out; artisanal fishers have aroused an interest in this resource, as an increase in its catch has been evident, with figures passing from 44 tons in 2007 to 167 tons in 2011 (Caiafa-Hernández, Narvaéz-Barandica, & Borrero-Flórez, 2011; MADR & CCI, 2012). R49migratory species is known to form shoals, with a geographical distribution that extends from Portugal in the Eastern Atlantic to Angola, including the Western Mediterranean, the East from Nova Scotia to Uruguay and the Greater Antilles (Robins & Ray, 1986; Cervigón, 1993). Very little information is available concerning larval behavior. Cha, McGowan and Richards (1994) sampled fish larvae off the Florida Keys and found that 92.4 % of the carangid larvae occurred in the upper 25 m of the water column, and 100 % occurred in the upper 50 m (Fernández-Cordeiro & Bañon-Díaz, 1997). Posada and Sandoval (2007) studied the reproductive aspects of C. hippos in Bocas de Ceniza (Atlántico), estimating absolute fertility rates between 3 304 700 and 4 975 000 eggs per gonad. They concluded that this species completes its annual reproductive cycle with two spawning periods in January-February and June-July, and that it is a continuous multi-portioned asynchronous spawner. They have also found that a high number of small eggs are liberated in each spawning, as a reproductive strategy for a fast population reposition.
On the other hand, Caiafa et al. (2011) evaluated the biological aspects and the population dynamics of C. hippos in Bocas de Ceniza, finding that a fork length-weight relationship showed differences between genders; L50 % was estimated at 63.6 cm fork length (FL). Growth parameter values were: L∞ = 91 cm FL, K = 0.38 year-1and to = 0.32 year-1. Besides, total mortality rate was estimated as 1.85 year-1, fishing mortality as0.72 year-1, natural mortality as 1.13 year-1, and the exploitation rate as 0.31 year-1. Nonetheless, the most worrying aspect of this situation is that, both fingerlings and adults, are currently targets of capture, and that an intense pressure is over the fraction of the population that has not yet reached sexual maturity, as well as the fraction that is already in reproductive stages, indicating that it may be vulnerable to overexploitation. Therefore, there is need to develop strategies for its management and conservation. This way, and due to this requirement, two questions arose: 1) how many populations of crevalle jack are there in the Colombian Caribbean? and 2) is there a geographical pattern in the variability and genetic structure that could be associated to the evolutionary history of the species? For this, we used two molecular markers: the hypervariable domain of the control region, and the cytochrome oxidase I (COI) region in samples collected along different sectors of the Colombian Caribbean.
Materials and methods
Collection of samples and DNA extraction: A total of195 samples of fish muscle were collected in the Colombian Caribbean during the years 2011-2013. DNA was extracted and amplified as follows: 18 in Cartagena, 25 in Barranquilla, 25 in Santa Marta, 25 in San Antero, 27 in Turbo and 33 in La Guajira, all taken, for a total of 153 muscle tissue samples from the caudal peduncle. Collected tissue samples were preserved in vials with 90% ethyl alcohol and placed in a refrigerator at 4 °C, at Magdalena University. DNA was extracted using the commercial DNA Extraction Kit MasterPure™ from Epicentre Biotechnologies. The amplification of the control region was performed using the primers tRNA T1-Dl-F: 5’-CAGAAAAAGGAGACTCTAACTCCTAAA-3’and tRNA T1-Dl-F2:5’-CAGAAAAAGGAGACTCTAACTCCT-3’, proposed forTrachurus murphyi(Shubina, Ponomareva, & Glubokov, 2008). The coding fragment for COI was amplified with the initiators proposed by Ward, Zemlak, Innes, Last and Hebert (2005) for the identification of teleost fish: CHipF: 5’-TCAACCAACCACAAAGACATTGGCAC-3’ and CHipR: 5’-ACTTCAGGGTGACCGAAGAATCAGAA-3’.
The polymerase chain reaction (PCR) in both regions was carried out in a final reaction volume of 25 μL, adding 1.25 μL of MgCl (50 mmol/L), 5 μL Buffer (5X), 0.5 μL of dNTPs (10 mmol/L), 0.25 μL of each primer (10 mmol/L), 0.5 μL Taq DNA polymerase (5 U), and 2 μL of ADN. The PCR was carried out in an ESCO Swift ™ MaxPro thermocycler under the following conditions: for the control region, denaturing at 95 °C for 5 min, followed by 35 cycles of denaturing at 94 °C for 30 s, alignment at 50.4 °C for 45 s and extension at 72 °C for 45 s, finishing with an extension at 72 °C for 10 min. In the case of COI, a first step of denaturing was applied at 95 °C for 2 min, as well as 35 cycles as following: denaturing at 94 °C for 30 s, alignment at 51°C for 30 s and extension at 72°C for 1 min, with a final step at 72 °C for 10 min. Amplification was confirmed by means of agarose gel electrophoresis at 2 %. The products between 30-50 ng/μL of DNA were purified and sequenced in Macrogen Inc.
Genetic diversity and genealogical relationships of haplotypes: The electropherograms of each of the control region sequences and COI were edited with the program ProSeq v. 3. Afterwards, these were aligned using the CLUSTAL W algorithm present in the computer program MEGA 5.0 (Tamura et al., 2011). To minimize the homologies amongst haplotypes a penalty of 15 for each gap and six for each extension was applied, as proposed by Sivasundar, Eldredge and Orti (2001). The obtained alignment was reviewed visually and its length homogenized.
The nucleotide (π) and haplotype (Hd) diversity was calculated using the method proposed by Nei (1987) in the computer program DnaSP 5.10.01 (Rozas, Sanchez-Delbarrio, Messeguer, & Rozas, 2010). Networks of maximal parsimony were constructed, using the Median-Joining method implemented in the software NETWORK 4.6, with the aim of determining the genealogical relationships among haplotypes. We included in the analysis seven sequences published for COI from Brazil and three from Mexico and were compared with the haplotypes found in the Colombian Caribbean in this investigation for evaluate the relationship among haplotypes from another geographic region.
Genetic structure: The genetic differentiation of the populations was evaluated by means of an Analysis of Molecular Variation (AMOVA) using the computer program Arlequin Ver 3.0 (Excoffier, Laval, & Schneider, 2005). For both markers, the evolutionary model of nucleotide substitution was determined using the software Modeltest 2.3 (Posada & Crandall, 1998), executed in PAUP 4.0 (Swofford, 2002). The program indicated that the model that best fits to evolution of sequences for COI was GTR with a correction factor of Gamma= 0. However, since in Arlequin this model is not included, the Tamura and Nei model was used.
Tamura and Nei model estimates the number of transitional and transversional substitutions per site, as well as the total number of nucleotide substitutions (Tamura & Nei, 1993; Excoffier & Lischer, 2015). In this , excess transitions, unequal nucleotide frequencies, and variation of substitution rate among different sites were all considered. For the case of the control region, the evolutionary model was GTR+G and Gamma=0, also using the model of Tamura and Nei in Arlequin.
Two groups were assumed for AMOVA analyses as follows: The first comprising the samples from the Southwest sector (Tolú, San Antero and Cartagena), and the second one, from the samples collected in the Northeast of the Colombian Caribbean (Barranquilla, Santa Marta, and Riohacha). The minimal distance between the two sectors is about 130 km. It is noteworthy that these areas are influenced by the delta of the Magdalena River, which ends at Bocas de Ceniza, Atlántico. The assignation of these groups was based in geomorphological features given by the river.
To test if the populations of C. hippos follow a pattern of isolation by distance, a correlation analysis among the values of Φst and the geographical distance estimated in Google Earth was performed (Aguirre-Pabón, Narváez Barandica, & Castro García, 2013). The statistical significance was quantified by means of the non-parametric test Mantel after 10 000 permutations in Arlequin Ver 3.0 (Excofer, Smouse, & Quattro, 1992).
Demographic history of the populations: To measure the effect of demographic changes on the DNA sequences of the population, we developed the Neutrality tests Tajima’s D (1989) and Fu’ Fs (1997). Tajimas’ D compares two estimates of mutation parameters (θ) being from a non-coding region that is not exposed to selection. Significant values of D may occur owing to expansion processes, bottlenecks and selection, in conditions where there has been no selective advantage among haplotypes (Rand, 1996; Aguirre-Pabon et al., 2013). The Fu’Fs test compares the number of haplotypes observed with the number of haplotypes expected in a random sample under the assumption of an infinite model without recombination. This test is more sensitive to demographic expansion, usually showing negative values (Fu, 1997). The distribution of paired differences between sequences (mismatch distribution) as implemented in Arlequin 3.4 was used. This method assumed that changes in population size leave signals in DNA sequences, where populations in balance show a multimodal trend in the distribution of frequencies, and those undergoing a demographic expansion show unimodal behavior (Rogers & Harpending, 1992).
Results
Genetic diversity and haplotype genealogical relationships: From the 153 samples processed, we considered 119 for the control region and 132 for the COI; the rest were not used because the sequences were low quality. Both markers resulted in a final alignment of 520 (CR) and 1 014 bp (COI), including the insertion-deletion events and the gaps inserted. For the control region, 116 haplotypes were recognized, with 21 for COI; the number of parsimonious informative sites for these regions was 285 and 20, respectively. The DNA sequences analyzed showed a high percentage of AT links for both markers (CR = 61.34 % and COI =56.19 %) being the nucleotide composition in the control region A =31.26 %, T = 30.08 %, C = 22.47 %, and G = 16.18 %. For COI it was A = 24.42 %, C = 17.90 %, G = 25.91 %, and T = 31.77 %. The sequence analyses showed for the CR 113 unique haplotypes distributed in the six sampling sites, of which three were shared between Barranquilla, Cartagena and San Antero.
In the case of COI, two dominant haplotypes were observed in each site and they were the same between all places, ten were unique, and nine were shared but with very low frequency (Figure 1). Considering all sampled populations, Barranquilla and Riohacha presented the highest number of haplotypes. The estimated haplotype diversity (Hd) with COI presented relatively high value with an average of 0.685 ± 0.001 of standard deviation, whilst nucleotide diversity (π) was low (0.01 ± 0.000014). High values were estimated for Hd (0.999 ± 0.0004), and π (0.105 ± 0.0004) for the mitochondrial control region (Table 1).
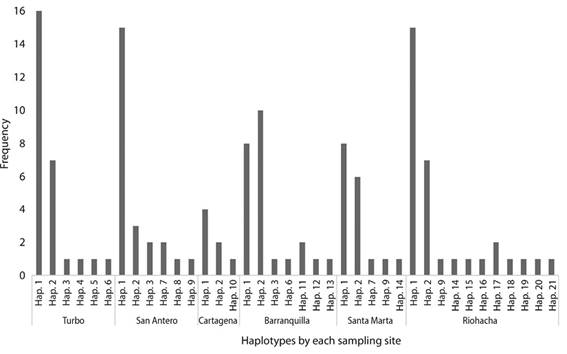
Table 1: Diversity indices per population and the total for the marker Cytochrome Oxidase I and for the Control Region of C. hippos
| COI | ||||||||
|---|---|---|---|---|---|---|---|---|
| Sampled sites | N | H | Hd | π | Tajima D | P | Fu´s FS | P |
| Turbo | 27 | 6 | 0.598±0.085 | 0.0085±0.004 | 1,323 | 0,91 | 3,029 | 0,897 |
| San Antero | 24 | 6 | 0.601±0.108 | 0.0068±0.003 | -0,089 | 0,527 | 1,714 | 0,808 |
| Cartagena | 7 | 3 | 0.667±0.159 | 0.0106±0.006 | 1,77 | 0,971 | 3,759 | 0,944 |
| Barranquilla | 24 | 7 | 0.732±0.064 | 0.0096±0.005 | 1,087 | 0,89 | 2,15 | 0,854 |
| Santa Marta | 17 | 5 | 0.684±0.080 | 0.010±0.005 | 1,239 | 0,911 | 3,479 | 0,933 |
| Riohacha | 33 | 12 | 0.771±0.063 | 0.012±0.006 | -0,478 | 0,388 | 0,589 | 0,635 |
| Total | 132 | 21 | 0.685±0.001 | 0.01±0.000014 | 0,808 | 0,766 | 2,453 | 0,845 |
| Linage A | - | - | - | - | -2,212 | 0,03 | -5,351 | 0,014 |
| Linage B | - | - | - | - | -1,875 | 0,03 | -5,891 | 0,000 |
| Control region | ||||||||
| Sampled sites | N | H | Hd | π | Tajima D | P | Fu´s FS | P |
| Turbo | 23 | 23 | 1±0.012 | 0.138±0.068 | 0,382 | 0,715 | -1,634 | 0,131 |
| San Antero | 23 | 23 | 1±0.012 | 0.097±0.048 | -0,72 | 0,261 | -2,438 | 0,076 |
| Cartagena | 7 | 7 | 1±0.076 | 0.167±0.094 | 1,036 | 0,880 | 1,976 | 0,492 |
| Barranquilla | 20 | 18 | 0.989±0.019 | 0.161±0.080 | 0,933 | 0,861 | 2,257 | 0,819 |
| Santa Marta | 15 | 15 | 1±0.024 | 0.147±0.074 | 0,770 | 0,827 | -0,070 | 0,321 |
| Riohacha | 31 | 31 | 1±0.008 | 0.156±0.076 | 0,915 | 0,862 | -2,815 | 0,072 |
| General | 119 | 116 | 0.999±0.0004 | 0.105±0.0004 | 0,552 | 0,734 | -0,454 | 0,318 |
| Linage A | - | - | - | - | -1,467 | 0,005 | -9,96 | 0,009 |
| Linage B | - | - | - | - | -1,781 | 0,01 | -24,244 | 0,000 |
| *N: number of samples | ||||||||
*Hd: Haplotype diversity, π: nucleotide diversity, H: Number of haplotypes, D: Tajima’s Neutrality test and Fu’s Fs per population and per lineage.
To identify the existing relationship between the haplotypes found, a network of haplotypes with their markers was constructed. The network of haplotypes with COI, revealed the presence of two groups of haplotypes separated by seven mutational steps and different topologies: one with haplotype 1 which was the most frequent associated with other haplotypes by a mutational step. In the second group, haplotype 2 was the most frequent and it was found to be associated with others by a mutational step (Figure 2). Considering that the network showed individuals from each site in both groups, our results suggest that the relationship between haplotypes is not associated to the geography of the area.
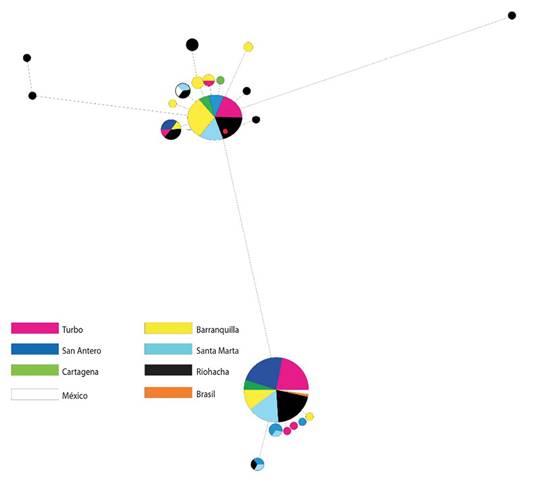
Figure 2: Haplotype network constructed by the median joining method for 138 sequences of cytochrome oxidase I. The circles each represent a different haplotype. The size of the circles is proportional to their frequency.
The network constructed using the sequences from Brazil and Mexico demonstrated that Brazilian haplotypes can be found distributed in the two topologies identified for the Colombian Caribbean; whilst for Mexico only H_1 was common (Figure 2). In the haplotype network with control region, two lineages were also evident, although a geographical pattern could not be defined (Figure 3).
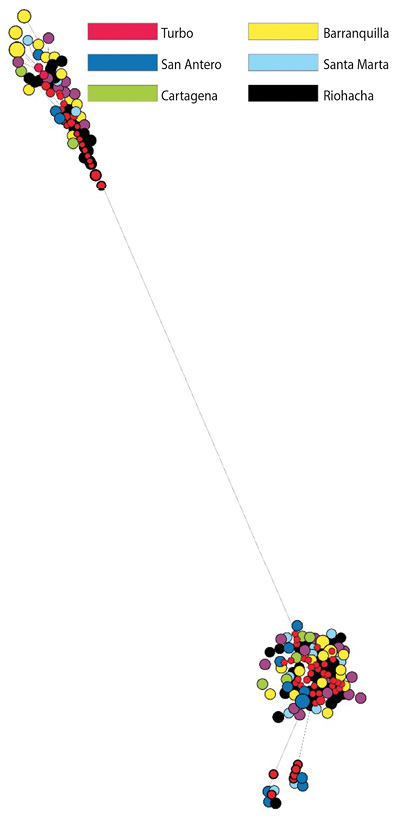
Figure 3: Haplotype network constructed by the median joining method for 119 sequences of control region. The circles each represent a different haplotype. The size of the circles is proportional to their frequency.
Genetic structure: The AMOVA with RC and COI revealed that there are not two C. hippos populations in the Colombian Caribbean, indicating that the fish collected in the localities grouped towards the Southwest do not genetically differentiate from the Northeast, (RC Fct = 0.065, P > 0.05; RC Fsc = 0.01, P > 0.05; COI Fct = 0.088, P > 0.05; COI Fsc = -0.005, P > 0.05) (Table 2). To corroborate this, Mantel’s test was performed with the aim of determining if there exists some pattern of isolation due to geographical distance. The results for each of the markers employed showed that there is not a significant relationship (Figure 4A and 4B). Therefore, a model for isolation due to distance was not presented, and the relationship is deemed as being random chance.
Table 2: Values for Fst paired with the control region and Cytochrome Oxidase I markers, using Tamura-Nei’s distance method among the sampling sites in the Colombian Caribbean, considering C. hippos as a single population
| Sampled sites | Turbo | San Antero | Cartagena | Barranquilla | Santa Marta | Riohacha | |||||||
| Control region | COI | Control region | COI | Control region | COI | Control region | COI | Control region | COI | Control region | COI | ||
| Turbo | 0 | 0 | |||||||||||
| San Antero | 0.022 | 0.005 | 0 | 0 | |||||||||
| Cartagena | -0.039 | -0.069 | 0.091 | 0.041 | 0 | 0 | |||||||
| Barranquilla | 0.096 | 0.114* | 0.2523* | 0.259* | -0.030 | -0.020 | 0 | 0 | |||||
| Santa Marta | -0.028 | -0.032 | 0.042 | 0.050 | -0.081 | -0.104 | 0.05138 | 0.033 | 0 | 0 | |||
| Riohacha | 0.016 | 0.034 | 0.14247* | 0.137* | -0.059 | -0.069 | -0.00047 | -0.013 | -0.0104 | -0.019 | 0 | 0 | |
| P value <0.05 | |||||||||||||
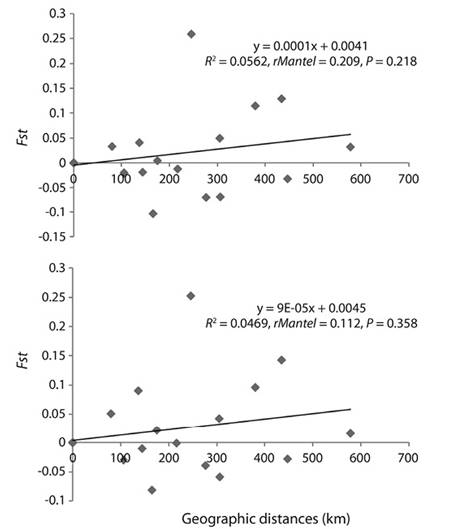
Figure 4: Correlation between the genetic differentiations (Fst) and the geographical distances among sites of study, using the markers A) Cytochrome Oxidase I and B) control region for Caranx hippos.
Demographic history of the populations: For the control region, Tajima’s D and Fu’s FS tests showed that the values did not significantly differ from zero, (D = 0.552, P > 0.05 and Fu = -0.454, P > 0.02), meaning that the null hypothesis of neutrality cannot be rejected, as there is no selection pressure on them (Table 1). This analysis was also carried out for each of the identified lineages, with significant differences from zero observed (D: P < 0.05; Fu: P < 0.02). Results suggest that the lineages may have undergone a process of population expansion after a bottleneck event, which is evidenced by the high number of unique haplotypes. The distribution mismatch for both lineages presented a unimodal curve (R2 = 0.000, P ≤ 0.056, and R2 = 0.000, P ≤ 0.046, respectively), and a population expansion model (Figure 5).
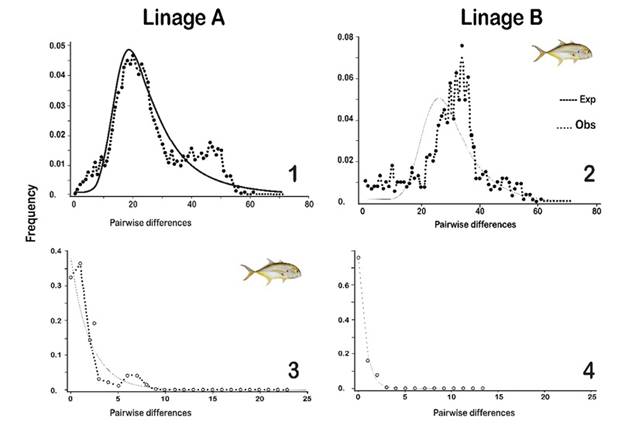
Figure 5: Distribution of paired differences (Mismatch distribution) for Linage A and Linage B with sequences of control region (1 and 2) and COI (3 and 4) for Caranx hippos found for a model of population growth. The solid and dotted lines represent the expected and the observed distribution respectively.
Regarding the COI marker, the analyzed sites did not show significant differences from zero (D: P > 0.05 and Fu: P > 0.02), leading to the assumption that there is no evidence of size change in the population. This way, there would be a neutral equilibrium in which most evolutionary changes are due to genetic drift (Table 1). Using this marker, a neutrality analysis was carried out for each of the lineages found, where values significantly different from zero were observed (D: P < 0.05 and Fu: P < 0.02). The comparisons of the frequency of paired differences, both observed and expected (mismatch), showed a population expansion model for lineage A (R2= 0.018, P ≤ 0.047) only, while for lineage B, it should not be referred to as a process of expansion since the curve for linage B differed significantly from what was expected (Figure 5).
Discussion
The haplotype diversity results obtained are high and consistent with what has been described for some species belonging to the Carangidae family. For example, Karaiskou, Triantafyllidis and Triantaphyllidis (2004), in their analysis carried out with region control for Trachurus trachurus, observed values of Hd between 0.64 and 0.89 for samples taken in the Aegean, Ionian, Tyrrhenian, and Balearic Seas, Portugal, Biscay gulf and the North Sea. Whereas Comesaña, Martínez and Sanjuan (2008), looking at the same species in the same study area, estimated an Hd of between 0.95 and 0.97. Karaiskou, Triantafyllidis and Triantaphyllidis (2004) recorded values of Hd for T. Mediterraneus between 0.73 and 0.82, and for T. piaractus between 0.77 and 0.92 with data having variations by area. Meanwhile, Santos, Xiang and Tagawa (2010) documented a value of Hd = 0.69 for Caranx ignobilis and C. melampygus in the Hawaiian Islands by means of mitochondrial DNA extraction codified for ATPase 6 and ATPase 8.
Bucklin and Wiebe (1998) and Abaunza et al. (2003) documented the occurrence of high diversity values which could be due to the high size of populations of the marine organisms, especially those which are long-living, as this allows them to reach abundance. Eventually, this may be the case forC. hippos, as it is a long-living species, with a maximum registered age of 14 years in the Colombian Caribbean, achieved with a relatively low growth rate of 0.38 year-1(Caiafa-Hernández et al., 2011).
The mitochondrial markers, given their high rate of substitution of bases in comparison to nuclear DNA, allow inferences as to the historical and demographical processes that have molded the genetic structure of populations (Avise et al., 1987; Brown, George, & Wilson, 1979; Vawter & Brown, 1986; Wolfe, Li, & Sharp, 1987). The high values of haplotype and nucleotide diversity found for the region control are typical of stable populations with a long evolutionary history, or also those species which demonstrate a secondary link between populations that were geographically isolated, and which also suffered a posterior process of expansion. This last point concurs with previous data by Comesaña et al. (2008) for T. trachurus and by Santos et al. (2010) for C. ignobilis and C. melampygus. COI in this study would confirm this second premise as it shows that C. Hippos experienced an event that caused the drastic reduction in their population (bottleneck) and posteriorly it experienced a rapid growth period with the consequent accumulation of mutations (Grant & Bowen, 1998). This very event was recorded for T. mediterraneus, T. picturatus and T. trachurus (Karaiskou et al., 2004).
The results of the haplotype network with both markers suggest the existence of two topologies that do not demonstrate a geographical association; as such, it can be inferred that for C. hippos there are two cohabiting lineages. This is even more evident with the network of haplotypes that involve sequences from Brazil and Mexico, as the two lineages are also found distributed in these two regions, in turn strengthening the premise that this species is not specifically defined as being from one geographical region. This fact may be favored by biological and ecological factors, such as migration and high dispersal capacity, dimensioning of a limited geographical area, and by environmental aspects such as the occurrence of marine currents, all of which together favors gene flow.
Based on the idea that COI by being a region of conservation reflects events older than those of the control region, with the latter being the portion of mitochondrial DNA with the highest rate of evolution (Avise et al., 1987; Caccone, García, & Powell, 1996), it is proposed that C. hippos was comprised of a single population that, for some environmental or geographical reason, was decimated and fragmented giving rise to two genetic lineages. Nonetheless, these lineages did not last long enough in order to differentiate themselves and thus there was subsequent new population contact through a process of expansion, evidenced by the coexistence of the two topologies identified in this study. The former can be backed up by the results of the neutrality test and the mismatch curves, in which evidence of rapid population growth was found for each lineage. Bottlenecks followed by demographic expansions leave a genetic fingerprint on the existing populations in the form of an apparent equilibrium between mutation and genetic drift. Due to this, some haplotypes with high sharing frequency are usually observed, whilst others, less frequent, are also seen which differ by only a few mutations (Bas, 1995).
In line with the above, these events of population contraction and expansion could be thought to be associated with the strong climatic oscillations that occurred in the Pleistocene era, when the glaciation periods affected the populations in turn leading to a decrease in size, followed by a rapid increase. This is based in the idea that the frequency of the oscillations of that period has had a strong influence on the distribution and structure of the species (Hewitt, 2000; Rohfritsch & Borsa, 2005).
Additionally, environmental and oceanographic aspects can favor this pattern, among which seasonal winds and marine currents are emphasized (Landínez-García, Ospina-Guerrero, Rodríguez-Castro, Arango, & Márquez, 2009). In the Caribbean Sea there are two types of seasonal marine currents that influence gene flow and consequently the amalgam of lineages, namely the surface and upwelling currents. Among the first there are two main currents which alternatively go along the edge of the coastal sector of Colombia. One in an East-West direction, called the Caribbean Current (Jimeno, 1994), which may be displacing larvae originating from Venezuela and Brazil; and the other is the Southeast-Northeast current, known as the Panama-Colombia Countercurrent, which is believed to drag larvae from Panama or even Central America. Added to this is the fact that the currents favor migratory processes in which the individuals from the Gulf of Mexico may be able to be displaced towards Colombia, as was inferred in the haplotype network previously discussed. It is worth noting that both currents follow the dominant wind patterns of the season; the Caribbean Current follows the Trade Winds that come from the North-Northeast and the countercurrent follows the winds from the Southwest-West (Jimeno, 1994; Andrade-Amaya, 2001).
In terms of the Genetic Structure of the Population, one may infer that the fixation rates did not present a significant variation between groups or among sites, nor did they show a pattern of selective geographical distribution. This suggests that for the Colombian Caribbean there is a panmictic population of C. hippos, namely a group with genetic interchange in which random mating exists. This phenomenon may be commonly attributed to the high levels of gene flow due to high level of dispersion of the pelagic species from marine environments, as well as the fact that the marine areas are habitats almost without limits, and as such a constant interchange of migrants takes place (Àrnason & Palsson, 1996; Vis, Carr, Bowering, & Davidson, 1997). In summary, the gene flow between populations tends to reduce the differences between groups independently of genetic drift or the intensity of natural selection, meaning that if the flow is high, the populations will present a certain level of homogeneousness (Slatkin & Hudson, 1991).
In population differentiation processes of fish, it has been indicated that the absence of a population structure is due to surroundings that favor connectivity, as well as ecological, historical, and demographical factors (Borsa, 2003; Karaiskou et al., 2004; Cimmaruta, Bondanelli, Ruggi, & Nascetti, 2008; Landínez-García et al., 2009). Within these factors, the favoring of gene flow as a result of marine currents is highlighted (Landínez-García et al., 2009), along with the life history of the species, which in this case is that of a pelagic fish with a high dispersion capacity.
These results were corroborated by the geographic isolation tests, registering a low correlation between the genetic differences and the geographical distances. Nonetheless, it is important to emphasize that in this analysis, some paired differences were found between San Antero - Barranquilla and San Antero - La Guajira with COI and control region, added to which the difference between Turbo - Barranquilla is obtained. This can probably be explained by the highest number of unique haplotypes being found at these sites, which can be attributed to the displacement of individuals from other regions by marine currents. It is feasible that the unique haplotypes found in La Guajira are more aligned to the Brazilian populations, by means of the influence of the Caribbean Current, whilst those from Turbo and San Antero are more frequent in haplotypes originating from Panama, Costa Rica, and even Mexico. To corroborate this, it is necessary to widen the study, including samples from localities corresponding to the areas of distribution of each species, which would allow for the identification by management entities.

