


 English (pdf)
 Article in xml format
 Article references
 Send this article by e-mail
 Cited by SciELO
  Similars in
SciELO
Similars in
SciELO  uBio
uBio 
 Permalink
Science Citation Index (SCI) was known in the science community in 1955, and it is currently the cutting-edge tool to facilitate the dissemination and retrieval of scientific literature (Garfield, 2006). The SCI’s multidisciplinary catalogue is to achieve two objectives: i) to identify what each scientist have published, and ii) where and how often the papers by the scientist are cited (Garfield, 2007). For this reason, the author-based part in SCI journals is divided into the Source Author Index and the citation index. By inference, one can also determine what each institution and country has published, and how often their papers are cited. Web of Science (WoS) which is the SCI-EXPANDED’s electronic version can link the source author index and the citation index, and this way, author’s publication can be listed by chronology, by the journal, or by citation frequency using WoS. Furthermore, it is possible to search for scientists who have published over a given period of years using the mentioned tool (Garfield, 2009). Based on the above realization, scientists have embarked on bibliometric analysis to understand the nature and complexity of research activities.
Bibliometric analysis is therefore defined as the quantitative study of science, communication in science, and science policy (Sam, 2008; Milojević & Leydesdorff, 2013). It has been employed universally for quantification and assessment of the research output of researchers, research institution, academic institutions and countries (Aswathy & Gopikuttan, 2013; Noruzi & Abdekhoda, 2014). Generally, bibliometric analysis results are used for ranking, awarding, budgeting, and defining research priorities (Fakhree & Jouyban, 2011). Intellectually, publications are often regarded as those that the writers have in its scholastic, or the intellectual society and their publications are managed by renowned bodies with academic ambitions and task (Alemna, 2016). It additionally mentions that learned publications do not only offer research results thereby moving forward new facts, but their contents are subjected to careful inquiry by professionals in a given field.
Recently, peer-reviewed journals using Thomson Reuters Scientific indexing services have since become accepted as definitive evidence of research endeavors of scientists all over the world (Nwagwu & Egbon, 2011). The authors mentioned that the position of science in Africa has always been queried. They posed the following questions in their paper: i) Do scientists in Africa do research?, ii) Where and in what journals are their researches published?, and iii) What is the quality of the journals where these publications appear? Frankly, responding to the above queries require the availability of detailed evidence of research from the country in question. On the other hand, local databases infrastructures to give this picture do not exist, and current international databases are also unfair in the source selection processes. They generally leave out a lot of research outputs of researchers from the developing regions (Nwagwu & Egbon, 2011). This has gingered researchers from Africa to publish in journals with Thomson Reuters Scientific indexing services, in order to have their researches recognized by the existing international databases, and this has been executed perfectly well via research collaboration.
The whole of Africa’s research collaboration pattern, both regarding countries and cities, has been distinguished into three separate scientific regions, namely Northern, Western, and Southern-Eastern (Toivanen & Ponomariov, 2011). For comparison purpose, Africa’s contribution to the worldwide research literature has been computed (Tijssen, 2007). The scientific production component in the Southern Africa Development Community (SADC) was dealt with in this literature (Pouris, 2010). It was found in the literature that South Africa is responsible for 79 % of the regional production (Pouris & Pouris, 2009). They reported the results of an effort to calculate scientometric indicators-research publications and patents- for the African Continent, compared them with those of other regions and discussed their implications. Collaboration ties in Central Africa’s scientific output revealed that colonial and cultural ties play a major role in the international collaboration (Boshoff, 2009). Further research dealt with collaboration among the SADC countries as well as with the rest of Africa. It was concluded that South Africa acted as the political North, i.e., it dominated the regional scientific research (Boshoff, 2010).
Latest research works on bibliometric studies in Ghana include: Research focus and trends in nuclear science and technology in Ghana: A bibliometric study based on the INIS database (Agyeman & Bilson, 2015); a scientometric analysis of research performance of Ghanaian polytechnics (Lomatey, Abledu, Baayel, Akussah, & Botchway, 2016); research collaboration in Ghana: patterns, motives and roles (Owusu-Nimo & Boshoff, 2017). However, among these bibliometric studies presented so far, there is no comprehensive bibliometric analysis of Ghana publications in the Science Citation Index Expanded (SCI-EXPANDED) from 1936-2015. This research will, therefore, provide the following: names of authors, title, year of publication, source journals publishing the articles, contact address, and each year citation times for every publication in SCI-EXPANDED.
Materials and methods
Science Citation Index Expanded (SCI-EXPANDED) of Web of Science Core Collection of Thomson Reuters was used to collect the bibliographic data (Data last updated: July12th, 2016). An advanced search was conducted for documents with the phrase “Ghana” in the country field. Initially, 9 364 publications were identified, and these documents were published between 1958 and 2015. Document information included names of authors, title, year of publication, source journals publishing the articles, contact address, and each year citation times for every publication were downloaded into Microsoft Excel 2013, and additional coding was manually performed for origin country and institute of the collaborators, and impact factors of the publishing journals (Li & Ho, 2008). Besides, the reported impact factor (IF 2015) of each journal was obtained from the 2015 Journal Citation Report (JCR). The total number of times a document cited from the Web of Science Core Collection since its publication to the end of 2015 was recorded asTC 2015(Chuang, Wang, & Ho, 2011; Wang, Fu, & Ho, 2011). Likewise, C 2015, the total number of citations of a paper in 2015 only (Ho, 2012) were employed to characterize Ghana publications. Also, the citations per total publications (TP) since publication (CPP 2015=TC 2015/TP), was also used (Ho & Ho, 2015). Articles originating from England, Scotland, Northern Ireland, and Wales were reclassified as originating from the United Kingdom (UK). Affiliations in Hong Kong before 1997 were included in the China category, but as a separate region for consistency. Affiliations in Federal Republic of Germany (Fed Rep Ger), West Germany, Germany Democratic Republic and East Germany were checked to be in Germany (Ho, 2012). Affiliations in People’s Republic of the Congo (Congo People Rep) and Republic of the Congo (Rep Congo) were checked to be inRepublic of the Congo (Congo). Affiliations in Zaire were checked to be in Democratic Republic of the Congo (Dem Rep Congo) (Chuang, Chuang, Ho, & Ho, 2011). Affiliations in UKSSR were checked to be in Ukraine. Affiliations in Czechoslovakia were checked to be in Czech Republic (Czech Republic) (Ho, 2013). Affiliations in Greenland were checked to be in Denmark.
Results and discussion
Document type and language of publication: The distribution of the document type and language of publications identified by WoS were analyzed. Comparison of document types and their TC year and CPP year has been reported (Chuang, Olaiya, & Ho, 2012). A total of 9 364 Ghana publications with 13 document types in the SCI-EXPANDED from 1 958 to 2015 were found. Document type of review had the highestCPP 2015of 23 followed by proceedings paper withCPP 2015of 16. Article (7 375) was the most-frequently used document type comprising 79 % of the total publications, followed distantly by meeting abstracts (1 112; 12 %), letters (229; 2.4 %), editorial materials (220; 2.3 %), reviews (216; 2.3 %), proceedings papers (181; 1.9 %), and notes (147; 1.6 %). The others showing less significance were corrections (28; 0.30 %), news items (23; 0.25 %), book chapters (6; 0.064 %), book reviews (6; 0.064 %), discussion (5; 0.053 %), and reprints (3; 0.032 %). Similar results can also be found in tropical countries in Central America, for example, Costa Rica (Monge-Nájera& Ho, 2012) and Panama (Monge-Nájera & Ho, 2015) published 79 % and 82 % of full-length articles of the total publications, respectively. Journal articles were used for further analysis because they represented the majority of document types that also included whole research ideas and results (Ho, Satoh, & Lin, 2010).
The lucid dominance of full articles over other types of documents was not shocking, since Ghanaian researchers/lecturers are promoted based on number of full articles published in refereed journals and working experience. This enhances the salaries of the researchers, thus discouraging other types of work such as meeting abstracts, letters, editorial materials, reviews, proceedings papers, and notes.
An internationally collaborative review entitled “Allergic rhinitis and its impact on asthma (ARIA) 2008” (Bousquet et al., 2008) by 96 authors from 99 institutions in 40 countries was the most cited review withTC 2015of 1 316. This is the only one review withTC 2015> 1 000 in Ghana. Similarly, an editorial material entitled “Malaria: current status of control, diagnosis, treatment, and a proposed agenda for research and development” (Guerin et al., 2002) by nine authors from seven institutions in six countries was the most cited editorial material withTC 2015of 196.
Altogether, 7 375 articles were extracted from the 9 364 documents for further analyses. Almost all articles were published in English (7 358 articles; 99.76 % of 7 375 articles), 10 in French and seven in German. Nearly all Ghanaians speak English because Ghana was colonized by the British, and that is reflected in the number of papers published in English. The second reason for publishing in English was to reach a wider readership (Monge-Nájera & Ho, 2012). French was the second largest group of publishers (0.14 %) and this was not shocking, because Ghana is surrounded by three Francophone countries such as Togo, Burkina Faso, and Ivory Coast. The third largest group was German (0.10 %), which reflects the number of Ghanaian researchers who obtain their university degrees from the Federal Republic of Germany due to important scholarships such as DAAD and KAAD.
Publication year: In order to study publication year, total number of articles (TP), number of authors (AU), number of cited references (NR), and their averages were captured in accordance with Ho’s group publications (Ho, 2007; Wambu & Ho, 2016). Characteristics of Ghana articles in SCI-EXPANDED from 1958 to 2015 are shown in Table 1. A total of 7 375 Ghana articles were published in journals listed in SCI-EXPANDED, with an average of four authors in a publication. Total number of papers was in single digit from 1958-1971, and it rose to double digits from 1972-1995 and finally to triple digits from 1996-2015. The increase in the number of papers in SCI-EXPANDED journals by Ghanaian authors could be as a result of teaching and research institutions existence in Ghana as well as the local and international financial support.
Table 1: Characteristics of articles in Web of Science, 1958-2015
| Year | TP | AU | AU/TP | NR | NR/TP | PG | PG/TP |
|---|---|---|---|---|---|---|---|
| 1958 | 3 | 6 | 2.0 | 12 | 4.0 | 15 | 5.0 |
| 1959 | 0 | 0 | N/A | 0 | N/A | 0 | N/A |
| 1960 | 0 | 0 | N/A | 0 | N/A | 0 | N/A |
| 1961 | 0 | 0 | N/A | 0 | N/A | 0 | N/A |
| 1962 | 0 | 0 | N/A | 0 | N/A | 0 | N/A |
| 1963 | 0 | 0 | N/A | 0 | N/A | 0 | N/A |
| 1964 | 0 | 0 | N/A | 0 | N/A | 0 | N/A |
| 1965 | 0 | 0 | N/A | 0 | N/A | 0 | N/A |
| 1966 | 2 | 2 | 1.0 | 15 | 7.5 | 23 | 12 |
| 1967 | 1 | 1 | 1.0 | 23 | 23 | 1 | 1.0 |
| 1968 | 2 | 2 | 1.0 | 11 | 5.5 | 7 | 3.5 |
| 1969 | 0 | 0 | N/A | 0 | N/A | 0 | N/A |
| 1970 | 1 | 1 | 1.0 | 7 | 7.0 | 2 | 2.0 |
| 1971 | 3 | 7 | 2.3 | 40 | 13 | 18 | 6.0 |
| 1972 | 11 | 18 | 1.6 | 151 | 14 | 51 | 4.6 |
| 1973 | 67 | 127 | 1.9 | 805 | 12 | 477 | 7.1 |
| 1974 | 80 | 154 | 1.9 | 1068 | 13 | 586 | 7.3 |
| 1975 | 61 | 124 | 2.0 | 951 | 16 | 572 | 9.4 |
| 1976 | 55 | 128 | 2.3 | 963 | 18 | 424 | 7.7 |
| 1977 | 73 | 162 | 2.2 | 1105 | 15 | 523 | 7.2 |
| 1978 | 62 | 160 | 2.6 | 820 | 13 | 455 | 7.3 |
| 1979 | 56 | 141 | 2.5 | 797 | 14 | 406 | 7.3 |
| 1980 | 66 | 141 | 2.1 | 900 | 14 | 508 | 7.7 |
| 1981 | 59 | 152 | 2.6 | 872 | 15 | 425 | 7.2 |
| 1982 | 55 | 139 | 2.5 | 747 | 14 | 432 | 7.9 |
| 1983 | 39 | 94 | 2.4 | 585 | 15 | 303 | 7.8 |
| 1984 | 47 | 140 | 3.0 | 752 | 16 | 304 | 6.5 |
| 1985 | 65 | 188 | 2.9 | 1067 | 16 | 473 | 7.3 |
| 1986 | 38 | 114 | 3.0 | 478 | 13 | 244 | 6.4 |
| 1987 | 37 | 108 | 2.9 | 688 | 19 | 276 | 7.5 |
| 1988 | 43 | 147 | 3.4 | 666 | 15 | 281 | 6.5 |
| 1989 | 51 | 135 | 2.6 | 647 | 13 | 319 | 6.3 |
| 1990 | 51 | 172 | 3.4 | 876 | 17 | 403 | 7.9 |
| 1991 | 62 | 212 | 3.4 | 1 170 | 19 | 490 | 7.9 |
| 1992 | 88 | 241 | 2.7 | 1 593 | 18 | 709 | 8.1 |
| 1993 | 74 | 271 | 3.7 | 1 483 | 20 | 613 | 8.3 |
| 1994 | 83 | 289 | 3.5 | 1 575 | 19 | 575 | 6.9 |
| 1995 | 89 | 339 | 3.8 | 1 389 | 16 | 627 | 7.0 |
| 1996 | 122 | 426 | 3.5 | 2 408 | 20 | 853 | 7.0 |
| 1997 | 123 | 441 | 3.6 | 2 528 | 21 | 986 | 8.0 |
| 1998 | 125 | 523 | 4.2 | 2 485 | 20 | 887 | 7.1 |
| 1999 | 143 | 577 | 4.0 | 3 346 | 23 | 1 255 | 8.8 |
| 2000 | 164 | 705 | 4.3 | 3 610 | 22 | 1 230 | 7.5 |
| 2001 | 155 | 831 | 5.4 | 3 632 | 23 | 1 178 | 7.6 |
| 2002 | 160 | 786 | 4.9 | 3 769 | 24 | 1 159 | 7.2 |
| 2003 | 169 | 870 | 5.1 | 4 159 | 25 | 1 307 | 7.7 |
| 2004 | 181 | 1 515 | 8.4 | 4 633 | 26 | 1 499 | 8.3 |
| 2005 | 202 | 1 212 | 6.0 | 5 386 | 27 | 1 707 | 8.5 |
| 2006 | 225 | 1 405 | 6.2 | 6 337 | 28 | 1 961 | 8.7 |
| 2007 | 269 | 1 545 | 5.7 | 7 346 | 27 | 2 296 | 8.5 |
| 2008 | 284 | 1 700 | 6.0 | 8 638 | 30 | 2 386 | 8.4 |
| 2009 | 323 | 2 110 | 6.5 | 10 084 | 31 | 2 751 | 8.5 |
| 2010 | 418 | 2 752 | 6.6 | 13 950 | 33 | 3 780 | 9.0 |
| 2011 | 415 | 2 912 | 7.0 | 13 174 | 32 | 3 616 | 8.7 |
| 2012 | 494 | 4 718 | 9.6 | 18 350 | 37 | 4 685 | 9.5 |
| 2013 | 560 | 4 189 | 7.5 | 20 271 | 36 | 5 050 | 9.0 |
| 2014 | 625 | 6 171 | 9.9 | 24 512 | 39 | 6 281 | 10 |
| 2015 | 794 | 8 836 | 11 | 31 774 | 40 | 8 797 | 11 |
| Total | 7375 | 48 139 | 212 648 | 64 206 | |||
| Average | 4.0 | 20 | 7.5 |
TP: total number of articles; AU: number of authors; NR: number of cited references; PG: page counts, N/A: not available.
In recent years, Ho proposed a relationship between classic articles and their citations per publication (CPP year=TC year/TP) by years (Ho, 2013). It was also applied to highly cited publications in Taiwan (Chuang & Ho, 2015) and publications in dance field (Ho & Ho, 2015). Figure 1 shows the mentioned relationships which indicate that there is no significant change in the first period from 1958 to 1972 and 1973 to 1996, respectively. In 1958, T. W. Tinsley and co-workers from West African Cocoa Research Institute in Ghana published three earliest Ghana articles about viruses and cacao in Annals of Applied Biology (Attafuah & Tinsley, 1958; Knight & Tinsley, 1958; Tinsley & Wharton, 1958). In the third period from 1997 to 2015, publication trend increased from 123 articles to 794 articles. The significant increase in publication trend in the third period was expected, because most of the research-performing institutions in Ghana were established after the independence, and that accounted for the increase in the publication trend (Owusu-Nimo & Boshoff, 2017).
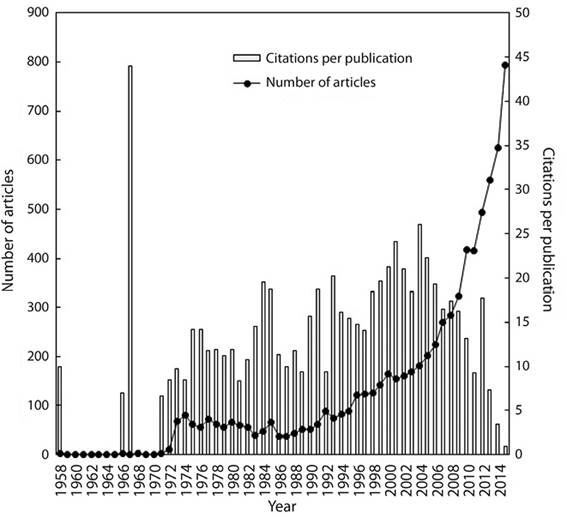
TheCPP 2015for 7 375 Ghana articles was 13. An extremely highCPP 2015was found in 1967 with 44, attributed to the only one article in 1967, entitled “Tongue root position in Akan Vowell harmony” (Stewart, 1967). This was not surprising at all because it was mentioned in the paper that the Akan (Twi-Fante) language shares with a multitude of other African languages a type of vowel harmony which is apparently found nowhere outside Africa. Also, the vowels of these languages always, it seems, fall into two harmonizing sets, one of which has relatively high and the other relatively low tongue positions, and consequently many writers have seen relative tongue height as the articulatory basis of the harmony. Furthermore, our search shows that the Akan language is studied in major universities in the United States, including Ohio University, Ohio State University, University of Wisconsin, Harvard University, Boston University, Indiana University, Michigan University, and The University of Florida, and this could have also attributed to extremely highCPP 2015thatwasfound in 1967.
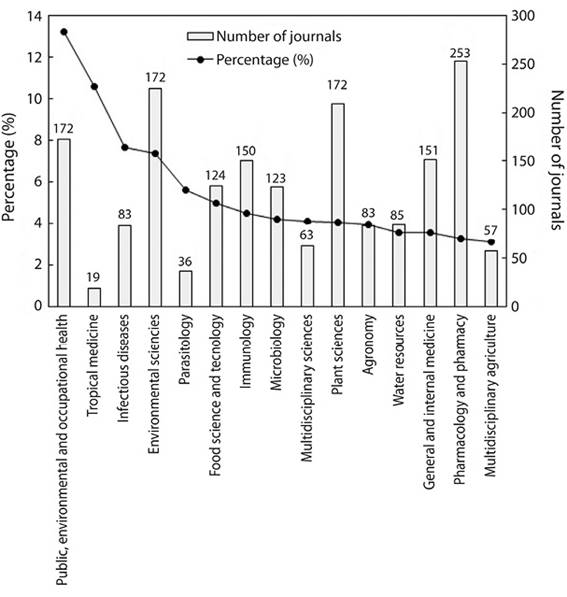
Web of Science subject categories and journals: To study Web of Science subject categories, we followed literature which focuses on a country (Monge-Nájera & Ho, 2012, 2015). According to Journal Citation Reports (JCR) in 2015, there were 177 Web of Science categories in SCI-EXPANDED. Ghana articles were published across 173 Web of Science categories, but no articles in categories of andrology (5 journals), microscopy (10 journals), neuroimaging (14 journals), and ocean engineering (14 journals). Figure 2 shows top 15 productive categories and number of journals in each category. Category of public, environmental and occupation health, had the highest total articles (976) followed by tropical medicine (780) and then environmental sciences followed with 543. Authors in Ghana were active in tropical medicine in which there were only 19 journals. Similarly, tropical countries in Central America, for example, Nicaragua (Monge-Nájera & Ho, 2017a) and Honduras (Monge-Nájera & Ho, 2017b) also published the most articles in category of public, environmental and occupation health, but Costa Rica (Monge-Nájera & Ho, 2012) and Panama (Monge-Nájera & Ho, 2015) paid more attention to plant sciences.
In total, 7 375 Ghana articles were published in 1 917 journals in SCI-EXPANDED. Table 2 shows the distribution of articles in the top 10 journals. The value of the indicatorIF 2015for each journal was obtained from JCR for 2015. The journal with the most published articles was PLoS Onewhich published 193 articles, 2.6 % of all analyzed articles. PLoS One fell into the category of multidisciplinary sciences and had anIF 2015of 3.057. The second position was Malaria Journal with 141 published articles (1.9 %) in Web of Science categories of infectious diseases, parasitology, and tropical medicine withIF 2015of 3.079. It was followed by Tropical Medicine and International Health. Five of the 10 journals in Table 2 were in the Web of Science category of public, environmental and occupational health. Four journals were in category of tropical medicine. This was not surprising since most of the avid Ghanaian writers were with the health research institutions. Researchers in the medical field were able to attract funding from local and international donors, and they are required to publish their findings in SCI-EXPANDED journals with wider readership.
Table 2: Top 10 productive journals
| Journal | TP(%) | IF 2015 | Web of Science subject category |
|---|---|---|---|
| PLoS One | 193 (2.6) | 3.057 | multidisciplinary sciences |
| Malaria Journal | 141 (1.9) | 3.079 | infectious diseases parasitology tropical medicine |
| Tropical Medicine and International Health | 139 (1.9) | 2.519 | public, environmental and occupational health tropical medicine |
| Transactions of the Royal Society of Tropical Medicine and Hygiene | 106 (1.4) | 1.631 | public, environmental and occupational health tropical medicine |
| American Journal of Tropical Medicine and Hygiene | 100 (1.4) | 2.453 | public, environmental and occupational health tropical medicine |
| BMC Public Health | 82 (1.1) | 2.209 | public, environmental and occupational health |
| International Journal of Gynecology and Obstetrics | 79 (1.1) | 1.674 | obstetrics and gynecology |
| Global Health Action | 71 (1.0) | 1.896 | public, environmental and occupational health |
| East African Medical Journal | 68 (0.92) | N/A | general and internal medicine |
| Journal of Infectious Diseases | 68 (0.92) | 6.344 | immunology infectious diseases microbiology |
International collaboration: In total, 5 038 Ghanaarticles (68 % of 7 375 articles) were internationally collaborative articles with 172 countries. Table 3 shows the distribution of the top 20 collaborative countries with Ghana. The most productive countries according to the number of published articles in collaboration with Ghanaian researchers were USA and UK, but there were more published articles by Ghanaian researchers with USA researchers playing the leading role (FPandRP). However, percentage of articles with leading role by Ghanaian researchers is pretty low for all shown countries. It is worth noting that South Africa being an African country, was the fifth country among the top 20 collaborative countries for Ghana articles in the Science Citation Index Expanded (1958~2015) (Table 3). Among the top 20 countries only Burkina Faso shares boundary with Ghana. More collaboration with non-adjacent countries such as USA and UK than neighbouring countries can be explained with economic and social development, research and development expenditure of these countries (Owusu-Nimo & Boshoff, 2017). Also, most researchers from Ghana went to American and European universities to study, and that accounted for the high collaboration with those countries (Monge-Nájera & Ho, 2012).
Table 3: Top 20 collaborative countries for Ghana articles in the Science Citation Index Expanded (1958~2015)
| Country | CP | CPR(%) | FPR(%) | RPR(%) |
|---|---|---|---|---|
| USA | 1623 | 1 (22) | 1 (12) | 1 (12) |
| UK | 1383 | 2 (19) | 2 (8.7) | 2 (9.1) |
| Germany | 600 | 3 (8.1) | 3 (4.6) | 3 (4.8) |
| Netherlands | 467 | 4 (6.3) | 4 (2.7) | 4 (2.8) |
| South Africa | 384 | 5 (5.2) | 9 (1.7) | 9 (1.8) |
| Switzerland | 339 | 6 (4.6) | 10 (1.2) | 10 (1.4) |
| Canada | 287 | 7 (3.9) | 5 (1.9) | 5 (2.0) |
| Japan | 287 | 7 (3.9) | 6 (1.8) | 7 (1.9) |
| Denmark | 286 | 9 (3.9) | 6 (1.8) | 5 (2.0) |
| Kenya | 285 | 10 (3.9) | 12 (1.0) | 12 (0.94) |
| Nigeria | 282 | 11 (3.8) | 11 (1.1) | 11 (1.0) |
| China | 229 | 12 (3.1) | 6 (1.8) | 8 (1.9) |
| France | 229 | 12 (3.1) | 13 (0.91) | 13 (0.92) |
| Australia | 220 | 14 (3.0) | 15 (0.57) | 17 (0.58) |
| Sweden | 220 | 14 (3.0) | 14 (0.73) | 14 (0.75) |
| Tanzania | 172 | 16 (2.3) | 20 (0.34) | 20 (0.33) |
| Burkina Faso | 155 | 17 (2.1) | 19 (0.35) | 19 (0.34) |
| India | 138 | 18 (1.9) | 23 (0.24) | 24 (0.23) |
| Italy | 135 | 19 (1.8) | 16 (0.56) | 15 (0.63) |
| Belgium | 119 | 20 (1.6) | 17 (0.53) | 16 (0.61) |
CP: internationally collaborative articles with Ghana; CPR(%): rank of internationally collaborative articles and percentage; FPR(%): rank of article with first author and percentage; RPR(%): rank of article with corresponding author and percentage.
Institutions: The national (590 articles; 8.0 % of 7 375 articles) and internationally collaborative articles (5 038; 68 %) with Ghana were considered as the inter-institutional collaboration (5 628; 76 %). Indicators such as total number of articles, TP, first author articles, FP, and corresponding author articles, RP, have been presented to evaluate publication performance (Wang, Yu, & Ho, 2010). Furthermore, an indicator SNI, a proportion of single institution articles: nationally collaborative articles: internationally collaborative articles (S:N:I) was applied to compare and describe institutions’ publication characteristics (Ho & Fu, 2016). Table 4 shows the top 10 institutions for Ghana articles in the Science Citation Index Expanded. Researchers affiliated to those ten institutions published 69 % of all 7 375 analyzed articles. University of Ghana took the first position in indicators of TP, FP, and RP. The University of Ghana is the oldest university in this country, and one of the first to have been established in West Africa; it was established in 1948 and now offers degree programmes on varied broad disciplines such as health sciences, engineering sciences, natural sciences, nuclear and allied sciences, agricultural sciences, humanities, law, business, social sciences and performing arts. During the period 1958-2015, University of Ghana published 36 % of the analysed Ghana articles, 32 % of the first author articles, and 31 % of the corresponding author articles. The second place by TP, FP, and RP indicators was taken by Kwame Nkrumah University of Scienceand Technology.
Table 4: Top 10 institutions for Ghana articles in the Science Citation Index Expanded
| Institute | TP | TPR(%) | FPR(%) | RPR(%) | %SI(SI) | %NC(NC) | %IC(IC) |
|---|---|---|---|---|---|---|---|
| University of Ghana | 2621 | 1 (36) | 1 (32) | 1 (31) | 23 (598) | 12 (315) | 65 (1708) |
| Kwame Nkrumah University of Science and Technology | 958 | 2 (13) | 2 (10) | 2 (9.5) | 16 (152) | 14 (131) | 70 (675) |
| University of Cape Coast | 415 | 3 (5.6) | 4 (6.5) | 3 (6.8) | 37 (152) | 12 (51) | 51 (211) |
| University of Science and Technology | 375 | 4 (5.1) | 3 (6.9) | 4 (6.8) | 51 (193) | 6.4 (24) | 42 (157) |
| Komfo Anokye Teaching Hospital | 273 | 5 (3.7) | 11 (1.5) | 14 (1.3) | 3.3 (9) | 12 (32) | 85 (232) |
| Ghana Atomic Energy Commission | 247 | 6 (3.3) | 6 (3.6) | 6 (3.8) | 20 (50) | 34 (83) | 46 (114) |
| Council for Scientific and Industrial Research (CSIR) | 245 | 7 (3.3) | 5 (3.8) | 5 (4.0) | 29 (71) | 21 (52) | 50 (122) |
| Ghana Health Service | 237 | 8 (3.2) | 29 (0.84) | 33 (0.78) | 2.5 (6) | 8 (19) | 89 (212) |
| Ministry of Health | 184 | 10 (2.5) | 16 (1.2) | 18 (1.2) | 9.2 (17) | 10 (18) | 81 (149) |
| University of Dev Studies | 184 | 10 (2.5) | 9 (1.8) | 9 (1.8) | 12 (22) | 16 (30) | 72 (132) |
TP: total number of articles;TPR(%): rank of total number of articles and percentage;FPR(%): rank of first author articles and percentage in all Ghana articles with first author information in Web of Science;RPR(%): rank of corresponding author articles and percentage in all Ghana articles with corresponding author information in Web of Science; %SI(SI): percentage inTPin an institute and single institute articles; %NC(NC): percentage inTPin an institute and nationally collaborative articles; %IC(IC): percentage inTPin an institute and number of internationally collaborative articles.
In Ghana, the proportion of S:N:I was 24:8.0:68. University of Ghana’s proportion of S:N:I was 23:12:65. University of Science and Technology was able to conduct research independently with S:N:I= 51:6.4:42. Ghana Atomic Energy Commission had more national teamwork or collaboration among different institutions with S:N:I= 20:34:46. In Table 4, only University of Science and Technology (S:N:I= 51:6.4:42) had at < 50 % internationally collaborative articles of its total publications. Ghana Health Service had the highest percentage of international collaboration with S:N:I= 2.5:8.0:89. Our search showed that this trend was expected, because it agrees with the core functions of Ghana Health Service. The core functions of Ghana Health Service include the following: i) The analysis of national, bilateral and international policies and their application in the development of strategic plans and implementation guidelines for the Ghana Health Service in collaboration with other Divisions and implementation partners; ii) the coordination, guidance and development of short, medium and long-term plans and budgets for the Ghana Health Service’s development, including the preparation of projects and programmes for local and international financing consistent with the Sector-Wide/Multi-Donor Budget Approach; and iii) the development of level specific performance indicators and contracts consistent with national, bilateral and international expectations, among others.
Authors: This section explores the distribution of articles by Ghanaian authors. Figure 3 captures number of articles and citations per publication. Internationally collaborative papers had the highest number of articles (5 038) followed by the corresponding author not from Ghana (3 913) and then the first author from Ghana followed with 3 708 articles. The highest citations per publication (19) were registered by both first and corresponding authors not from Ghana. This was expected because most Ghanaian researchers collaborate with researchers from countries such as USA, UK, Germany, Netherlands, South Africa, Switzerland, Canada, Japan, Denmark, Kenya, Nigeria, China, France, Australia, Sweden, Tanzania, Burkina Faso, India, Italy, and Belgium. It is believed that Ghana is limited to some extent when it comes to sophisticated equipment for science and technology research. This confirms research conducted by Atuahene (2011) on the topic “Re-thinking the Missing Mission of Higher Education: An Anatomy of the Research Challenge of African Universities”. He mentioned the following as the challenges which retard research in African universities: the poor research infrastructure, limited Information and Communication Technologies (ICTs), the lack of leadership mandate and support, the lack of congenial political and academic environment in some countries, shortage and lack of faculty to pursue academic research due to heavy teaching loads and inadequate financial support. Furthermore, Table 5 listed indicators including total number of articles, number of article with first author, number of article with corresponding author and number of single author articles, for the top 11 productive authors, each with 60 or more articles. S. Owusu-Agyei, an epidemiologist with extensive experience in the design and conduct of clinical and field intervention trials from Ghana Health Service was ranked first with 125 articles, twenty-first with ten articles as the first author and twenty-second with 10 articles as corresponding author. He has been the Director of the Kintampo Health Research Centre (KHRC) since 2002. He is a part-time Lecturer in the Departments of Epidemiology and Population Health and Infectious Tropical Diseases, London School of Hygiene and Tropical Medicine (LSHTM) and a Senior Lecturer at the School of Public Health, University of Ghana, Legon. The second position was occupied by B. J. B. Nyarko, Director-General from Ghana Atomic Energy Commission with 77 articles, 32ndwith nine articles as the first author, 28thwith nine as the corresponding author. The third position was occupied by A. Hodgson from Navrongo Health Research Centre with 75 articles, 428thposition with two articles as the first author, 645thposition with one paper as the corresponding author. It was not surprising that the top three spots were occupied by prolific writers from research based institutions and this could be due to the financial support they generally receive from both local and international donors for cutting-edge research.
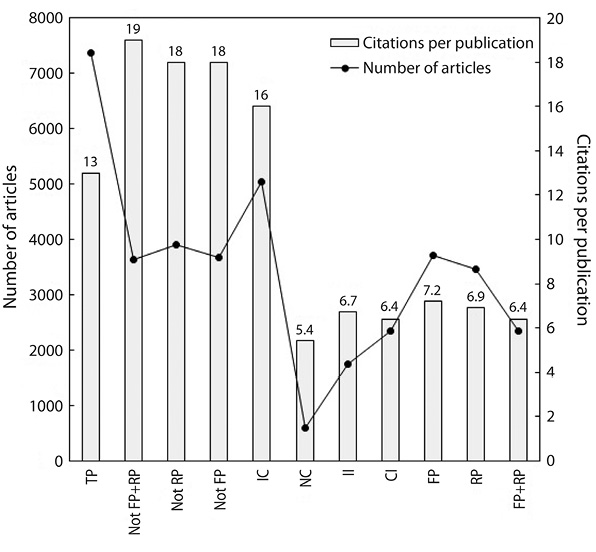
Figure 3 Distribution of articles by Ghanaians authors. TP: total articles. Not FP+RP: both first and corresponding authors are not from Ghana. Not RP: corresponding author is not from Ghana. Not FP: first author is not from Ghana. IC: internationally collaborative papers. NC: nationally collaborative papers. II: institutional independent papers. CI: Ghana independent papers. FP: first author is from Ghana. RP: corresponding author is from Ghana. FP+RP: both first and corresponding authors are from Ghana.
Table 5: Top 11 authors for Ghana articles in the Science Citation Index Expanded. Only authors with at least 60 articles
| Author | Affiliation | rank (TP) | rank (FP) | rank (RP) | rank (SP) |
|---|---|---|---|---|---|
| S. Owusu-Agyei | Ghana Health Service, Ghana | 1 (125) | 21 (10) | 22 (10) | N/A |
| B. J. B. Nyarko | Ghana Atomic Energy Commission, Ghana | 2 (77) | 32 (9) | 28 (9) | N/A |
| A. Hodgson | Navrongo Health Research Centre, Ghana | 3 (75) | 428 (2) | 645 (1) | N/A |
| F. K. Nkrumah | University of Ghana, Ghana | 4 (70) | 32 (9) | 359 (2) | N/A |
| O. Adjei | Kwame Nkrumah University of Science and Technology, Ghana | 5 (69) | 169 (4) | 228 (3) | N/A |
| E. H. K. Akaho | Ghana Atomic Energy Commission, Ghana | 6 (67) | 59 (7) | 79 (6) | 130 (1) |
| K. A. Koram | University of Ghana, Ghana | 7 (66) | 81 (6) | 149 (4) | 130 (1) |
| K. Awadzi | Onchocerciasis Chemotherapy Research Centre, Ghana | 8 (64) | 1 (29) | 3 (23) | 130 (1) |
| B. D. Akanmori | University of Ghana, Ghana | 9 (62) | 169 (4) | 7 (15) | N/A |
| S. Adjei | University of Ghana, Ghana | 10 (58) | 787 (1) | 645 (1) | 130 (1) |
TP: total number of articles; FP: number of article with first author; RP: number of article with corresponding author; SP: number of single author articles; N/A: not available.
Highly cited articles: This section captures Ghana articles including total number of times each article was cited from the Web of Science Core Collection since its publication to the end of 2015 (TC 2015), total number of citations of a paper in 2015 only (C 2015), and the number of authors (AU). Table 6 shows the top 11 Ghana articles with more than 300 citations (TC 2015> 300). The 11 articles were all of international collaboration. Both first and corresponding authors were not from Ghana. Seven first authors were from USA, three from the UK, and one from Australia while eight corresponding authors from USA and three from the UK. The article titled “Global and regional mortality from 235 causes of death for 20 age groups in 1990 and 2010: a systematic analysis for the Global Burden of Disease Study 2010” (Lozano et al. 2012) was published in Lancet by 189 authors and was ranked first forTC 2015. The second position was occupied by the article titled “Disability-adjusted life years (DALYs) for 291 diseases and injuries in 21 regions, 1990-2010: a systematic analysis for the Global Burden of Disease Study 2010” (Murray et al., 2012) also published in Lancet by 359 authors. It is clear from Table 6 that the top three most cited articles were all published in a high impact factor journal (i.e. Lancet). This was expected because it is known in literature that papers published in journals with a high IF would probably have high citations (Chuang & Ho, 2015). Furthermore, the article titled “Impact of permethrin impregnated bednets on child mortality in Kassena-Nankana district, Ghana: A randomized controlled trial” (Binka et al., 1996) was the most frequently cited article withTC 2015of 260 by F.N. Binka from Navrongo Health Research Centre as the first and also corresponding authors.
Table 6: Top 11 Ghana articles with more than 300 citations (TC 2015> 300)
| Rank (TC 2015 ) | Rank (C 2015 ) | Article title | AU | Reference |
|---|---|---|---|---|
| 1 (1849) | 1 (897) | Global and regional mortality from 235 causes of death for 20 age groups in 1990 and 2010: a systematic analysis for the Global Burden of Disease Study 2010 | 189 | Lozano et al. (2012) |
| 2 (1370) | 2 (638) | Disability-adjusted life years (DALYs) for 291 diseases and injuries in 21 regions, 1990-2010: a systematic analysis for the Global Burden of Disease Study 2010 | 359 | Murray et al. (2012) |
| 3 (954) | 3 (458) | Years lived with disability (YLDs) for 1160 sequelae of 289 diseases and injuries 1990-2010: a systematic analysis for the Global Burden of Disease Study 2010 | 355 | Vos et al. (2012) |
| 4 (864) | 4 (415) | The global distribution and burden of dengue | 18 | Bhatt et al. (2013) |
| 5 (528) | 7 (125) | Science for managing ecosystem services: Beyond the Millennium Ecosystem Assessment | 15 | Carpenter et al. (2009) |
| 6 (462) | 5 (406) | Global, regional, and national prevalence of overweight and obesity in children and adults during 1980-2013: a systematic analysis for the Global Burden of Disease Study 2013 | 140 | Ng et al. (2014) |
| 7 (367) | 35 (25) | Effect of intravenous corticosteroids on death within 14 days in 10008 adults with clinically significant head injury (MRC CRASH trial): randomised placebo-controlled trial | 471 | Muzha et al. (2004) |
| 8 (327) | 15 (49) | Increasing carbon storage in intact African tropical forests | 33 | Lewis et al. (2009) |
| 9 (318) | 61 (18) | A high-density admixture map for disease gene discovery in African Americans | 32 | Smith et al. (2004) |
| 10 (307) | 529 (5) | Rationale for development of a synthetic vaccine against plasmodium-falciparum malaria | 7 | Zavala et al. (1985) |
| 11 (306) | 14 (52) | First results of phase 3 trial of RTS, S/AS01 malaria vaccine in African children | 142 | Agnandji et al. (2012) |
TC 2015: total number of times article cited from the Web of Science Core Collection since its publication to the end of 2015:C 2015: total number of citations of a paper in 2015 only;AU: number of authors.
In conclusion, Ghanaian researchers/lecturers should publish their scientific works in high impact factor journals captured by Thomson Reuters to have high citations.

