


 Espanhol (pdf)
 Artigo em XML
 Referências do artigo
 Enviar este artigo por email
 Citado por SciELO
  Similares em
SciELO
Similares em
SciELO  uBio
uBio 
 Permalink
Changes in land use in terms of magnitude, direction, and pace, are mainly consequences of anthropogenic actions (Aguayo, Pauchard, Azócar, & Parra, 2009; Bender, Boehmer, Jens, & Schumacher, 2005; Wiens, Stenseth, Van Horne, & Anker, 1993). In recent decades, agricultural and urban transformation have generated a landscape with heterogeneous characteristics (Rosero-Bixby & Palloni, 1998; Turner, 2005), which describes a mosaic of natural and human-driven spaces that define spatial and temporal patterns on lands (McLennan & Garvin, 2012; Peña-Cortés et al., 2006). From a conservation perspective, these heterogeneous landscapes result in loss, fragmentation and modification of forest habitats, which leads these areas to have a decline in flora and fauna communities (Fahrig, 2003; Haila, 2002; Hanski, 1998; Sanchez-Azofeifa, Harriss, & Skole, 2001).
To prevent changes in land use in forested areas and conserve remnant tree species, various official organizations have created different categories of protected areas that restrict land use changes and deforestation (Myers, 1993; Sanchez-Azofeifa, Rivard, Calvo, & Moorthy, 2002). Since 1995, Costa Rica has a protected areas system that allows in situ conservation through different management categories that dampens, to some extent, land use changes in terrestrial ecosystems (SINAC, 2010). While it is true that the country has generated many protected areas in the last two decades, most of these are currently immersed in a highly dynamic anthropogenic landscape matrix that hinders conservation objectives and management plans (Broadbent et al., 2012; Sánchez-Azofeifa, Daily, Pfaff, & Busch, 2003; Sanchez-Azofeifa et al., 2002). The protected areas of the Central Pacific in Costa Rica, specifically La Cangreja National Park (LCNP) and Rancho Mastatal Wildlife Refuge (RMWR) are a good example. Before their foundation in 2002 and 2004 respectively, both areas had suffered extensive deforestation, so much so that in 1980 the government declared the region an emergency zone to stop the overexploitation of resources (Bonilla, 1983). Despite multiple efforts, the region is still suffering from wildlife hunting, burning of land, urban growth and deforestation around them (Jiménez, 2011). Therefore, to visualize the dynamics of land use changes in and around these protected areas, to better focus future management efforts, it is important to determine which sites have been significantly affected and the possible reasons.
The aim of this paper was to analyze patterns of land use changes in LCNP, RMWR, and surrounding areas, during the period from 1997 to 2010 to be used as a technical-scientific tool in the management of protected areas. We hypothesized that protected areas are entities of conservation and restoration with increased coverage, connectivity and stability of forest cover compared to the surrounding areas. Specifically in this study, we investigated the magnitude and rate of land use change, the diversity and equity of the landscape elements, and finally characterized those regions that have experienced the greatest land use change and its origin and expansion direction.
Materials and Methods
Study site: This study was conducted in two protected areas in the Central Pacific of Costa Rica: La Cangreja National Park (LCNP) and Rancho Mastatal Wildlife Refuge (RMWR) (Fig. 1). This region contains one of the last remnants of montane rainforest in the Central Pacific (Costanzo, 2006; Holdridge, 1967). Due to high annual rainfall (4 000 mm), high humidity, nutrient-poor soils and varied topography (Jiménez, 1999), the area contains about 44 endemic tree species (Acosta-Vargas, 1998), which makes this area one of the highest of biodiversity and floristic endemism in the country. To delimit the study areas, we worked with three previously established areas: 1) LCNP limits established in 2005 (Poder Ejecutivo, 2005; 2 508.19 ha), 2) the RMWR limits established in 2004 (Poder Ejecutivo, 2004; 79.16 ha), and 3) the surrounding area (SA) (2 720 ha). The SA was obtained using a 1 km radius from the edge of the protected areas. The entire landscape in this study is within the Paso de Lapas biological corridor (Bustamante, 2006).
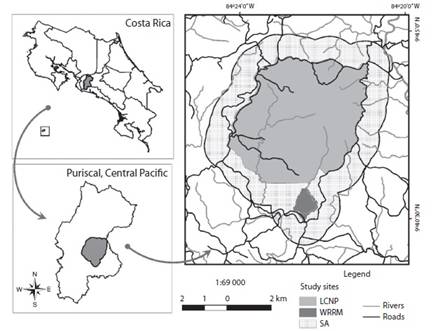
Fig. 1: Three landscapes studied in the Central Pacific of Costa Rica. La Cangreja National Park (LCNP), Rancho Mastatal Wildlife Refuge (WRRM), and surrounding area (SA).
Cartographic process: We used 1:40 000 scale aerial photographs for 1997 from Costa Rican TERRA project, 1:20 000 scale aerial photographs for 2005 from Costa Rican CARTA project, and 1:40 000 scale satellite photographs from ArcGIS online to create thematic maps in each delimited area. Aerial and satellite photographs were georeferenced to CRTM05 coordinate system of Costa Rica, Datum WGS84. Georeferenced images were performed by ArcGIS 10 software through a georeferencing module used as reference digital map for the area and georeferenced and orthorectified photomosaic from national cadastre system of 2005. For each photograph, 40 control points were used to improve the accuracy of the georeferencing tehcnique and a 3rd order polynomial transformation was used for rectification. From georeferenced image sets, photomosaics were made and then used as basis for the digitization of thematic layers.
The creation of the thematic layers was made from photo-interpretation of the photomosaic per year. From these, each element was considered unique in the landscape with a clearly identifiable color and characteristic structure. Photo-interpretation was made firstly by identification of which types of coverage are present in the landscape: altered versus natural coverage. From this, altered coverage was classified in four elements: crops as land dedicated to agriculture, pastures as areas dominates by herbaceous cover, open lands as areas without vegetation, and human settlements as any type of human infrastructure. Likewise, natural coverage was classified in three elements: forest cover as natural and native coverage that has not been tampered with or modified by humans, thickets as natural cover that had slight degree of human intervention, and water bodies as water mains like rivers, creeks and streams.
Different landscape metrics were extracted in all years of the study in order to characterize what the composition and configuration of the elements were at each delimited area and land use level. These metrics were obtained from each thematic layer and from each delimited area according to Botequilha & Ahern (2002). In essence, for each year the number, average size, and average shape index of each fragment at the delimited area and land use level were determined. Area proportion of forest cover, thickets and pastures were determined within each area for the three years. These metrics were extracted by Patch Analyst extension from ArcGis 10 software (Rempel, Kaukinen, & Carr, 2012).
The methods of Peña-Cortés et al. (2006) were used to analyze the speed of change of each land use by the annual rate of land use change (RC) within the three areas: RC = (Af - Ai) / Δt, where A is the calculated area (ha) for land use at the period f and i, and Δt is the time between in each period evaluated (1997-2005, 2005-2010 and 1997-2010).
Shannon Diversity (SDI) and Equity (SEI) indexes (Rempel et al., 2012) were applied to a set of land use subsamples in each of the delimited areas to determine the diversity and equity of elements as well as any pattern of variability. These were obtained through the creation of 25 ha hexagon plots on each delimited area to extract and apply later the land uses within each hexagon and diversity-equity index, respectively. Hexagon subsamples were created by Patch Analyst (Rempel et al., 2012). Because not all subsamples represented 25 ha, only subsamples greater than 25 % (6.25 ha) of area were used. From these, two Repeated Measures analyses on diversity and equity indices were performed to determine if differences existed between delimited areas, study periods, and their interaction.
Finally, to identify which regions in the whole landscape presented changes in land use, cross table analyses (Crosstab) were performed according to Bocco, Mendoza and Masera (2001) and Franco, Regil, González and Nava (2006). For this, the thematic layers of each year were transformed to raster format with a cell size of 25 m, and then cross-tabulations from raster layers between 1997-2005 and 2005-2010 were made. From this, a map of land use changes, a transition matrix with probabilities of land use changes, and their dependence of land use transition were obtained. This analysis was performed by IDRISI selva software (Eastman, 2012).
Results
For the evaluated period, land use showed that the delimited areas were immersed in a natural matrix composed mainly by forest and thicket cover (Fig. 2). In general, the whole landscape in 1997 was comprised by 74 % natural cover and 26 % altered cover. However, in 2005 and 2010 the natural and altered cover increased and decrease by 1 %, respectively. Approximately 53 ha changed from altered to natural cover from 1997 to 2005 in the whole-landscape. These natural cover percentages corresponded mainly to forest cover (1997 = 52 %; 2005 = 54 %; 2010 = 57 %), while altered cover percentages corresponded mainly to pastures (1997 = 24 %; 2005 = 25 %; 2010 = 24 %). Forest cover areas were the most prevalent type of cover per period per site (Fig. 3), tending to increase slightly in the protected areas during 2005 and 2010, but not in SA. In contrast, thicket cover decreased between 2005 and 2010 at each site. Increases in pasture areas occurred only in SA between 2005 and 2010 when compared with 1997 (Fig. 3). Other land uses (human settlements, water bodies, crops and open lands) showed lower cover close to 2 %, which were scattered mainly in SA (Fig. 2).

Fig. 2: Land use of three landscapes studied in the Central Pacific of Costa Rica in 1997, 2005 and 2010. La Cangreja National Park (LCNP), Rancho Mastatal Wildlife Refuge (RMWR), and surrounding area (SA).
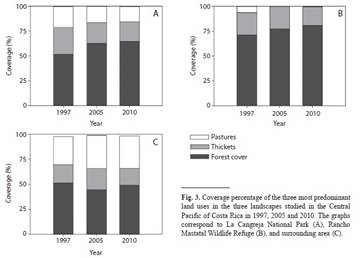
Fig. 3: Coverage percentage of the three most predominant land uses in the three landscapes studied in the Central Pacific of Costa Rica in 1997, 2005 and 2010. The graphs correspond to La Cangreja National Park (A), Rancho Mastatal Wildlife Refuge (B), and surrounding area (C).
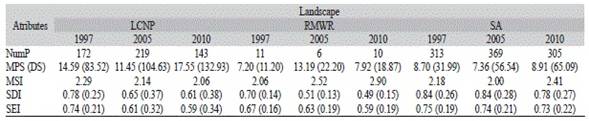
In relation to landscape metrics at the study area level, LCPN and SA showed an increase and a decrease in the number of fragments in 2005 and 2010, respectively, while their average size decreased and increased in the same way (Table 1). Pattern of changes in the shape index for the study sites were different, LCNP showed an increase towards 2010, RMWR showed a decrease, while SA presented a decrease and increase in 2005 and 2010, respectively (Table 1). Shannon Diversity and Equity indexes were different for the evaluated regions; SA had the highest values of diversity and equity independent of the period, due to the complexity of its elements; it was followed by LCPN and RMWR (Table 1). Both indices decreased towards 2010 for all three areas. Repeated measures analysis showed that there is a temporal effect over Shannon index (F2,244 = 2.15, P = 0.005) but not on the Equity of elements (F2,244 = 0.02, P = 0.13); besides, this analysis showed that an effect exists with the site-temporal interaction on Shannon (F4,488 = 3.5, P < 0.001) and Equity index (F4,488 = 2.29, P = 0.004).
Table 1: Structural attributes of land use elements in the Central Pacific of Costa Rica in 1997, 2005 and 2010
Landscape metrics at land use level reflected that some land uses in LCNP and RMWR such as thickets and forest covers, decreased and increased in 2010, respectively, while in SA, human settlements and pastures coverage increased and forest cover decreased (Table 2). In general, the number of fragments decreased in all class uses except thickets and human settlements in 2005, but this trend was not observed in 2010 (Table 2). Moreover, average fragment size and shape index of each land use were different (Table 2), and thickets and forest cover within each area decreased and increased their size and shape from 1997 to 2010, respectively.
Table 2: Spatial pattern characteristics at class level of the three landscapes study in the Central Pacific of Costa Rica in 1997, 2005 and 2010 
The speed of land use change annual rates for each study site was different depending on the year and the site area (Table 3). For LCNP and RMWR, it was found that thickets and pastures presented negative rates of change between 1997 and 2010, while forests cover showed positive rates (Table 3). In SA, only human settlements and pastures presented positive annual rates of change between 1997 and 2010.
Table 3: Annual rate of land use change (ha/year) of three landscape study areas in the Central Pacific of Costa Rica in 1997, 2005 and 2010
Crosstab analysis between land coverage of 1997-2005 and 2005-2010 showed that the whole landscape presented a dependence to change the land use and maintaining their use (1997-2005: χ236 = 10104372.8, P < 0.001; 2005-2010: χ236 = 22330379.2, P < 0.001). In general, the 1997-2005 and 2005-2010 transition matrix showed that forest cover, water bodies and pastures coverage presented greater probability of maintaining its previous state (0.49, 0.49 and 0.30, respectively), while forest cover, thickets and pastures coverage presented greater probability to change to other uses (Table 4). The map of land use change (Fig. 4) showed that Northeastern area of SA presented a trend to change to pastures cover, while areas within LCNP and RMWR tend to change to forest cover.

Discussion
In general, our results demonstrated that the natural matrix on the landscapes studied were mainly composed of forest and thickets cover. This conclusion was based on three facts: 1) these were the most dominant in the lanscape, 2) they were the most connected, and 3) they were the most prevalent coverage in temporal terms. Although there is a higher matrix of natural cover on the whole landscape, the existence or absence of an anthropogenic effect reflects the dynamics and structure of landscape elements in each study site, as generally described in other landscape analyses by Peña-Cortés et al. (2006). In terms of land use through time, decrease in the number of fragments and shape index, and increase or decrease in size of patches can be an indication of landscape evolution in the area. In relation to the latter, increases in forest cover and pastures inside and outside of protected areas, can be seen as indicative of elements that dominate the spatial and temporal landscape dynamics of the region, which may be the result of the protected areas conservation efforts and livestock activity in the zone.
The pattern in all years of great number of fragments, diversity and equity of land use founded in SA compared with LCNP and RMWR demonstrates the high landscape complexity in the edges of protected areas. Turner (1989, 2005) showed that regions with greater number of elements, fragments and less natural cover usually describe areas with high landscape complexity, which are generally susceptible to disturbance and habitat loss. Evidence of this phenomenon in the Central Pacific of Costa Rica are observed in Manuel Antonio National Park, Carara National Park and other areas near to the coast, where the urban growth and different crops around the protected areas generate a decline of wildlife populations (Broadbent et al., 2012; Sáenz &amp;amp; Sáenz, 2007; Sanchez-Azofeifa et al., 2001).
Changes in land use within LCNP and RMWR show the recovery of forested areas likely due to conservation efforts in the zone. It has been shown that remaining structure of forest cover in the landscape is important for the recovery of areas where the tropical forest did not exist (Helmer, 2000). In this sense, it is likely that the remaining coverage prior to the creation of these protected areas was responsible for the recovery of thickets and forest cover. Likewise, the great coverage, low number of fragments and high stability of forest cover within the two protected areas, show the potential for conservation of natural habitat that these protected zones have. In general, forest cover can play the role of core areas for endemic wildlife unique species to the area, such as Plinia puriscalensis and species with slow growth such as Aspidosperma myristicifolium, that require forest cover for development and growth (Guzmán &amp;amp; Cordero, 2013). Furthermore, forest cover recovery within LCNP and RMWR must be considered as positive aspects for tourism attraction (Alvarado, 2008; Díaz, van Koppen, Breitling, &amp;amp; de Camino, 2005).
Considering the observed changes in SA, it is likely that problems of the surrounding communities, such as deforestation and burning of land for the generation of private farms (Jiménez, 2011), are responsible for pasture cover increases. In general, Northeastern and Eastern areas outside and the Northern areas inside of the LCNP were the areas where the large land use changes to altered coverage occurred. This may indicate the large anthropogenic pressures that experience these zones. In terms of habitat connectivity, it is possible that some wildlife species of LCNP are suffering geographical isolation. This can be evidenced because the Northern, Western and in the lower portion the Eastern regions did not have forest cover continuity and showed high altered coverage, which probably limited the species distribution that require this unaltered habitat. Although some studies promote the payment for environmental services to increase connectivity between protected areas (Sánchez-Azofeifa et al., 2003; Sánchez-Azofeifa, Pfaff, Robalino, &amp;amp; Boomhower, 2007), it is clear that these measures cannot achieve their goal if the local governments promote or do not supervise the anthropogenic changes around the protected areas. For this reason, local governments must contemplate future policies of connectivity in the zone with appropriate land management strategies that considers social-environmental aspects to promote the conservation and management in protected areas.
The case of LCNP and RMWR reflects that these recently designated protected areas have showed rapid regeneration over 13 years. However, the current anthropogenic pressure in SA and lack of effectiveness of local governments to monitor and abate the land use changes have caused a shift in land use to a condition of altered cover, which can potentially hinder the management, conservation and restorations of species in the protected areas. We emphasize the fact that these protected areas in the Central Pacific of Costa Rica are entities of conservation and restoration of the forest cover.

