


Services on Demand
Journal
Article
 English (pdf)
 Article in xml format
 Article references
 Send this article by e-mail
Indicators
-
 Cited by SciELO
 -
 Access statistics
Related links
-
 Similars in
SciELO
Similars in
SciELO  uBio
uBio
Share

 Permalink
Revista de Biología Tropical
On-line version ISSN 0034-7744Print version ISSN 0034-7744
Rev. biol. trop vol.61 n.4 San José Oct./Dec. 2013
Seasonal dynamics of phytoplankton in two tropical rivers of varying size and human impact in Southeast Nigeria
Dinamica de temporada del fitoplankton en dos rios tropicales de tamaño e impacto humano variado en el sureste de Nigeria
Dinamica de temporada del fitoplankton en dos rios tropicales de tamaño e impacto humano variado en el sureste de Nigeria
*Dirección para correspodencia:
Abstract
Phytoplankton occurrence and dynamics in rivers are mainly shaped by hydrophysical conditions and nutrient availability. Phytoplankton main structuring factors have been poorly studied in West African rivers, and this study was undertaken to identify these conditions in two tropical rivers that vary in size and human impact. For this, environmental variables and phytoplankton monthly samples were collected from the middle reaches of Asu and Cross rivers during an 18 months survey from March 2005-July 2006. Phytoplankton biomass (F=11.87, p=0.003), Shannon-Weiner diversity and species richness (F=5.93, p=0.003) showed significant seasonality in Asu but not in Cross River. Data was analyzed with Canonical correspondence analysis (CCA) and showed environmental differences between the two rivers, nitrate in Asu River (5.1-15.5mg/L) was significantly higher than Cross River (0.03-1.7mg/L), while PO4 (0.2-0.9mg/L) was significantly lower in Asu River compared to Cross River (0.03-2.6mg/L) (p<0.05). Eutrophic factors (NO3) determined primarily phytoplankton dynamics in Asu River, especially during the dry season, whereas hydrophysical factors (depth, transparency and temperature) shaped phytoplankton in Cross River. Taxa indicative of an eutrophic condition, such as Euglena, Chlorella, Chlorococcus, Ceratium, Peridinium, Anabaena, Aphanizomenon, Closterium, Scenedesmus and Pediastrum spp., were frequently encountered in the shallow impounded Asu River, while riverine species, such as Frustulia rhomboids, Gyrosigma sp., Opephora martyr and Surirella splendida dominated Cross River. A succession pattern was observed in the functional groups identified: Na/MP→TB→P (rainy→dry season) was observed in Asu River, whereas MP/D predominated in Cross River for both seasons. We concluded that, if nutrients predominate hydrophysical factors in shaping phytoplankton during dry season (half of the year) then, they are as important as hydrophysical factors structuring phytoplankton during rainy season (the other half).
Key words: West Africa, phytoplankton, eutrophication, functional group, Cross River, Asu River.
Resumen
La existencia del fitoplancton y la dinámica de los ríos están principalmente determinados por condiciones hidrofísica y disponibilidad de nutrientes. Los principales factores de estructuración del fitoplancton han sido poco estudiados en los ríos de Africa Occidental, y este estudio fue realizado para identificar estas condiciones en dos ríos tropicales que varían en tamaño e impacto humano. Para ello, variables ambientales y muestras ambientales mensuales de fitoplancton se obtuvieron de la parte media de los ríos Asu y Cross durante un estudio de 18 meses, de Marzo-2005 a Julio-2006. La biomasa del fitoplancton (F=11.87, p=0.003), el índice de diversidad de Shannon-Weiner y la riqueza de especies (F=5.93, p=0.003), mostraron estacionalidad significativa en Asu pero no el río Cross. Los datos fueron analizados con el análisis de correspondencia canónica (CCA) y mostró diferencias ambientales entre los dos ríos, el nitrato en el río Asu (5.1-15.5mg/L) fue significativamente mayor que en el río Cross (0.03-1.7mg/L), mientras que PO4 (0.2-0.9mg/L) fue significativamente menor en el río Asu en comparación al río Cross (0.03-2.6mg/L) (p<0.05). Los factores eutróficos (NO3) determinaron principalmente la dinámica del fitplancton en el río Asu, especialmente durante la estación seca, mientras que los factores hidrofísicos (profunidad, transparencia y temperatura) conformaron el fitoplancton en el río Cross. Taxones indicadores de una condición eutrófica, como Euglena, Chlorella, Chlorococcus, Ceratium, Peridinium, Anabaena, Aphanizomenon, Closterium, Scenedesmus y Pediastrum spp fueron frecuentemente encontradas en las aguas poco profundas del río Asu, mientras que las especies fluviales, como Frustulia rhomboids, Gyrosigma sp., Opephora martyr y Surirella splendida dominaron el río Cross. Un patrón de sucesión se observó en los grupos funcionales, identificados: Na/MP→TB→P (Estacion lluviosa → estación seca), fue observado en el río Asu, mientras que MP/D predominó en el río Cross para ambas estaciones. Se concluyó que, si los nutrientes predominan los factores hidrofísicos en la conformación del fitoplancton durante la estación seca (la mitad del año), entonces, son tan importantes como los factores hidrofísicos estructurales del fitoplancton durante la temporada de lluvias (la otra mitad).
Palabras clave: África occidental, fitoplancton, eutrofización, grupo funcional, río Cross, río Asu.
West Africa is located in the tropical region with well defined dry and rainy seasons. Therefore limnological features of rivers are extremely variable between seasons and between small and large rivers, where the factors regulating phytoplankton species composition, size and dynamics show similar variability (Salmaso & Braioni, 2008). High water velocities and turbidity during rainy season limit the phytoplankton chances to transform light and nutrients into algal biomass (Søballe & Kimmel, 1987; Lewis, 1988; Reynolds & Glaister, 1993). Nevertheless, during the dry season, when water velocity attenuates, nutrient concentrations increase and water clarity improves, algal biomass could be elevated due to increased efficient utilization of nutrients (Bukaveckas et al., 2011). The interaction between regulatory physical, chemical and biological factors to structure phytoplankton is modified by anthropogenic alterations of rivers such as dam constructions and re-channelization (Soares, Huszar & Roland, 2007). This trend seemingly encourages high development in river middle reaches, due to reduced flux and increased innocula from riparian shallow floodplain lakes and/or back waters (Köhler, 1994; Reynolds & Descy, 1996).
Worldwide, phytoplankton are less studied in rivers compared to lakes and reservoirs (Soares et al., 2007), especially in West Africa where there is sparse studies. Available information (Holden & Green, 1960; Egborge, 1973; Nwadiaro & Ezefill, 1986; Chindah & Pudo, 1991; Chindah & Braide, 2004) is often a floristic documentation of encountered species.
Studies have shown that unlike in lakes and reservoirs where zooplankton grazing and nutrients are the dominant limiting factors, phytoplankton in lotic environments are directly regulated by hydrophysical factors (Billen, Garnier & Hanset, 1994; Sabater et al., 2008; Perbiche-Neves, Serafim-Júnior, Shirata & Lagos, 2011). The dominant regulatory factors generally reported are discharge, wind, transparency and water temperature (Reynolds, 2006; Salmaso & Braioni, 2008). This delimits true planktonic species to the few that are capable of rapid reproduction/growth and can survive turbulence and light fluctuations (R-strategist), mainly diatoms and chlorophytes (Reynolds et al., 1994; Köhler, 1994; Soares et al., 2007). Nutrients are considered to play only subordinate role in determining algal biomass compared to hydrophysical factors (Biggs & Smith, 2002; Mitrovic, Chessman, Davie, Avery & Ryan, 2008). However, some studies have shown a direct relationship between chlorophyll-a and indicators of eutrophication (Basu & Pick, 1996; Van Nieuwenhuyse & Jones, 1996; Dodds; 2006). The response of rivers to eutrophication differs remarkably from that of a lake due to physical factors, namely turbidity effects on light availability and short water residence times (Søballe & Kimmel, 1987; Sellers & Bukaveckas, 2003; Koch, Guelda & Bukaveckas, 2004; Kennedy & Whalen, 2008). These factors constrain phytoplankton production by reducing the efficiency with which light and nutrients are converted to biomass. Phytoplankton successions in rivers are presumably driven by allogenic factors such as temperature, light regime, discharge rate and turbidity (Reynolds, 1984; Rossetti, Viaroli & Ferrari, 2009). However, del Giorgio, Vinocur, Lombardo & Tell (1991) suggested that phytoplankton succession in rivers become increasingly autogenic with increasing eutrophication.
Most rivers around the world are progressively more eutrophic from point and non-point pollution sources, thus, prompting numerous studies to evaluate their response to eutrophication. West African rivers are no exceptions and many are eutrophic due to urbanization, agricultural and industrial activities and improper disposal of domestic organic wastes (Mathooko, 2001). Deteriorating water quality could lead to proliferation and increased biomass of toxin producing Cyanobacteria, especially in regions of reduced flow (Padisák, 1997), however, the response of rivers to eutrophication are less understood compared to lakes and reservoirs and more studies from different geographical/climatic regions are required for a proper understanding of the response pattern.
In this study, we applied both taxonomical and functional group approaches to evaluate (i) species composition, biomass, diversity and seasonal dynamic of the phytoplankton community, and (ii) their dependence on hydrophysical factors and nutrient concentrations in order to identify the main structuring forces in two rivers differing in size and nutrient level. More specifically, we hypothesize that eutrophic factors (NO3 and PO4) become increasingly important forcing factors to phytoplankton in shallow compared to large rivers.
Materials and Methods
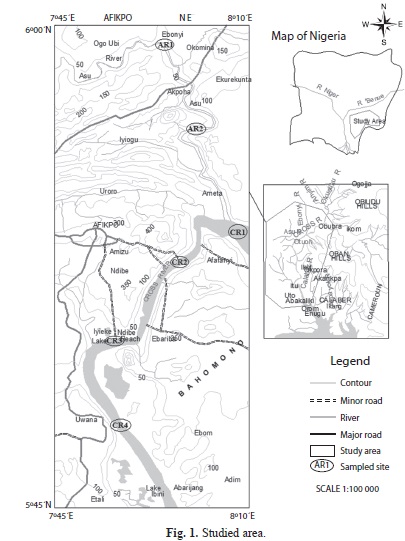
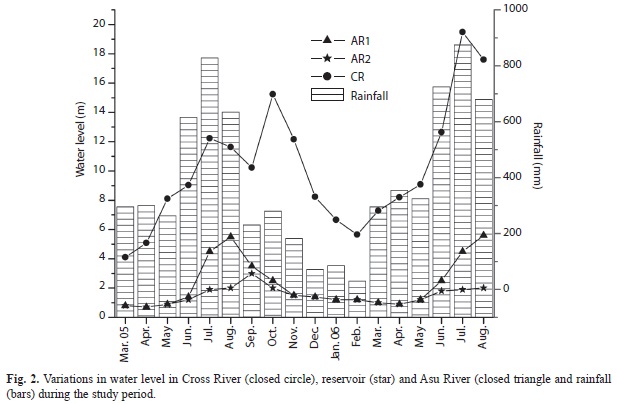
Study area: The Cross and Asu rivers are located in the South-Eastern part of Nigeria. Cross River system lies approximately between longitude 3°30’ E and 10°00’ E and latitude 4°N and 8°N. The river basin covers an area of 54 000km2 with 14 000km2 in the Cameroon and 39 500km2 in Southern Nigeria. Mean annual discharge at Obubra is 995m3/s with minimum and maximum values of 80m3/s (February) and 3 300m3/s (September), respectively (Moses, 1987). The middle reaches of Cross River are dotted with several floodplain lakes, which are absent from Asu. Asu River though a major tributary of the Cross River, has received little limnological attention. Both rivers drain several farmlands and receive run-offs from Abakaliki, Afikpo, Unwana and Ozziza municipalities. Asu River is further impacted by the dam constructed to supply water to Abakaliki town. The rivers are located within the tropical climatic zone with dry season (November-April) and rainy season (May-October). Maximum precipitation (about 70% of the total) occurs between June and October.
Sample collection: Samples were collected from four sites within the middle reaches of the Cross River, Itigidi (CR1), Ozizza (CR2), Ndibe (CR3) and Unwana (CR4) (Fig 1). Two sites were sampled from Asu River, AR1 (middle reaches of the river) and AR2 (reservoir). Surface water samples were collected using modified Von Dorn water sampler in a monthly basis between March 2005 and August 2006; these samples were analyzed for environmental variables and plankton. Water transparency was determined using Secchi disc and water depth was read from permanent calibrated poles mounted in the sites. Temperature, dissolved oxygen (DO), pH, total dissolved solids (TDS) and conductivity were determined in situ using Hanna digital thermometer, DO meter (model HI 9142), pH meter (model HI 98108), TDS meter and conductivity meter (model HI 98303), respectively. Phosphate (PO4) and nitrate (NO3) were determined in the laboratory according to the methods of APHA (1992) using atomic adsorption spectrophotometer (AAS). Rainfall data were kindly provided by Nigerian Meteorological Services, Calabar Airport, Cross River State, Nigeria.
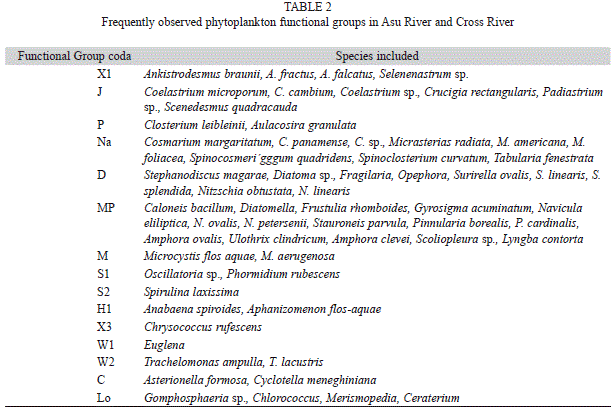
Phytoplankton samples were collected concurrently with environmental data from the different sites, fixed separately in 5% buffered formalin and then taken to the laboratory for identification. Phytoplankton identification to species was achieved using an Olympus microscope (Model BHTU BH-2). Quantitative assessment of phytoplankton abundance was done by counting individuals of each species settled in Utermöhl chambers and presented as the number of individuals per litre (ind./L). Algal biovolume was estimated by measuring individual cells and the volumes calculated according to geometrical solids (Rott, 1981). Phytoplankton biovolume (mm3/L) was then obtained by multiplication of density of each species by the average volume of its cells (Hillebrand, Dürselen, Kirschtel & Pollingher, 1999). Specific biomass was expressed in mg (fresh weight)/L, assuming a specific density of phytoplankton cells of 1g/cm3. Species contributing ≥5% to total biomass (Padisák et al., 2003) were sorted into functional groups using the guide of Reynolds et al. (2002) and Padisák, Crossetti & Naselli-Flores (2009). Species richness (SR) was estimated as the number of taxa in a sample and diversity (H’) was calculated using Shannon-Weiner index (Shannon & Weaver, 1963).
Seasonal and spatial difference in environmental and phytoplankton data were tested using a 2-way analysis of variance (ANOVA) and Duncan multiply range test used for post hoc analysis. The relationship between environmental data and the biomass of phytoplankton functional groups was analyzed through canonical correspondence analysis (CCA; Ter Braak, 1986). The null hypothesis of “no structure in main matrix and therefore no relationship among matrices (biotic and abiotic)” was tested through Monte Carlo procedures. ANOVA and CCA were performed with SPSS statistical package, version 15 and PC-ORD version 5, respectively.
Results
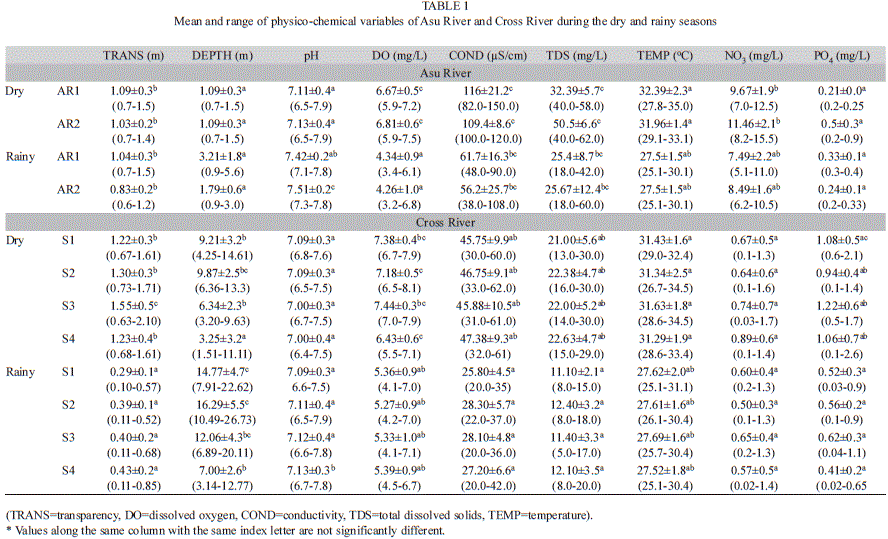
Temperature varied significantly between seasons (p<0.05) from 25.1-31.1°C during the rainy season to 26.7-34.5°C during the dry season. Transparency and water depth varied significantly between seasons in both rivers and between sites in Cross River only. The highest depth (26.7 m) was recorded for site 2 (Cross River) in July 2006. The mean monthly variations in rainfall and depth are shown in Fig. 2. Dissolved oxygen varied significantly between rivers, seasons and sites and was significantly higher (p<0.05) in Cross River (4.1-8.1mg/L) compared to Asu River (3.2-7.5mg/L). Conductivity and total dissolved solids (TDS) were significantly higher in Asu River than in Cross River (Table 1).
In Asu River, NO3 was significantly higher during the dry season while variation in PO4 was not. However, NO3 was not significantly variable between seasons in Cross River but PO4 was significantly higher during dry season (p<0.5). Nitrate values in Asu River (5.1-15.5mg/L) were higher than those of Cross River (0.03-1.7mg/L) while PO4 values were significantly lower in Asu River (0.2-0.9mg/L) than in Cross River (0.03-2.6mg/L).
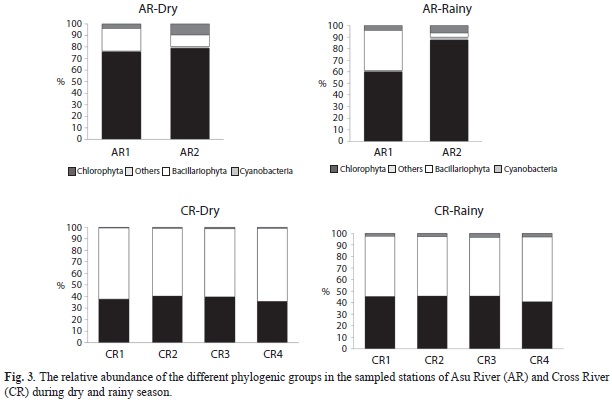
A total of 184 taxa from eight Divisions (Chlorophyta, Bacillariophyta, Euglenophyta, Dinophyta, Chrysophyta, Xanthophyta, Cryptophyta and Cyanobacteria) were encountered in the rivers. Chlorophyta was the most abundant and diverse taxa in Asu River (56 taxa, 52.8%) while Bacillariophyta was the most abundant group in Cross River (39 taxa, 42.3%). Species richness was higher in the latter river (106 taxa) compared to the former (92 taxa), only 14 species were common to both rivers.
In Asu River (AR1), Chlorophyta biomass significantly decreased in rainy from dry season values (F=11.3, p H’=0.004) while Bacillariophyta increased significantly (F=14.0, p=0.004) within the same period, a contrary pattern was observed in AR2 (reservoir). But in Cross River, Chlorophyta and Cyanobacteria biomass increased significantly in rainy season (F=186.6, p<0.0001) while Bacillariophyta decreased significantly from dry season values (F=1575.8, p=0.000002) (Fig. 3).
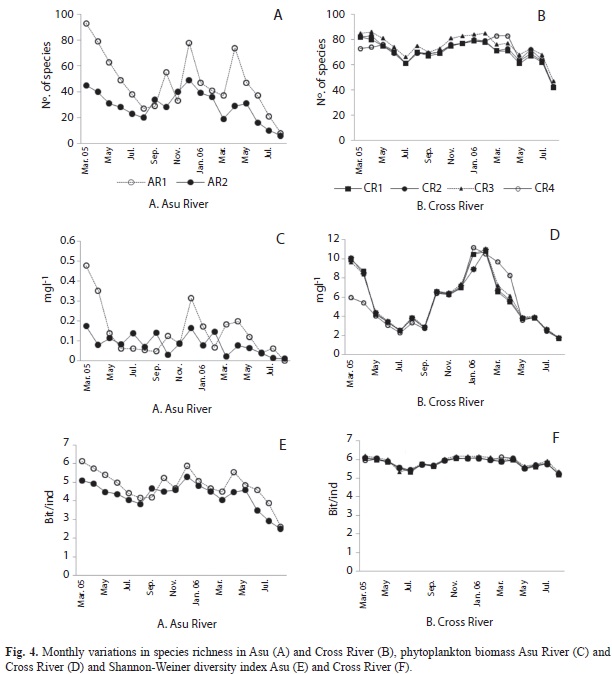
Total biomass (F=11.87, p=0.003), Shannon-Weiner diversity (F=5.93, p=0.003) and species richness (F=5.93, p=0.003) varied significantly between seasons in Asu River, however, only species richness exhibited significant variability between sites (F=9.52, p=0.004) in the river. Peak values in species richness (92 taxa), Shannon-Weiner diversity (6.2 bit/ind.) and total biomass (0.5mg/L) were attained in March 2005 in Asu River (Fig. 4). In Cross River, total biomass, Shannon-Weiner diversity and species richness neither exhibited significant seasonal nor spatial variability, though values were higher during the dry compared to rainy season. Peak biomass (>10mg/L) was attained in all sites in the Cross River in February 2006 (Fig. 4f). The lowest species richness, Shannon-Weiner diversity and total biovolume were recorded for the sites during July-August of each year (peak rainfall).
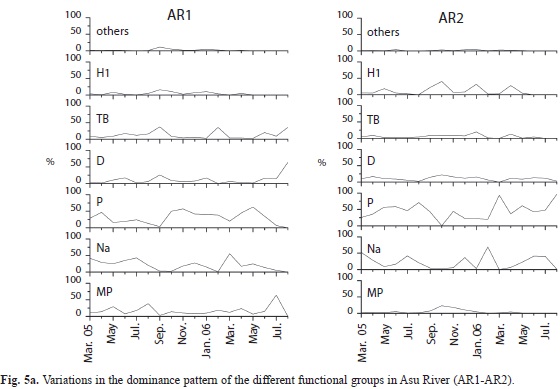
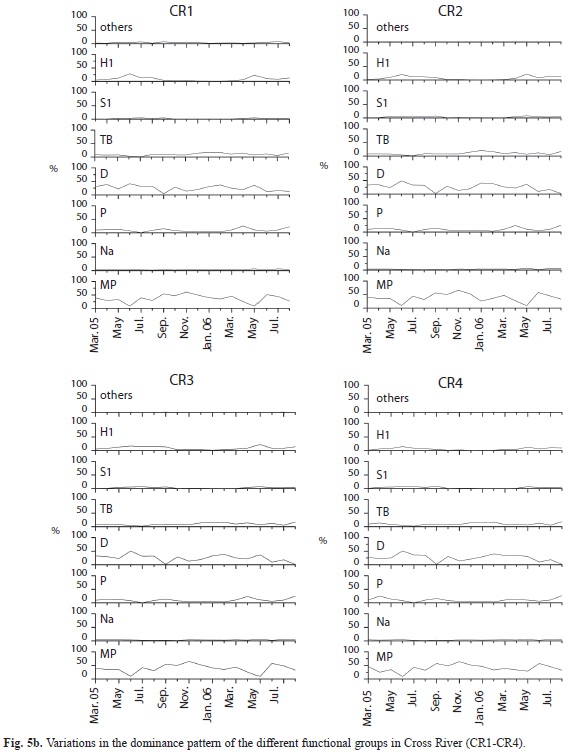
Twenty-one (21) functional groups (FG) were identified in both rivers, 15 from Cross and 17 from Asu (including the reservoir), the frequently observed groups are shown in Table 2. During the rainy season, pennate diatoms and desmids from functional group P (Closterium sp.), Na (Cosmarium sp. and Tabellaria sp.), MP (Navicula spp.) and TB (Nitzschia sp.) accounted for more than 95% biomass in Asu River (Fig. 5), while Na (Cosmarium sp.), P (Closterium sp.) and MP (Frustulia sp.) were dominant during the dry season. In the reservoir, P (Closterium sp.) and H1 (Anabaena sp.) were dominant during the dry season, while the former and S1 (Lyngbya sp.) predominated during the rainy season. In Cross River, MP (Frustulia rhomboides and Gyrosigma sp.), D (Opephora martyr) and TB (Surirella splendida) were predominant during the dry and rainy season. Functional group succession pattern was Na/MP→TB→P in Asu River and P→S1 (rainy→dry season) in the reservoir. In Cross River, MP and D were alternately dominant during dry and rainy season.
Canonical correspondence analysis (CCA) showed that the first two axes accounted for 48.8% of plankton-environment association (Fig. 6). Nitrate (-0.96), TDS (-0.75), conductivity (-0.72), depth (0.69), pH (-0.42) and PO4 (0.35) explained variability in axis 1. Dissolved oxygen (0.73) and temperature (0.40) explained most of the variation in axis 2. Monte Carlo test performed along with CCA showed that the first axis was significant (eigenvalue=0.87, p=0.001), this axis was mainly related to eutrophication factors (high NO3), while axis 2 was attributed to hydrophysical factors (temperature, dissolved oxygen and transparency). Thus, explaining occurrence of diverse taxa indicative of eutrophication such as Euglena sp. (W1), Chlorella sp. (K), Chlorococcus sp., Ceratium sp. and Peridinium sp. (Lo), Anabaena sp. and Aphanizomenon sp. (H1), Closterium sp. (P) and Scenedesmus sp. and Pediastrum sp. (J) in the reservoir and Asu River compared to the less eutrophic Cross River.
Discussion
Asu and Cross rivers are under the same climatic influence (temperature and rainfall), however, they differ in size and human impact. Impoundment of Asu River modified seasonal flow and water level fluctuations, which appeared to impact the water quality. The river and reservoir increasingly become eutrophic with decreasing pluviosity; high NO3, conductivity, TDS and increased oxygen demand were observed during the dry periods. Reservoirs are well reported in literature to modify the downstream water quality of rivers (Soares et al., 2007). The opening and closing of reservoir’s gates (for water level regulation) substantially influence water quality and hydrology downstream the river and consequently, could influence the seasonal development of phytoplankton in rivers where dams are constructed. The NO3 (Asu) and PO4 (Cross) concentrations were generally high and showed dissimilar seasonal dynamics in the rivers, probably due to deliveries from divergent sources such as farmlands and municipalities. Similar observations have been made on other river such as Paraibuna River (Soares et al. 2007) and Po River (Tavernini, Pierobon & Viaroli, 2011).
Peak phytoplankton biomass, species richness and diversity observed during the dry season in both rivers and reservoir, were attributed to favorable climatic and hydrologic conditions resulting from elevated temperature, solar irradiation and increased water retention time. Such conditions tend to encourage algal development in rivers (Soares et al., 2007; Perbiche-Neves et al., 2011). The reasons for such elevation in biomass are more directly attributed to efficient utilization of light and nutrient and reduction in algal wash-out (Bukaveckas et al. 2011). However, algal biomass was higher in the larger river (Cross) than the shallow Asu River. The presence of extensive floodplain lakes in Cross River (which is absent in Asu) provides readily suitable explanation to the difference in biomass (Okogwu, Nwani & Ugwumba, 2009). Floodplain lakes and back waters could substantially influence the algal composition of rivers by providing inoculum that enhances the diversity and biomass of phytoplankton (Rojo, Colbelas & Arauzo, 1994; Tavernini et al., 2011).
The phytoplankton of Asu River, thus appear to be influenced by the reservoir, which is similar to previous observations (Reynolds & Descy, 1996) on impounded rivers. Increasing importance of Cyanobacteria in reservoirs especially during periods of low precipitation as observed in this study is a common phenomenon (Padisák, 1997; Marinho & Huszar, 2002). The dominant Cyanobacteria in the reservoir, Anabaena sp. could have profited from high temperature and NO3, and low transparency as well as relatively stable water column. We therefore conclude that while phytoplankton development in Cross River was influenced by the presence of floodplain lakes, phytoplankton in Asu River were overwhelmingly affected by the reservoir and eutrophication.
The collapse of the phytoplankton community during the rainy season occurred during the period of high water discharge, turbidity and suspended solids. Here, a major dilution of the phytoplankton biomass and a decrease in water temperature and water retention time also seem to play a role. In addition, deteriorating physiological status of diatoms (due to prolonged poor light conditions resulting from low transparency) and wash-out enhanced algal loss (Reynolds, 1997) during turbulent periods. Such conditions are known to retard phytoplankton development (Reynolds, 2006; Salmaso & Braioni, 2008); species loss under these conditions overwhelms recruitment. The algal community is thus delimited to a few species capable of exploiting these extreme conditions (Devercelli, 2010), which are usually small unicellular pennate diatoms and desmids (Reynolds, 2006; Soares et al., 2007). Therefore, the decline in biomass is not limited to low algal productivity but also due to diminution in large-sized species. Hence, during the rainy season, both rivers supported algal growth and selected for a few disturbance and shade tolerant, opportunistic diatoms and desmids belonging to functional groups MP and TB. An analogous observation was also made by Istvánovics, Honti, Vöros & Kozma (2010) and Okogwu & Ugwumba (2012).
We identified several environmental differences between the two rivers, which include the seasonal water level fluctuation pattern, nutrient availability, transparency, dissolved oxygen, conductivity and total dissolved solids. Such environmental differences are expected to induce differences in phytoplankton community structure and dynamics between the rivers. It is therefore not surprising that there were obvious differences in the dominant phylogenic and functional groups in the rivers. Hydrogeomorphic differences between these rivers probably account for the difference, for example, the shoreline of Cross River at some of the sampled sites is lined with rocks and hydrologic storage zones. These zones typically house numerous periphyton that are dislodged and temporarily suspended in water during periods of turbulent flow (Rojo et al., 1994; Tavernini et al., 2011), which explains the dominance of MP such as Opephora martyr, Gyrosigma sp. and Surirella splendida in Cross River. Rocky shorelines are absent in Asu River and the high nutrient value tend to support the growth of eutrophic species such Chlorococcus sp., Ceratium sp. and Peridinium sp. (Lo), Cyclotella sp. (C), Anabaena (H1) and Lyngbya sp. (S1). Differing hydrogeomorphic patches generate divergent ecological processes and patterns (as seen between the two rivers), and have been shown to influence phytoplankton dominance pattern (Reynolds, 2006; Istvánovics et al., 2010; Tavernini et al., 2011).
It may be arguably correct to assume that hydrologic and climatic factors were the most important factors structuring the phytoplankton community in both rivers as shown repeatedly in several studies (Reynolds, 2006; Salmaso & Braioni, 2008; Perbiche-Neves et al., 2011). However, the importance of eutrophic factors in shaping phytoplankton tends to increase in relevance in the shallow and more eutrophic Asu River, and during dry season as shown by CCA. The increasing relevance of eutrophic factors in Asu River explains the appearance of numerous species (Phacus sp. (W1), Botryococcus sp. (F), Volvox sp. (G), Rhodomonas sp. (X2) and Chlorella sp. (K)) that commonly occur in shallow eutrophic lakes (Okogwu & Ugwumba, 2009) in the river but not in the Cross River.
We therefore conclude that nutrients are simply as important as hydrologic and climatic factors in determining the biomass, diversity and dominant phylogenic and functional phytoplankton groups in shallow tropical rivers. Our argument is simple; ‘if nutrients predominate hydrologic factors in shaping phytoplankton during dry season (half of the year; November-April), then, it is logically incorrect to assume that it is subordinate to the other forces (hydro-meteorological) that structure phytoplankton during the other half of the year (rainy season)’. It is therefore proposed that the management of rivers, especially those with dams, should incorporate nutrient enrichment control measures with fluvial hydrogeomorphology in order to achieve better results.
Acknowledgment
The authors are grateful to the students of Applied Biology, Ebonyi State University for their assistance in sample collection.
References
APHA. (1992). Standard methods for the examination of water and waste water analysis. American Public Health Association, Washington, USA. [ Links ]
Basu, B. K., & Pick, F. R. (1996). Factors regulating phytoplankton and zooplankton biomass in temperate rivers. Limnology and. Oceanography, 41, 1572-1577. [ Links ]
Biggs, B. J. F., & Smith, R. A. (2002). Taxonomic richness of stream benthic algae: effects of flood disturbance and nutrients. Limnology and. Oceanography, 47, 1175-1186. [ Links ]
Billen, G., Garnier. J., & Hanset. P. (1994). Modelling phytoplankton development in whole drainage networks: the RIVSTRAHLER model applied to the Seine River system. Hydrobiologia, 289, 119-137. [ Links ]
Bukaveckas, P. A., MacDonald, A., Aufdenkampe, A., Chick, J. H., Havel, J. E., Schultz, R., Angradi T. R., Bolgrien, D. W., Jicha, T. M., & Taylor. D. (2011). Phytoplankton abundance and contributions to suspended particulate matter in the Ohio, Upper Mississippi and Missouri Rivers. Aquatic. Sciences, 73, 419-436. [ Links ]
Chindah A. C., & Braide, S. A. (2004). The Physicochemical Quality and Phytoplankton Community of Tropical Waters: A Case of 4 Biotopes in the Lower Bonny River, Niger Delta, Nigeria. Caderno de Pesquisa Série. Biologia, 16, 7-35. [ Links ]
Chindah A. C., & Pudo. J. (1991). A preliminary checklist of algae found in plankton of Bonny River in Niger Delta, Nigeria. Fragmenta Floristica et Geobotanica Polonica, 36, 112-126. [ Links ]
del Giorgio, P. A., Vinocur, A. L., Lombardo, R. J., & Tell, H. G. (1991). Progressive changes in the structure and dynamics of the phytoplankton community along a pollution gradient in a lowland river—a multivariate approach. Hydrobiologia, 224, 129-154. [ Links ]
Devercelli, M. (2010). Changes in phytoplankton morpho-functional groups induced by extreme hydroclimatic events in the Middle Parana River (Argentina). Hydrobiologia, 639, 5-19. [ Links ]
Dodds, W. K. (2006). Eutrophication and trophic state in rivers and streams. Limnology and Oceanography, 51, 671-680. [ Links ]
Egborge, A. B. M. (1973). A Preliminary Checklist of the Phytoplankton of River Oshun. Freshwater Biology, 3, 569-572. [ Links ]
Hillebrand, H., Dürselen, C. D., Kirschtel, D., Pollingher, U., & Zohary, T. (1999). Biovolume calculation for pelagic and benthic microalgae. Journal of. Phycology, 35, 408-424. [ Links ]
Holden, M. J., & Green, J. (1960). The hydrology and plankton of River Sokoto. Journal of. Animal Ecology, 29, 69-84. [ Links ]
Istvánovics, V., Honti, M., Vörös, L., & Kozma, Z. (2010). Phytoplankton dynamics in relation to connectivity, flow dynamics and resource availability—the case of a large, lowland river, the Hungarian Tisza. Hydrobiologia, 637, 121-141. [ Links ]
Kennedy, J. T., & Whalen, S. C. (2008). Seasonality and controls of phytoplankton productivity in the middle Cape Fear River, USA. Hydrobiologia, 598, 203-217. [ Links ]
Köhler, J. (1994). Origin and succession of phytoplankton in a river-lake system (Spree, Germany). Hydrobiologia, 289, 73-83. [ Links ]
Koch, R. W., Guelda, D. L., & Bukaveckas, P .A. (2004). Phytoplankton growth in the Ohio, Cumberland and Tennessee Rivers, USA: inter-site differences in light and nutrient limitation. Aquatic Ecology, 38, 17-26. [ Links ]
Lewis, W. M. (1988). Primary production in the Orinoco River. Ecology, 69, 679-692. [ Links ]
Marinho, M. M., & Huszar, V. L. M. (2002). Nitrogen availability and physical conditions as controlling factors of phytoplankton composition and biomass in a tropical reservoir (Southern Brazil). Archiv für Hydrobiologie, 153, 443-468. [ Links ]
Mathooko, J. M. (2001). Disturbance of a Kenya Rift Valley stream by the daily activities of local people and their livestock. Hydrobiologia, 458, 131-139. [ Links ]
Mitrovic, S. M., Chessman, B. C., Davie, A., Avery, E. L., & Ryan, N. (2008). Development of blooms of Cyclotella meneghiniana and Nitzschia spp. (Bacillariophyceae) in a shallow river and estimation of effective suppression flows. Hydrobiologia, 596, 173-185. [ Links ]
Moses, B. (1987). The influence of flood regime on fish catch and fish communities in Cross River floodplain ecosystem. Environmental Biology of Fishes, 18, 51-65. [ Links ]
Nwadiaro, C. S., & Ezefill, E. O. (1986). Preliminary Checklist of the Phytoplankton of New Calabar River, Lower Niger Delta. Hydrobiological. Bulletin, 19,133-138. [ Links ]
Okogwu, O. I., Nwani, C. D., & Ugwumba, O. A. (2009). Seasonal variability in the abundance and biomass of microcrustacean in relation to environmental variables in two shallow tropical lakes within the Cross River Floodplain, Nigeria. Acta Zoologica Lituanica, 19, 205-215. [ Links ]
Okogwu, O. I., & Ugwumba, O. A. (2009). Cyanobacteria abundance and its relationship to water quality in the Mid-Cross River floodplain, Nigeria. Revista de Biología Tropical. 57, 33-43. [ Links ]
Okogwu, O. I., & Ugwumba, O. A. (2012). Response of phytoplankton functional groups to fluctuating water level in two shallow floodplain lakes in Cross River, Nigeria. Inland Waters, 2, 37-46. [ Links ]
Padisák, J. (1997). Cylindrospermopsis raciborskii (Woloszynska) Seenaya et Subba Raju, an expanding, highly adaptative cyanobacterium: worldwide distribution and review of its ecology. Archiv für Hydrobiologie, 107, 563-593. [ Links ]
Padisák, J., Borics, G., Fehér, G., Grigorszky, I., Oldal, I., Schmidt, A., & Zámbóné-Doma, Z. (2003). Dominant species, functional assemblages and frequency of equilibrium phases in late summer phytoplankton assemblages in Hungarian small shallow lakes. Hydrobiologia, 502, 157-168. [ Links ]
Padisák, J., Crossetti, L. O., & Naselli-Flores, L. (2009). Use and misuse in the application of the phytoplankton functional classification: a critical review with updates. Hydrobiologia, 621, 1-19. [ Links ]
Perbiche-Neves, G., Ferrareze, M. F., Serafim-Júnior, M., Shirata, M. T., & Lagos, P. E. D. (2011). Influence of atypical pluviosity on phytoplankton assemblages in a stretch of a large sub-tropical river (Brazil). Biologia, 66, 33-41. [ Links ]
Reynolds, C. S. (1984). Phytoplankton periodicity: the interactions of form, function and environmental variability. Freshwater Biology, 14, 111-142. [ Links ]
Reynolds, C. S. (1997). Vegetation Processes in the Pelagic: A Model for Ecosystem Theory. Ecology Institute, Germany. [ Links ]
Reynolds, C. S. (2006). The Ecology of Phytoplankton (Ecology, Biodiversity and Conservation). Cambridge University Press, Cambridge. [ Links ]
Reynolds, C. S., Descy, J. P., & Padisák, J. (1994). Are phytoplankton dynamic in rivers so different from those in shallow lakes? Hydrobiologia, 285, 1-7. [ Links ]
Reynolds, C. S., & Descy, J. P. (1996). The production, biomass and structure of phytoplankton in large rivers. Archiv für Hydrobiologie, 113, 161-187. [ Links ]
Reynolds, C. S., & Glaister, M. S. (1993). Spatial and temporal changes in phytoplankton abundance in the upper and middle reaches of the River Severn. Archiv für Hydrobiologie, 101:1-22. [ Links ]
Reynolds, C. S., Huszar, V. L. M., Kruk, C., Naselli-Flores, L. & Melo, S. (2002). Towards a functional classification of the freshwater phytoplankton. Journal of Plankton Research, 24, 417-428. [ Links ]
Rojo, C., Colbelas, M. A. & Arauzo, M. (1994). An elementary structure analysis of the river phytoplankton. Hydrobiologia, 285, 43-55. [ Links ]
Rossetti, G., Viaroli, P. & Ferrari, I. (2009). Role of abiotic and biotic factors in structuring the metazoan plankton community in a lowland river. River Research and Applications, 25: 814-835. [ Links ]
Sabater, S., Artigas, J., Duran, C., Pardos, M., Roman, A. M., Tornes, E. & Ylla, I. (2008). Longitudinal development of chlorophyll and phytoplankton assemblages in a regulated large river (the Ebro River). Science of the total environment, 404, 196-206. [ Links ]
Salmaso, N & Braioni, M. G. (2008). Factors controlling the seasonal development and distribution of the phytoplankton community in the lowland course of a large river in Northern Italy (River Adige). Aquatic Ecology, 42,533-545. [ Links ]
Shannon, C. E. & Weaver, W. (1963). The Mathematical Theory of Communication. University Press, Illinois. [ Links ]
Sellers, T. & Bukaveckas, P. A. (2003). Phytoplankton production in a large, regulated river: a modeling and mass balance assessment. Limnology and Oceanography, 48, 1476-1487. [ Links ]
Soares, M. C. S., Huszar, V. & Roland, F. (2007). Phytoplankton Dynamics in two tropical rivers with different degrees of human impact (Southeast Brazil). River Research and Applications, 23, 698-714. [ Links ]
Søballe, D. M. & Kimmel, B. L. (1987). A large-scale comparison of factors influencing phytoplankton abundance in rivers, lakes, and impoundments. Ecology, 68, 1943-1954. [ Links ]
Tavernini, S., Pierobon, E. & Viaroli, P. (2011). Physical factors and dissolved reactive silica affect phytoplankton community structure and dynamics in a lowland eutrophic river (Po River, Italy). Hydrobiologia, 669, 213-225. [ Links ]
Ter Braak, C. J .F. (1986). Canonical correspondence analysis: A new eigenvector technique for multivariate direct gradient analysis. Ecology, 67, 1167-1179. [ Links ]
Van Nieuwenhuyse, E. E. & Jones, J. R. (1996). Phosphorus-chlorophyll relationship in temperate streams and its variation with stream catchment area. Canadian Journal of Fisheries and Aquatic Sciences, 53: 99-105. [ Links ]
*Correspondencia a:
1Okechukwu Idumah Okogwu:Applied Biology Department, Ebonyi State University, PMB 53, Abakaliki, Ebonyi State, Nigeria;okeyokogwu@yahoo.com
2Alex O. Ugwumba:Department of Zoology, University of Ibadan, Ibadan, Oyo State, Nigeria; adiaha4me@yahoo.co.nz
Received 24-IX-2012. Corrected 23-III-2013. Accepted 24-IV-2013.

