


Services on Demand
Journal
Article
 English (pdf)
 Article in xml format
 Article references
 Send this article by e-mail
Indicators
-
 Cited by SciELO
 -
 Access statistics
Related links
-
 Similars in
SciELO
Similars in
SciELO  uBio
uBio
Share

 Permalink
Revista de Biología Tropical
On-line version ISSN 0034-7744Print version ISSN 0034-7744
Rev. biol. trop vol.61 n.2 San José Jun. 2013
Use of a Geographic Information System and lichens to map air pollution in a tropical city: San José, Costa Rica
Uso del Sistema de Información Geográfica y líquenes para mapear la contaminación del aire en una ciudad tropical: San José, Costa Rica
Uso del Sistema de Información Geográfica y líquenes para mapear la contaminación del aire en una ciudad tropical: San José, Costa Rica
*Dirección para correspondencia:
Abstract
There are no studies of air pollution bio-indicators based on Geographic Information Systems (GIS) for Costa Rica. In this study we present the results of a project that analyzed tree trunk lichens as bioindicators of air pollution in 40 urban parks located along the passage of wind through the city of San Jose in 2008 and 2009. The data were processed with GIS and are presented in an easy to understand color coded isoline map. Our results are consistent with the generally accepted view that lichens respond to the movement of air masses, decreasing their cover in the polluted areas. Furthermore, lichen cover matched the concentration of atmospheric nitrogen oxides from a previous study of the same area. Our maps should be incorporated to urban regulatory plans for the city of San José to zone the location of schools, hospitals and other facilities in need of clean air and to inexpensively assess the risk for breast cancer and respiratory diseases in several neighborhoods throughout the city.
Key words: air quality color code, environmental monitoring, dispersion mapping, lichenology.
Resumen
En Costa Rica no hay estudios de la contaminación del aire basados en los Sistemas de Información Geográfica (SIG). En este artículo se muestran los resultados de un estudio que analizó los líquenes en troncos de árboles de 40 parques urbanos situados a lo largo del paso del viento por la ciudad de San José, durante los años 2008 y 2009. Los datos fueron procesados mediante SIG y se presentan de manera simple en un mapa de isolíneas con códigos de color. Los resultados concuerdan con la opinión generalmente aceptada de que los líquenes reaccionan ante la circulación de masas de aire al decrecer su cobertura en las zonas más contaminadas. Además, la cobertura de líquenes coincidió con la concentración de óxidos de nitrógeno en la atmósfera, tomada de un estudio previo en la misma zona. Nuestros mapas deben incorporarse en los planes reguladores de la ciudad de San José para zonificar la ubicación de escuelas, hospitales y otros edificios que demanden aire puro, así como para identificar de manera económica el riesgo de cáncer de pecho y enfermedades respiratorias en los diferentes barrios de la ciudad.
Palabras clave: calidad del aire, código de color, bioindicadores, monitoreo ambiental, mapa de dispersión, ciudad tropical, liquenología.
Even though most lichen bioindicator studies have been done in temperate regions, lichens have also been used as bioindicators in tropical cities, albeit infrequently. For example, a recent review of lichen biomonitoring studies conducted in one of the largest tropical countries, India, found that despite the obvious advantages of this technique, it has seldom been used in that country (Shukla & Upreti 2012). The same applies to other tropical ecosystems and therefore, studies with lichens as bioindicators from tropical regions have special value (Monge-Nájera et al. 2002b, Anze et al. 2007).
Old methods like the Index of Air Purity (IAP) require more work and time than new methods such as the Random Points Method (Monge-Nájera et al. 2002a,b), but even so they old methods are still used (e.g. Fernández-Salegui et al. 2003, McCarthy et al. 2009, Käffer et al. 2011, Estrabou et al. 2011). In Europe, the IAP has been replaced by the European standard methodology (Llop et al. 2011). A lichen standard cannot be produced for the tropics for lack of updated taxonomic studies (Hawksworth et al. 2005), but fortunately bioindication does not need identification to the species level and the method of Monge-Nájera et al. (2002a,b) is adapted to the ecological and financial conditions of tropical countries.
Lichen bioindication has shown that air pollutants follow air currents in large and small scales. For example, the topographic conditions make the Columbia River Gorge an ‘exhaust pipe’ for air pollutants, which is reflected in deposition and lichen thallus nitrogen (Fenn et al. 2007). Some lichens have evolved resistance to particular contaminants and therefore their presence is not evidence of clean air (Fenn et al. 2007).
To our knowledge, the oldest use of a Geographic Information System (GIS) to analyze and predict traffic pollution was by Moragues & Alcaide (1996), who quantified the human population, wildlife and historic sites affected by different pollution levels, albeit without using lichens. In the field of applied lichenology, GIS have more recently been used to follow the lichen re-colonization of the once highly polluted Ruhr Basin in Germany (Kricke & Beige 2004), and to map lichen species distribution in Germany and Italy (Loppi 2004), but despite its potential (Wei et al. 2012) the technique is surprisingly rare in studies of how pollution changes with the evolution of cities (Monge-Nájera et al. 2002a,b, Shochat et al. 2006).
Specifically in Costa Rica, where this study was conducted, the law states that the use of natural resources must be sustainable, including greenhouse gases and gases that affect the ozone layer (Costa Rica 1993). The use of lichens as bioindicators in Costa Rican ecosystems started in the 1970s with the work of Luis Fournier and collaborators, who used transplants, cell counts and natural communities to assess the air pollution across eleven stations in San José, the capital city (Méndez & Fournier 1980). A decade later, colonies of the European standard lichen, Hypogymnia physodes, were transplanted from Germany to San José, Costa Rica where they survived for months and acquired the appearance of the surrounding local lichens. Thus, from the point of view of biomonitoring, the local species reacted to air pollution like the European standard lichen (Grüninger & Monge-Nájera 1988). Subsequently, it was shown that primary and secondary school students could learn to properly assess air pollution in their tropical communities by simply measuring lichen cover on urban tree trunks, as inspired by the data previously collected in European high schools (Méndez-Estrada et al. 1999).
Another study conducted in Costa Rica but designed for world-wide use, compared three methods to measure lichen cover on tree trunks: (1) the 100 uniform squares template traditionally used in North America, (2) the European 200 uniform points template and (3) computer-generated random points templates (10cm X 20cm), utilizing a 100-point or a 50-point version. The 50 random points template was the best because it reduced time and costs by nearly 50% while maintaining acceptable reliability values (Monge-Nájera et al. 2002b).
The only study in Costa Rica that analyzed the species composition of urban lichen communities found that low cover sites had species resistant to vehicle gases (Sáenz et al. 2007); these were predominantly foliose species with narrow lobes (Physcia and Dirinaria) and the crustose Lecanora (a lichen with relatively lower contact air surface). In the beginning of the 21st century, the average lichen cover in the Eastern part of San José was 36%, a relatively high value that probably reflected a reduction of lead in gasoline and an increase in green areas (Monge-Nájera et al. 2002a, Sáenz et al. 2007).
The most recent study in Costa Rica analyzed 40 parks located along the passage of wind through San José (Neurohr et al. 2011). The study corroborated the hypothesis that air pollution was lower in areas where the wind entered the city and viceversa. It also found that dry season cover was lower, a pattern that contrasts with temperate habitats, which are more influenced by temperature than by rain (Neurohr et al. 2011).
The aim of this article is to complement the previous study (Neurohr et al. 2011) with a detailed GIS map of air pollution and to compare published atmospheric nitrogen oxides (NOx) levels with our lichen cover data. Our hypotheses are that pollution is heterogeneous along the city and that nitrogen oxide levels match pollution reflected in lichen cover.
Materials and methods
The city of San José, Costa Rica (9°56’16’’ N - 84°06’55’’ W) is located at a mean altitude of 1 200m on what was originally a tropical forest. The rainy season is from May through November (around 2 000mm) and temperatures usually range from 20°C to 28°C. The central region, represented in our study, had 350 000 inhabitants in 2010 (Municipalidad de San José 2010, Tribunal Supremo de Elecciones 2011), and has nearly 200 small parks, many of them with lichens on the tree trunks.
We studied the lichen cover on tree trunks in a computer-generated random sample of 40 parks located in the central part of the city. Instead of considering the taxonomic constitution of the community, which is not reliable because the taxonomy of these tropical species has not been updated, we decided to include only the overall cover of foliose lichens, which is a reliable method (Monge-Nájera et al. 2002b).
To measure the lichen cover we used a 10x20cm template with random points, applying it 1.5m above ground to the side with greater lichen coverage; see Monge-Nájera et al. (2002b) for a detailed description and validation of this method, and Neurohr et al. (2011) for a statistical analysis of lichen cover in relation to the wind path.
Lichen cover values were processed with ArcGIS (V 9.3) software to produce a GIS map of pollution isolines with a color code that can be understood by the general public. The most familiar of these codes is the traffic light, associating red with danger, yellow with intermediate conditions, and green with safety. The isoline algorithm used is based on the uniform distribution of the value differences between two adjacent points.
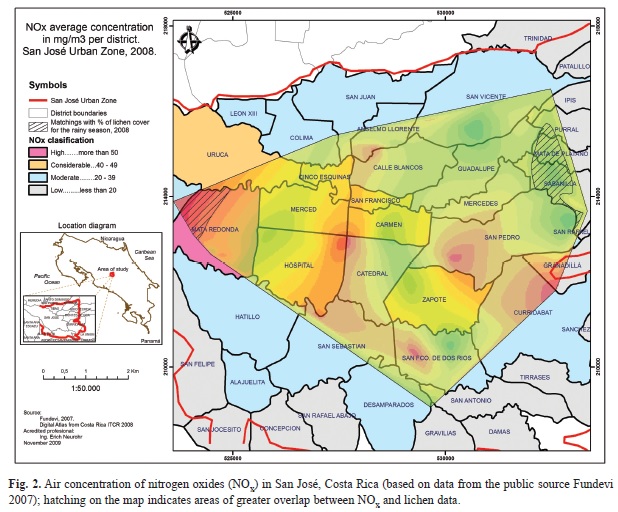
For comparison, we produced a map of nitrogen oxides based on data from the University of Costa Rica Foundation for Research (FUNDEVI) (2007). The FUNDEVI study used a United States Environmental Protection Agency dispersion model to map nitrogen pollution in the San José urban zone (FUNDEVI 2007). We applied a Binomial test (quantitativeskills.com) to the hypothesis that the nitrogen and lichen maps matched; for this, we divided each map into 180 square cells and selected 90 cells with a random number generator (the chosen cells were the same of both maps to make matching possible). We then recorded if the pollution level in each cell was low, intermediate or high. If the level was the same in both maps, we noted it as a match, and viceversa. The results in quantitativeskills.com indicated that the minimal sample size for the test was 17 cells, thus our sample of 90 cells was high above the minimum sample size.
Results
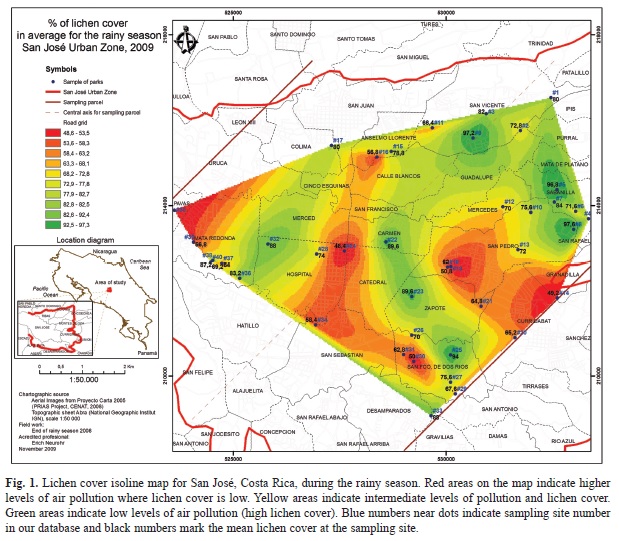
The areas of San José, Costa Rica with low lichen cover -reflecting higher levels of air pollution- are located in three main sections. A smaller section in the West of the city around the Mata Redonda neighborhood; a larger section surrounding the hospital and market areas of Carmen, Catedral, Hospital and Merced (extending North to San Francisco and Calle Blancos), and another small section in Southeast area that includes San Pedro and Curridabat (Fig. 1).
The area with higher lichen cover –and less pollution- is located in the Northeast, where the dominating winds enter the city, and matches the densely populated neighborhoods of Anselmo Llorente, Guadalupe, San Rafael, Sabanilla and Mata de Plátano (Fig. 1). This is a positive finding considering that large numbers of middle and low class people live in this part of the city.
A statistical comparison of the lichen and nitrogen map (Fig. 2) indicates that lichen cover matches the air concentration of nitrogen oxides: 72 of the 90 cells in which we divided the maps, have the same level of air pollution (Binomial test p<0.0001).
The areas of Calle Blancos, Mata Redonda, downtown San José, San Pedro, Curridabat, San Sebastián and San Francisco de Dos Ríos have the lowest means of lichen cover, and consequently the highest levels of pollution. The lowest levels of nitrogen oxides were recorded in Guadalupe and Sabanilla, which correspondingly resulted in increased levels of lichen cover (Figs. 1 and 2).
Discussion
The lichen cover that we found in San José has a clear relation with the nitrogen oxide levels of pollution from automotive traffic origin. Automobiles are the primary source of urban air pollutants in cities such as San José, with low levels of industrial development (Pujol 2002). Our results differ from research conducted in heavily industrialized cities, in which the lower lichen cover values are strongly associated with the location of factories and other industrial facilities (Chiras 2006, Wannaza et al. 2012). These associations are in agreement with our results since San José is used for commerce and services, rather than for factories and industrial activities. In the case of San José, it is advantageous that some densely populated areas of the city have low levels of air pollution.
Our study not only adds to the recent but growing list of projects that use GIS to study air pollution through lichens in urban areas (Conti & Cecchetti 2001, Shochat et al. 2006), but for Costa Rica and Latin America it is innovative by presenting isolines that were mathematically produced by GIS rather than by a more subjective interpretation from sampling points as done in earlier research (Méndez & Fournier 1980, Monge-Nájera et al. 2002a, Kricke & Beige 2004, Ferreira et al. 2012).
In conclusion, our hypotheses that pollution is heterogeneous along the city and that vehicular pollutants match lichen cover are in agreement with the data we obtained. Furthermore, we encourage the use of isoline maps to present better distribution results for large area studies regarding lichen biomonitoring, as done by other recent researchers such as Ferreira et al. (2012) for pollution from cement factories. We believe the laypersons would benefit from the “traffic light” color code maps: these can help them identify areas with higher levels of pollutants to persuade the authorities to take measures for improving air quality. Our color code GIS maps of air pollution should be incorporated when developing urban regulatory plans for the city of San José: the location of schools, hospitals and other facilities in need of clean air can be zoned appropriately, and traffic routes can be changed to mitigate the harmful effects of the atmospheric pollution on the urban inhabitants (Fuga et al. 2008).
Nitrogen oxides are particularly important because they are indicators for traffic-related air pollution and because there is a connection between post-menopausal breast cancer and exposure to nitrogen dioxide (Crouse et al. 2010). The way in which lichen cover corresponds with air concentration of nitrogen oxides in San José, as found in the present study, can be utilized to inexpensively and rapidly assess the risk for breast cancer in several neighborhoods throughout the city.
Real-time pollution maps in cellular telephones allow drivers to avoid undesirable routes (Ehrlich 2009). If the cost of real time systems were reduced to levels affordable for tropical countries, this might be the first real alternative to lichen biomonitoring. Until then, lichens are the most realistic option for Latin America, Africa and other predominantly tropical regions. A third option is a web portal where users can add their own biomonitoring lichen data to demographic and socio-economic indicators (Centre for Development Finance 2010).
Acknowledgments
We thank Liis Marmor, Stefano Loppi, Juri Nascimbene, Katherine Williams and four anonymous reviewers for comments on an earlier draft; Ifigenia Bustamante for her assistance in collecting the lichen cover data, Jonathan Arias for his help with the maps and Karla Vega for her assistance in the map matching test.
References
Anze, R., M. Franken, M. Zaballa, M.R. Pinto, G. Zeballos, M.A. Cuadros, A. Canseco, A. De La Rocha, V.H. Estellano & S. Del Granado. 2007. Bioindicadores en la detección de la contaminación atmosférica en Bolivia. Redesma 1: 53-74. [ Links ]
Centre for Development Finance. 2010. India Online Pollution Map. Centre for Development Finance, Taramani, Chennai, India (Downloaded: April 10, 2012, http://www.indiapollutionmap.org). [ Links ]
Chiras, D.D. 2006. Environmental Science. Jones & Bartlett, Subdury, Massachusetts, USA. [ Links ]
Conti, M.E. & G. Cecchetti. 2001. Biological monitoring: lichens as bioindicators of air pollution assesment – a review. Environ. Pollut. 114: 471-492. [ Links ]
Costa Rica. 1993. Ley de Tránsito por Vías Públicas Terrestres: artículos 34-36. Asamblea Legislativa, San José, Costa Rica. [ Links ]
Crouse, D., M.S. Goldberg, N. Ross, H. Chen & F. Labrèche. 2010. Postmenopausal Breast Cancer Is Associated with Exposure to Traffic-Related Air Pollution in Montreal, Canada: A Case-Control Study. Environ. Health Persp. 118: 1578-1583. [ Links ]
Ehrlich, D. 2009. Mapping out traffic pollution. Gigaom, San Francisco, California (Downloaded: April 10, 2012, http://gigaom.com/cleantech/mapping-out-traffic-pollution/). [ Links ]
Estrabou, C., E. Filippini, J.P. Soria, G. Schelotto & J.M. Rodríguez. 2011. Air quality monitoring system using lichens as bioindicators in Central Argentina. Environ. Monit. Assess. 182: 375-383. [ Links ]
Fenn, M.E., L. Geiser, R. Bachman, T.J. Blubaugh & A. Bytnerowicz. 2007. Atmospheric deposition inputs and effects on lichen chemistry and indicator species in the Columbia River Gorge, USA. Environ. Pollut. 146: 77-91. [ Links ]
Fernández-Salegui, A.B., A. Terrón & E. Barreno. 2003. Biomonitorización de la calidad del aire en los alrededores de La Robla (León, noroeste de España) diez años después. LAZAROA 27: 29-41. [ Links ]
Ferreira, A.B., J.O. Santos, S.O. Souza, W.N.S. Júnior, J. do Patrocínio & H. Alvesa. 2012. Use of passive biomonitoring to evaluate the environmental impact of emissions from cement industries in Sergipe State, northeast Brazil. Microchem. J. 103: 15-20 [ Links ]
Fuga, A., M. Saiki, M. Marcelli & P. Saldiva. 2008. Atmospheric pollutants monitoring by analysis of epiphytic lichens. Environ. Pollut. 151: 334-340. [ Links ]
FUNDEVI. 2007. Estudio de análisis y prospección del sistema urbano de la Gran Área Metropolitana GAM. Informe final. FUNDEVI, San José, Costa Rica. [ Links ]
Grüninger, W. & J. Monge-Nájera. 1988. Use of temperate lichen Hypogymnnia physdes (Parmeliaceae) to evaluate air pollution in the Tropics. Rev. Biol. Trop. 36: 545-547. [ Links ]
Hawksworth, D.L., T. Iturriaga & A. Crespo. 2005. Líquenes como bioindicadores inmediatos de contaminación y cambios medio-ambientales en los trópicos. Rev. Iberoam. Micol. 22: 71-82. [ Links ]
Käffer, M.I., S.M.A. Martins, C. Alves, V.C. Pereira, J. Fachel & V.M.F. Vargas. 2011. Corticolous lichens as environmental indicators in urban areas in southern Brazil. Ecol. Ind. 11: 1319-1332. [ Links ]
Kricke, R. & G.B. Beige. 2004. Changes in epiphytic lichen flora in urban environments. Lichens in a changing pollution environment. Engl. Nat. Res. Rep. 525: 27-30. [ Links ]
Llop, E., P. Pinho, P. Matos, M.J. Pereira & C. Branquinho. 2011. The use of lichen functional groups as indicators of air quality in a Mediterranean urban environment. Ecol. Ind. 13: 215-221. [ Links ]
Loppi, S. 2004. Mapping the effects of air pollution, nitrogen deposition, agriculture and dust by the diversity of epiphytic lichens in central Italy. Lichens in a changing pollution environment. Engl. Nat. Res. Rep. 525: 37-41. [ Links ]
McCarthy, D.P., B. Craig & U. Brand. 2009. Lichen Monitoring of Urban Air Quality, Hamilton, Ontario. Develop. Environ. Sci. 9: 247-267. [ Links ]
Méndez-Estrada, V.H., M. Rivas-Rossi & J. Monge-Nájera. 1999. Los líquenes como bioindicadores y su uso por parte de estudiantes para monitorear la contaminación atmosférica. I Congreso Interuniversitario de Biodiversidad. Ciudad de la Investigación, Universidad de Costa Rica. Universidad de Costa Rica, San José, Costa Rica. [ Links ]
Méndez, O. & L. Fournier. 1980. Los líquenes como indicadores de la contaminación atmosférica en el área metropolitana de San José, Costa Rica. Rev. Biol. Trop. 28: 31-39. [ Links ]
Monge-Nájera, J., M.I. González, M. Rivas & V.H. Méndez. 2002a. Twenty years of lichen cover change in a tropical habitat (Costa Rica) and its relation with air pollution. Rev. Biol. Trop. 50: 309-319. [ Links ]
Monge-Nájera, J., M.I. González, M. Rivas & V.H. Méndez. 2002b. A new method to assess air pollution using lichens as bioindicators. Rev. Biol. Trop. 50: 321-325. [ Links ]
Moragues, A. & T. Alcaide. 1996. The use of a geographical information system to assess the effect of traffic pollution. Sci. Total Environ. 189-190: 267-273. [ Links ]
Municipalidad de San José. 2010. Información básica del Cantón de San José. Municipalidad de San José, San José, Costa Rica. [ Links ]
Neurohr, E., J. Monge-Nájera & M.I. González. 2011. Air pollution in a tropical city: the relationship between wind direction and lichen bio-indicators in San José, Costa Rica. Rev. Biol. Trop. 59: 899-905. [ Links ]
Pujol, R. 2002. Estudio de indicadores urbanos en el área metropolitana de San José. Flota vehicular. ProDUSUCR, San José, Costa Rica. [ Links ]
Sáenz, A.E., F. Flores, L. Madrigal & J.F. Di Stefano. 2007. Estimación del grado de contaminación del aire por medio de la cobertura de líquenes sobre troncos de árboles en la ciudad de San José, Costa Rica. Brenesia 68: 29-35. [ Links ]
Shochat, E., P. Warren & S.H. Faeth. 2006. Future directions in urban ecology. Trends Ecol. Evol. 21: 661-662. [ Links ]
Shukla, V. & D.K. Upreti. 2012. Air Quality Monitoring with Lichens in India. Heavy Metals and Polycyclic Aromatic Hydrocarbons. Environ. Chem. Sust. World 1: 277-294. [ Links ]
Tribunal Supremo de Elecciones. 2011. San José, Costa Rica. (Downloaded: April 10, 2012, http://www.tse.go.cr/tseficha/datos/sanjose.pdf. [ Links ]
Wannaza, E.D., H.A. Carreras, J.H. Rodriguez & M.L. Pignata. 2012. Use of biomonitors for the identification of heavy metals emission sources. Ecol. Indic. 20: 163-169. [ Links ]
Wei, H., H. Zhang, M. Jingsong, G. Chen & J. Wang. 2011. The dynamic expression of three-dimensional meteorological thematic fields based on WebGIS. 19th International Conference on Geoinformatics Conference Publications (Shanghai, 24-26 June 2011): 1-5. [ Links ]
*Correspondencia:
Erich Neurohr Bustamante: Laboratorio de Ecología Urbana, Universidad Estatal a Distancia, 2050 San José, Costa Rica. eneurohr@iecainternacional.com
Julián Monge-Nájera: Laboratorio de Ecología Urbana, Universidad Estatal a Distancia, 2050 San José, Costa Rica. julianmonge@gmail.com
Víctor Hugo Méndez-Estrada: Laboratorio de Ecología Urbana, Universidad Estatal a Distancia, 2050 San José, Costa Rica. vmendez@uned.ac.cr
1. Laboratorio de Ecología Urbana, Universidad Estatal a Distancia, 2050 San José, Costa Rica; eneurohr@iecainternacional.com, julianmonge@gmail.com, vmendez@uned.ac.cr
Received 23-IV-2012. Corrected 23-IX-2012. Accepted 18-X-2012.

