


Services on Demand
Journal
Article
 English (pdf)
 Article in xml format
 Article references
 Send this article by e-mail
Indicators
-
 Cited by SciELO
 -
 Access statistics
Related links
-
 Similars in
SciELO
Similars in
SciELO  uBio
uBio
Share

 Permalink
Revista de Biología Tropical
On-line version ISSN 0034-7744Print version ISSN 0034-7744
Rev. biol. trop vol.60 n.2 San José Jun. 2012
A revised strategy for the monitoring and management of the Galapagos sea cucumber Isostichopus fuscus (Aspidochirotida: Stichopodidae)
*Dirección para correspondencia:
Abstract
The brown sea cucumber fishery is active in the Galapagos Islands since the year 1991 after its collapse in mainland Ecuador. This paper analyzes the Galapagos Sea cucumber fishery over the past decade and the reasons for its management pitfalls and chronic over fishing, and proposes an improved strategy for estimating stock size and harvest potential. Based on the historical distribution of the fishing fleet and past fishery surveys, 15 macrozones were defined; their areas were estimated from the coastline to the 30m isobaths and the numbers of sample replicates per macrozone were calculated for a density estimate precision of ±25%. Overall stock size was calculated by summing over all macrozones and was multiplied by 0.122 to obtain the annual quota. This multiplier was derived by inserting an exploitation rate of E=0.3 and a published natural mortality value of M=0.17 into Cadimas formula, thereby obtaining a more conservative precautionary quota estimate. Pre-fishery stock densities in 2009 were below the legal threshold value and the fishery remained closed. Mean densities were significantly lower in the deeper (>15m) than in the shallower (<15m) stratum, contrary to fishermen expectations. Through an empirical regression of (log) pre-fishery density versus subsequent annual catch for the period 1998-2008 we found that catches of most years greatly exceeded the here proposed quota explaining the collapsed nature of the stock. Rev. Biol. Trop. 60 (2): 539-551. Epub 2012 June 01.
Key words: Galapagos, invertebrates, over fishing, quota, sea cucumber.
Resumen
Este artículo analiza la pesqueria del pepino de mar en Galapagos, durante la decada pasada y se estudian las razones de su dificil manejo y la sobre-explotacion cronica. El objetivo principal de este trabajo fue proponer una estrategia mejorada para estimar el tamano poblacional y el potencial de captura. Se definieron 15 macrozonas, y para ello se tomo en cuenta la distribucion historica de la flota pesquera y los resultados de prospecciones pesqueras pasadas. Las respectivas areas fueron estimadas desde la linea de costa hasta la isobata de los 30m. El numero de replicas de muestreo por macrozona fueron calculadas para estimar la densidad poblacional con una precision del ±25%. El tamano poblacional total fue calculado sumando la densidad poblacional de todas las macrozonas, luego el resultado fue multiplicado por 0.122 para obtener la cuota anual de captura. Este factor de multiplicacion fue derivado mediante la formula de Cadima, en la cual se considero una tasa de explotacion (E) de 0.3 y una tasa de mortalidad natural (M) de 0.17. Estos resultados permitieron obtener una estimacion precautoria y mas conservadora de la cuota total de captura. La densidad poblacional pre-pesqueria en 2009 estuvo por debajo del punto de referencia limite establecido, en consecuencia fue declarada en veda. Las densidades poblacionales promedio fueron significativamente menores a profundidades mayores a los 15m, contrario a lo esperado por los pescadores. A traves de una regresión empirica entre el logaritmo de la densidad poblacional prepesqueria y la subsecuente cuota de captura anual para el periodo 1998-2008, se descubrio que las capturas totales en la mayoria de los anos han excedido la cuota de captura propuesta en este articulo, lo que explica el estado actual de este recurso, el cual se encuentra colapasado.
Palabras clave: Galapagos, invertebrados, sobre-pesca, cuota, pepino de mar.
The small scale fishery of the brown sea cucumber (Isostichopus fuscus, Ludwig, 1875), one of the most commonly found species in the Eastern Pacific (Maluf 1991), started in the Galapagos Islands in 1991 after its fishery collapse in mainland Ecuador (De Paco et al. 1993, Powell & Gibbs 1995, Martinez 2001). A fishery based on this species lasted only six years in Baja California (Aguila-Ibarra & Ramirez-Soberon 2002). The Galapagos pepino diving fishery operates in shallow waters of usually less than 30m depth. Of a total number of 1 032 fishermen presently registered, the number involved with the sea cucumbers has greatly varied over the years (Castrejon 2009). During the most recent season (2009) less than 30% of registered fishermen have participated in the fishery.
After the start of the fishery in Galapagos, catches rose and during the “peak period” 1999 to 2005 almost 30 million sea cucumbers were harvested legally within the Galapagos Marine Reserve (GMR) corresponding to a total fresh weight of >8 000t. Catches peaked in the year 2002 with over 8.3 million individuals (Fig. 1), but continuously decreased thereafter. During the fishing season of 2008 only about 0.86 million individuals were caught, although a total allowable catch (TAC) of 1.3 million had been agreed upon by the Participatory Management System (PMS), which is in place in Galapagos since 1998. The great decrease in catches after 2002 is generally explained by strong over fishing, driven by a Chinese market, where this species is appreciated and of high market value (Toral-Granda 2008). The boom and bust situation of the Galapagos sea cucumber followed by a prolonged period of a very low stock sizes, has also been described for many other sea cucumber species worldwide (Conand 2004, Uthicke 2004). This seems at least partly due to the fact that most species are fairly slow growing with low population productivity and great vulnerability to overfishing (Toral-Granda et al. 2008).
Isostichopus fuscus is gonochoric, but does not display sexual dimorphism. Fifty percent of individuals from Galapagos attain sexual maturity at 23.6cm, although individuals of 16cm with developing gonads have been recorded (Toral-Granda 1996). Reproductive activity occurs throughout the year and is thought not to be affected by temperature in the Galapagos Islands (Toral-Granda 1996); while in Mexico, increased reproductive activity was observed in the warm water season (Herrero-Perezrul et al. 1999). Larvae are planktotrophic (Toral-Granda 1996) and transparent, and display indirect development (Hamel et al. 2003). Under aboratory conditions, metamorphosis and settlement of 1mm juveniles can occur 28 days after fertilization (Hamel et al. 2003). Herrero-Perezrul et al. (1999) obtained preliminary population parameters of I. fuscus from Mexico, which included estimations of asymptotic length (L∞=36.118cm) and growth coefficient (K=0.180/yr). In a later study, Reyes-Bonilla & Herrero-Perézrul (2003) obtained a smaller infinite length and a higher k-value (L∞=29.108cm, K=0.243/yr). These growth parameters suggest a life span of this species between 12-17 years.
The starting fishery was centered in Western Isabela and Fernandina (Fig. 2), where population densities were highest. A pilot population study off Fernandina in 1993 yielded a mean density of 6.24ind./m2 (Aguilar et al. 1993), and later assessments recorded between 0.8-6.2ind./m2 in the Canal Bolivar area (Aguilar et al. 1993, Richmond & Martinez 1993). A stock depletion model run in this area (Hearn et al. 2005) yielded initial densities of adults (>16cm TL), between 0.27-0.40ind./m2 from 1994 to 1997, similar to those obtained in 1999 (Toral-Granda & Martinez 2004). Currently, densities have decreased by about an order of magnitude to 0.03ind./m2 (Murillo et al. 2008, this study).
A strong recruitment event of the I. fuscus population in Galapagos was registered in 2000 in the Canal Bolivar area (Murillo et al. 2002, Hearn et al. 2005), which ended in 2002.
The steadily decreasing catches of the sea cucumber fishery over the past decade (following the peak of 2002), are mainly the results of a chronic over fishing that has not allowed the stock recuperation (Hearn et al. 2005). The main reasons are an overcapacity of the fleet, a reactive instead of proactive management, and a ‘race for fish’ situation, the lack of control as well as difficult enforcement of the fishery regulations in this large archipelago with far away fishing zones, which also leads to illegal fishery. In addition to these problems, the determination of an annual quota by the managers of the marine reserve and the scientists involved, had not been derived from stock size estimates and scientific reasoning about an acceptable fraction of the annual stock to be harvested. Instead, the quota was negotiated by the co-management system in place (except for the boom year of 2002). Only in 2009 a limit reference point (LRP) of 11ind./100m2 was implemented and the fishery may only be opened once the stock density in the principal fishing area of Isabela as derived from the pre-fishery monitoring is above this reference value (Comision Tecnica Pesquera de la Junta de Manejo Participativo 2009). LRP reflects the lower end of a mean density range (11-20ind./100m2) observed during historical surveys and characteristic for a stock in recuperation. Below this density interval the stock is considered to be in a critical stage, above in a healthy stage (Castrejon et al. 2008). These measures caused two problems. The first was that fishermen preferentially monitored areas, where densities had traditionally been above average, not representing the overall mean density of all macrozones. The second problema was that once the fishery was opened, fishermen would take out all adult sea cucumbers (>20cm total length), that they could find within their economic constraints. In years, when quota was negotiated, there was a lack of an adequate stock monitoring design and the poor information available did not allow for a precise quota calculation. As a result the quota was usually too high with the result that the remaining post-fishery stock was extremely small, lacking the potential for biomass to rebuild up to the next year’s fishing season. Due to these problems associated with the management of the Galapagos sea cucumber fishery, we aimed to improve the monitoring and management strategy.
Our research goals were to: (1) optimize stock evaluation procedures by considering macrozone differences in density and stock distribution, and (2) to provide a scientific basis for the estimation of an annual quota. Specific research questions addressed were: a) are there spatial-temporal differences in sea cucumber densities within the fishing area, for the period 1999-2009, which would allow to classify key areas/macrozones of sea cucumber distribution in the archipelago? b) Is there an observable spatial-temporal trend in sea cucumber size distribution? (i.e. are there macrozones and years of higher numbers of recruits?) c) Are stock densities higher in deeper (>15m) than in shallow (<15m) waters as suggested by fishermen? d) Can we derive an estimate on stock productivity based on available literature, which allows for the calculation of a reasonable catch quota from annual estimates of stock size?
Material and methods
Estimation of fishing areas (macrozones): The design of the new monitoring plan was derived from information of past monitoring surveys carried out annually from 1999 to 2008. Two types of monitoring had been carried out, pre-fishing and post-fishing. Since the prefishing data were generally more complete and consistent (Vadas 2008), we decided to focus on those for the analysis. The monitoring effort of all years was aimed to cover the principal fishing areas as well as no-fishing areas. This resulted in very large areas and for several of them in wide confidence limits around the density estimates.
The first 19 macrozones for the islands of Fernandina, Isabela, Espanola, Floreana, San Cristobal and Santa Cruz were defined considering the principal sea cucumber fishing zones as derived from fisheries statistics of the PNG and CDF of the period 2001-2008. Due to insufficient financial resources and because fishermen insisted that four of the previously defined macrozones (east Santa Cruz, East and South-East Isabela and East Floreana) are not currently used as fishing zones, the macrozones surveyed in this study were reduced to 15.
Each macrozone was delimited using georeferenced catch data from the participative monitoring programme conducted during this period by the following procedure: bathymetric data compiled by Chadwick (1994) for the depth range from 0-1 500m depth, as well as from the CDF Geographical Information System (coastline CDF/Clirsen-TNG/GNPS) data from 0-39m were subjected to an ArcGIS Triangulated Irregular Network (TIN) interpolation routine, which creates circumcircles around each selected sample point and their intersections are connected to a network of non overlapping triangles, being as compacted as possible. Based on this interpolation a -30m isobath, which is the maximum depth where fishing can be carried out, was created. With the isobath line as the outer and the coastline as the inner boundary, the area of each polygon (m2) was mapped. A histogram was created to describe the frequencies of points per depth strata and an analysis was done to describe mean distances between points by using nearest neighbor statistics (ArcGIS and Surfer). Only 50% of the estimated area was considered as suitable sea cucumber fishing area and habitat, given that approximately 20% has unsuitable sandy bottoms and another 30% is too shallow (<5m intertidal waters), or uninhabitable steep slopes (Banks et al. 2006).
Determination of transect number per macrozone: In order to estimate the required number of transects per macrozone, we proceeded as follows: first, means and standard deviations of stock densities obtained during past surveys were calculated for each zone. Then, 95% confidence intervals around the mean stock densities were estimated for each zone and 95% confidence intervals around the mean stock densities were calculated; second, the homogeneity/degree of patchiness of sea cucumber distribution per macrozone as reflected by those statistics was then used to calculate the minimum number of replicates necessary per macrozone to achieve a precisión of ±25% applying the following formula:
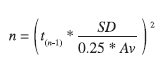
with n=minimum number of replicates required to achieve a precision of ±25% around our estímate of mean density; t=value of the t distribution (student’s t-test) for p<0.05; Av=annual average of the sea cucumber density per macrozone and SD = standard deviation.
Using the above formula, differences in spatial distribution and stock density per macrozone resulted in different numbers of replicates required for the different areas, with more replicates for areas of higher patchiness, and lower numbers where the population appears more evenly distributed. Based on this procedure population size estimates are considered substantially more precise than if the replicate number was just proportional to the size of the area.
Sampling: The type of sample unit used was a circular transect with a radius of 5.6m which covers an area of 100m2. This has been used in monitoring activities before and has proven to allow for the collection of available sea cucumbers with low error (Hearn et al. 2005). Moreover, using this sample unit unbiased comparisons with previous surveys became possible. The exact location of each transects in each macrozone was decided jointly between fishermen and scientists with the aim to adequately cover each area. The sampling sites were distributed in two depth strata: shallow (<15m) and deep (>15m), with the shallowest and deepest waters around five and 25m respectively.
The stock size per macrozone was estimated extrapolating the mean density value (ind./m2) to the corresponding total area. Then, the stock sizes of each macrozone were added up to estimate the stock for the whole fishing area.
The mean density value within the West Isabela macrozone was then compared with the sea cucumber reference points defined in the Fishery Chapter of the Management Plan for the Galapagos Marine Reserve (GMR) (Castrejon et al. 2008, Comision Tecnica Pesquera de la Junta de Manejo Participativo 2009). According to these reference points a healthy, abundant stock should have a West Isabela macrozone density >21ind./100m2, while densities of a stock in recuperation should range from 11-20.9 ind./100m2. If densities are <11ind./100m2, the stock is closed for fishing.
Precision of density estimates and density comparisons between depth strata: Since the density values of each macrozone proved to be not normally distributed, a bootstrap resampling routine (Efron 1981) was applied, which consisted in a random resampling (1 000x) of the data matrix for each macrozone. This yielded 1 000 normally distributed mean density values and allowed for the computation of the standard deviation and coefficient of variation (CV%) around the mean of these values.
In order to test for depth strata differences in sea cucumber densities, all density measurements taken in each depth stratum (shallow and deep), were considered for the calculation of overall means per depth strata. The resulting mean densities were bootstrapped for each depth stratum and compared using a t-test of means. For comparative purposes also a non-parametric Mann-Whitney U test for the medians was applied. We repeated this analysis by combining the information of sea cucumber density per depth strata for all those years where sufficient samples had been taken (1999-2002 and 2006-2009).
Calculating the catch quota. Annual stock production can be calculated by multiplying mean stock size by the rate of total production (P/B=Z) which is the sum of natural (M) and fisheries (F) mortalities. P/B tends to increase with fishing pressure while the stock biomass decreases. Gulland (1971) and Garcia & Le Reste (1981) proposed to approximate the maximum sustainable yield (MSY) of a stock from an estimate of its virgin biomass (B∞) and the rate of natural mortality (M). They propose: MSY = X* M*B∞ (With X=0.5 in the formula of Gulland and in the range of 0.32-0.44 in the formula of Garcia and Le Reste respectively). If a resource is heavily exploited and virgin stock levels can not be determined this formula should not be applied. Cadima (in Troadec 1977) proposed to use the following formula instead:
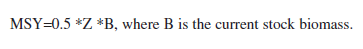
This formula is identical to MSY=M*B, if F=M at an exploitation rate of E=0.5.
Garcia et al. (1989) pointed out that Cadima’s formula only gives unbiased estimates of MSY if the stock is virgin and Z=M (when it is identical to Gullands formula mentioned above) or when the stock happens to be exploited at the level of MSY already (at B∞/2 and an exploitation rate of 0.5).
Considering this reasoning of the above authors and assuming that the current stock level of the Galapagos Sea Cucumber is far below B∞/2 it was decided to use a lower (precautionary) exploitation rate of E=0.3 when applying the Cadima formula. The M- value (0.17/year) of Hearn et al. (2005) was used, which was derived from a stock depletion model. This value was based on a rich data source and appears as a sound estimate in the right order of magnitude, when compared to other slow growing marine invertebrates reported in the literature (Brey 2001). A value double as high for this species in Mexico (M= 0.354/year) was proposed by Reyes-Bonilla & Herrero-Perézrul (2003), who, however used empirical formulas for its derivation, which were not established for holothurians.
Considering this M value of 0.17 the F value was calculated corresponding to an exploitation rate of E=0.3 by calculating:
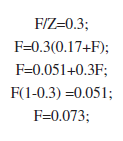
By inserting the F and M values in the Cadima formula (above), we arrived at:
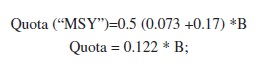
The annual quota here proposed is thus 12.2% of the standing stock.
Results
Estimates of macrozone areas and number of transects per macrozone: Figure 2 shows the distribution of sea cucumber fishing activities in the archipelago for the years 2001 and 2008 and the 15 macrozones using these data. Table 1 gives their extension and the numbers of replicates per macrozone required for a mean stock density estimates <±25% precision. It also provides the density estimates and quota per macrozone derived from the monitoring survey of 2009. The overall estimate of fishable area of all macrozones combined is 124.8km2.
The population monitoring was carried out in the last two weeks of May 2009 by fishermen, National Park and CDF staff coordinated and financed mainly by the National Park. San Cristobal is the island with the largest fishing area (52km2), followed by Isabela (33km2) and Santa Cruz (20.4km2). Floreana, Espanola and Fernandina combined only represent 20km2. While the coastline of Isabela where fishing takes place is much larger than the one of San Cristobal, the fishing area is smaller due to the very steep slope bringing the -30m isobath much closer to the coastline in Isabela than in San Cristobal. It is interesting to see that replicate numbers vary greatly between zones with Espanola requiring the highest number per area (49/5km2), while Santa Cruz requires only 31 transects in 20.5km2.
Densities and catch quota for the season 2009: Mean density for West-Isabela (3.72ind./100m2) is far below the critical value for the opening of the fishery (11ind./100m2) and was de lowest ever recorded in the last decade (Fig. 3). So, following the decision rule in place, it was recommended not to open the fishery for the year (2009). This recommendation was thereafter accepted by the co-management body (Interinstitutional Management Authority, IMA). The densities of all macrozones with the coefficient of variation around the mean (CV, %) are given in Table 1. If our rationale for a quota (TAC) estimate based on the stock size (4.9 million individuals) derived from the overall mean density (0.039ind./m2) and our combined area estimate (124.8km2) had been followed, the TAC would have been 59 889 individuals for the 2009 fishing season for the whole archipelago.
Figure 4 shows the mean densities (left) and the proportion of small (<20cm) sea cucumbers in the samples (right). Floreana, Isabela and Fernandina show a steady density decrease over the past years, while Santa Cruz has remained quite constant over the past six years. The density value of San Cristobal in 2009 was surprisingly the second highest since 1999.
The proportion of juveniles (recruits) in the stock has steadily decreased for the Western islands Isabela and Fernandina and is the lowest ever recorded in Espanola and Floreana. Santa Cruz and Cristobal revealed a slight increase over the last three years.
The 2009 monitoring data for the two depth strata showed higher densities in the shallow stratum compared to the deep stratum (4.5 compared to 3.2ind./100m2 respectively). Statistically, this difference was significant if the non-parametric Mann-Whitney U test of the median density values was used or if the mean values using the bootstrapping routine were compared (t-test, p<0.05). The density difference between depth strata was even more pronounced, when the data of eight years was combined (8.7 versus 17.9ind./100m2 for deep and shallow strata respectively).
Discussion
This study is the first in trying to estímate the fishing area of the sea cucumber stock of Galapagos, which seemed imperative if overall stock size was to be approximated for quota calculations. Since the topography and slope of the sea bottom varies substantially between macrozones, and available bathymetric data points were not covering all areas uniformly, the mapping of the polygons between the coastline and 30m isobath using ArcGIS required an interpolation procedure. The TIN interpolation used to define the -30m isobath for our 15 macrozones was supported by 8 615 geographical data points over the depth range from 0-1 500m, of which a large proportion (3 228 points, 37.5%) were situated within the macrozone depth limits. Based on a nearest neighbor analysis, a separation value for the mean distance between points was found equal to 0.0031589 with a standard deviation of 0.0054607 (degrees).
While we believe that our first fishing area estimate is a good approximation, it can definitely be improved through a more detailed bathymetric survey of the coastlines of the Galapagos Archipelago.
The assumption was then made that of the estimated area 20% is unsuitable Sandy bottom habitat and 30% too shallow (<5m) intertidal water or comprised by too deep waters (>25m) or inhabitable steep slopes. These assumptions are derived from a decade of sub-tidal macrofauna monitoring, as well as specific pre-and post-fishery monitoring reflecting a sufficient amount of data and the best estimate available for this study. It should be stated here, that the Ecuadorian Oceanographic Institute (INOCAR) has already started to conduct a mapping of the whole Galapagos coastal sub tidal areas using side scan sonar technology. We expect to soon be able to update our here presented estimates based on this information.
Only 383 out of 547 planned transects (70%) could be carried out during the 2009 pre-fishery monitoring due to financial constraints. However, this transect number is the highest ever used in the Galapagos sea cucumber pre-fishery monitoring (the second highest was 303 transects taken in the year 2008). The precision around the mean densities differs between macrozones with a coefficient of variation (CV) ranging from 12.2% for Eastern Espanola (n=27/a=2.1km2) to 81.2% for Southern Fernandina (n=4/a=8.5km2). These differences can be attributed to the number of transects and the degree of patchiness of the sea cucumbers in each zone. When the transect data are integrated for each island, the respective density estimate is greatly improved with CVs always <25%. The two islands that had the highest transect numbers (Isabela with 125 and San Cristobal with 97) had the lowest CV around the mean density estimate (11.6% and 13.3% respectively). The density estímate for all transects combined (3.94ind./100m2,CV=6.8%) can be considered of a very good precision. The great differences in densities and stock aggregation found between areas have been emphasized as being symptomatic for sea cucumber populations in general. Hand & Rogers (1999) summarized this problem by pointing to the variable spatio-temporal distribution of sea cucumbers, which make random surveys and conventional statistical approaches inappropriate. They also argue for the collection of ancillary information, such as substrate type to increase the precision of density estimates and for the use of geostatistical analysis and GIS to map the sea bed for benthic invertebrates. In our study, we followed the reasoning of these authors and our statistical analysis suggests that our macrozone and overall density estimates are good in general. However, some directed sampling has possibly occurred since fishermen often argued for sampling in those areas, where they had found sea cucumbers in previous years, sometimes not permitting full random sampling in each macrozone.
Of all macrozones sampled, none reached the minimum density of 11ind./100m2 to open the fishery, which points to a very critical state of the stock in all macrozones. Several factors may explain this situation. During years 1999-2002 the seasonal fishery was opened without quota limits, and the stock was depleted to extreme low densities, not keeping a large enough residual biomass for the next season. In years, when catch quota were determined through the co-management process, these were often too high, representing too large a part of the available stock. This may be illustrated by the example of the year 2004, when a mean density of 7ind./100m2 was counted during the pre-fisheries monitoring and a catch quota of three million individuals as agreed upon, 2.5 times the number which would have been estimated considering the reasoning of this study (12.2% of 8.73 million individuals, which are only 1.06 million). The general problem was that the quota was set with no available estimate of absolute stock size.
The density and recruit fraction trend over the past decade, suggests a further reason for the critical state of the stock: a lack of substantial recruitment during the past decade of predominant cold waters. Since the strong El Nino 1997/98, which seemed to have improved recruitment of sea cucumbers to the fishery during the years 2000-2003, sea surface temperatures (SST) around the Galapagos archipelago have remained quite low for most of the time representing an extended La Nina cold regime (Wolff 2010; see also SST data base of CDF on www.cdf.org.ec). So it may well be that in addition to the problem of a too small spawning stock remaining after each fishing season, spawning activity as well as larval and pre-recruit survival, may have been comparatively low during these years. Unfortunately, as yet little is known about the environmental window for optimal reproduction and early life stages development of this species. The strongest reduction in recruit proportions within the monitoring surveys over the past years was found in the Western islands Isabela and Fernandina, which were strongly exposed to cold upwelling waters during the past years of La Nina regime. The El Nino 1997/98 warming, on the other hand, seem to have caused strong recruitment in these areas, leading to enormous stock densities during the post-El Nino years 2000-2003. This positive El Nino warming effect on the recruitment of I. fuscus was first published by Herrero-Perézrul et al. (1999). Santa Cruz is the only island, where the fraction of small specimens <20cm seem to have increased over the past years 2008 and 2009. However, since mean density has not increased in parallel, this relative increase in small specimens is rather a sign of heavy depletion of larger adults than of a successful recruitment. In Espanola a density increase during the year 2007 was paralleled by an increased fraction of small specimens, which may suggest a small recruitment here.
In this report, an empirical relationship between the pre-fishery (log) density obtained through the annual monitoring surveys and the catches obtained later in the same year has been assembled. While there is a great scatter around the regression line, possibly partly due to differences in monitoring precision between years (see discussion above), the figure shown suggests a significant relationship between both variables. The quota estimate for all these years was included when the fishery was opened and it is evident that catches taken were in most cases far higher (2-3 times) than the quota that would have been recommended using the reasoning of this study. This, however, is not the case for the years 2007 and 2008, when less sea cucumber were fished, than the quota would have allowed. We think that this discrepancy is due to great overestimates of mean pre-fishery stock densities in these years (through which too high quota were negotiated).
The often heard statement by the fishing sector that sea cucumber densities are higher in deeper waters giving the stock a strength in reserve if fishing pressure in shallower waters is high, could clearly be shown to be wrong for the year 2009, and also for the combined data of the eight year’s period. This is an important finding of our study since it removes the basis for the argument that a large portion of the stock is out there in deeper waters where it can not be caught.
We believe that the monitoring and management strategy of the Galapagos sea cucumber stock that has been presented in this paper is an important step towards a sustainable fishery of this species. It is the first time that the attempt was made to estimate the size of the whole fishing area and of the fishable stock. Moreover, the monitoring was adapted to specific conditions (size and sea cucumber patchiness) of each macrozone, and the quota was made a fraction of the stock size (12.2%), which makes it adaptive to natural inter-annual stock fluctuations.
As a future step it may be considered to look for spatially-explicit tools for management of the Galapagos sea cucumber such as the implementation of territorial use rights (Defeo & Castilla 2005) or rotational closures of different areas from year to year. The first seems difficult in Galapagos because there are more fishermen with licenses than active fishermen and stock productivity is not evenly distributed over the different macrozones and also seems to vary spatially and temporally, which makes difficult a possible distribution of sub-areas to fishermen groups. The latter, however, seems a viable approach and our study provides a good basis through the classification and delimitation of macrozones and the estimation of their relative contribution to the overall stock. Closing macrozones completely for the fishery over a longer period of several years, would allow for a substantial stock rebuilding, and fertilization success should increase in these higher density areas and population wide recruitment may result. While this paper is being written, the National Park of Galapagos and the Charles Darwin Foundation are preparing for a pilot project for stock enhancement of the Galapagos sea cucumber through the collection of wild larvae in areas closed to the fishery. If successful, this project would allow for an acceleration of the stock rebuilding process.
Acknowledgments
We want to thank all participants of the monitoring survey of 2009: H. Reyes, J. Paredes, G. Vasquez, M. Villalta, L. Garcia, W. Fuertes, O. Ricaurte, J. Garcia, Y. Llerena, Y. Mascarell, M. Ortega, J.L. Ballesteros, J. Pilamunga, P. Espinoza, W. Bran, J. Araujo, L. Lozano, F. Lucas, F. Parrales, Y. Araujo, A. Yamuca, F. Velez, J. Camacho, C. Lozano, I. Maffare, P. Tipan, L. Bonilla, G. Gil, J. Moreno, J. Delgado, S. Clarke, J.P. Tiernan, J.C. Murillo, S. Cruz, the National Park of Galapagos and the WWF. This publication is contribution number 2048 of the Charles Darwin Foundation for the Galapagos Islands.
After the start of the fishery in Galapagos, catches rose and during the “peak period” 1999 to 2005 almost 30 million sea cucumbers were harvested legally within the Galapagos Marine Reserve (GMR) corresponding to a total fresh weight of >8 000t. Catches peaked in the year 2002 with over 8.3 million individuals (Fig. 1), but continuously decreased thereafter. During the fishing season of 2008 only about 0.86 million individuals were caught, although a total allowable catch (TAC) of 1.3 million had been agreed upon by the Participatory Management System (PMS), which is in place in Galapagos since 1998. The great decrease in catches after 2002 is generally explained by strong over fishing, driven by a Chinese market, where this species is appreciated and of high market value (Toral-Granda 2008). The boom and bust situation of the Galapagos sea cucumber followed by a prolonged period of a very low stock sizes, has also been described for many other sea cucumber species worldwide (Conand 2004, Uthicke 2004). This seems at least partly due to the fact that most species are fairly slow growing with low population productivity and great vulnerability to overfishing (Toral-Granda et al. 2008).
Isostichopus fuscus is gonochoric, but does not display sexual dimorphism. Fifty percent of individuals from Galapagos attain sexual maturity at 23.6cm, although individuals of 16cm with developing gonads have been recorded (Toral-Granda 1996). Reproductive activity occurs throughout the year and is thought not to be affected by temperature in the Galapagos Islands (Toral-Granda 1996); while in Mexico, increased reproductive activity was observed in the warm water season (Herrero-Perezrul et al. 1999). Larvae are planktotrophic (Toral-Granda 1996) and transparent, and display indirect development (Hamel et al. 2003). Under aboratory conditions, metamorphosis and settlement of 1mm juveniles can occur 28 days after fertilization (Hamel et al. 2003). Herrero-Perezrul et al. (1999) obtained preliminary population parameters of I. fuscus from Mexico, which included estimations of asymptotic length (L∞=36.118cm) and growth coefficient (K=0.180/yr). In a later study, Reyes-Bonilla & Herrero-Perézrul (2003) obtained a smaller infinite length and a higher k-value (L∞=29.108cm, K=0.243/yr). These growth parameters suggest a life span of this species between 12-17 years.
The starting fishery was centered in Western Isabela and Fernandina (Fig. 2), where population densities were highest. A pilot population study off Fernandina in 1993 yielded a mean density of 6.24ind./m2 (Aguilar et al. 1993), and later assessments recorded between 0.8-6.2ind./m2 in the Canal Bolivar area (Aguilar et al. 1993, Richmond & Martinez 1993). A stock depletion model run in this area (Hearn et al. 2005) yielded initial densities of adults (>16cm TL), between 0.27-0.40ind./m2 from 1994 to 1997, similar to those obtained in 1999 (Toral-Granda & Martinez 2004). Currently, densities have decreased by about an order of magnitude to 0.03ind./m2 (Murillo et al. 2008, this study).
A strong recruitment event of the I. fuscus population in Galapagos was registered in 2000 in the Canal Bolivar area (Murillo et al. 2002, Hearn et al. 2005), which ended in 2002.
The steadily decreasing catches of the sea cucumber fishery over the past decade (following the peak of 2002), are mainly the results of a chronic over fishing that has not allowed the stock recuperation (Hearn et al. 2005). The main reasons are an overcapacity of the fleet, a reactive instead of proactive management, and a ‘race for fish’ situation, the lack of control as well as difficult enforcement of the fishery regulations in this large archipelago with far away fishing zones, which also leads to illegal fishery. In addition to these problems, the determination of an annual quota by the managers of the marine reserve and the scientists involved, had not been derived from stock size estimates and scientific reasoning about an acceptable fraction of the annual stock to be harvested. Instead, the quota was negotiated by the co-management system in place (except for the boom year of 2002). Only in 2009 a limit reference point (LRP) of 11ind./100m2 was implemented and the fishery may only be opened once the stock density in the principal fishing area of Isabela as derived from the pre-fishery monitoring is above this reference value (Comision Tecnica Pesquera de la Junta de Manejo Participativo 2009). LRP reflects the lower end of a mean density range (11-20ind./100m2) observed during historical surveys and characteristic for a stock in recuperation. Below this density interval the stock is considered to be in a critical stage, above in a healthy stage (Castrejon et al. 2008). These measures caused two problems. The first was that fishermen preferentially monitored areas, where densities had traditionally been above average, not representing the overall mean density of all macrozones. The second problema was that once the fishery was opened, fishermen would take out all adult sea cucumbers (>20cm total length), that they could find within their economic constraints. In years, when quota was negotiated, there was a lack of an adequate stock monitoring design and the poor information available did not allow for a precise quota calculation. As a result the quota was usually too high with the result that the remaining post-fishery stock was extremely small, lacking the potential for biomass to rebuild up to the next year’s fishing season. Due to these problems associated with the management of the Galapagos sea cucumber fishery, we aimed to improve the monitoring and management strategy.
Our research goals were to: (1) optimize stock evaluation procedures by considering macrozone differences in density and stock distribution, and (2) to provide a scientific basis for the estimation of an annual quota. Specific research questions addressed were: a) are there spatial-temporal differences in sea cucumber densities within the fishing area, for the period 1999-2009, which would allow to classify key areas/macrozones of sea cucumber distribution in the archipelago? b) Is there an observable spatial-temporal trend in sea cucumber size distribution? (i.e. are there macrozones and years of higher numbers of recruits?) c) Are stock densities higher in deeper (>15m) than in shallow (<15m) waters as suggested by fishermen? d) Can we derive an estimate on stock productivity based on available literature, which allows for the calculation of a reasonable catch quota from annual estimates of stock size?
Material and methods
Estimation of fishing areas (macrozones): The design of the new monitoring plan was derived from information of past monitoring surveys carried out annually from 1999 to 2008. Two types of monitoring had been carried out, pre-fishing and post-fishing. Since the prefishing data were generally more complete and consistent (Vadas 2008), we decided to focus on those for the analysis. The monitoring effort of all years was aimed to cover the principal fishing areas as well as no-fishing areas. This resulted in very large areas and for several of them in wide confidence limits around the density estimates.
The first 19 macrozones for the islands of Fernandina, Isabela, Espanola, Floreana, San Cristobal and Santa Cruz were defined considering the principal sea cucumber fishing zones as derived from fisheries statistics of the PNG and CDF of the period 2001-2008. Due to insufficient financial resources and because fishermen insisted that four of the previously defined macrozones (east Santa Cruz, East and South-East Isabela and East Floreana) are not currently used as fishing zones, the macrozones surveyed in this study were reduced to 15.
Each macrozone was delimited using georeferenced catch data from the participative monitoring programme conducted during this period by the following procedure: bathymetric data compiled by Chadwick (1994) for the depth range from 0-1 500m depth, as well as from the CDF Geographical Information System (coastline CDF/Clirsen-TNG/GNPS) data from 0-39m were subjected to an ArcGIS Triangulated Irregular Network (TIN) interpolation routine, which creates circumcircles around each selected sample point and their intersections are connected to a network of non overlapping triangles, being as compacted as possible. Based on this interpolation a -30m isobath, which is the maximum depth where fishing can be carried out, was created. With the isobath line as the outer and the coastline as the inner boundary, the area of each polygon (m2) was mapped. A histogram was created to describe the frequencies of points per depth strata and an analysis was done to describe mean distances between points by using nearest neighbor statistics (ArcGIS and Surfer). Only 50% of the estimated area was considered as suitable sea cucumber fishing area and habitat, given that approximately 20% has unsuitable sandy bottoms and another 30% is too shallow (<5m intertidal waters), or uninhabitable steep slopes (Banks et al. 2006).
Determination of transect number per macrozone: In order to estimate the required number of transects per macrozone, we proceeded as follows: first, means and standard deviations of stock densities obtained during past surveys were calculated for each zone. Then, 95% confidence intervals around the mean stock densities were estimated for each zone and 95% confidence intervals around the mean stock densities were calculated; second, the homogeneity/degree of patchiness of sea cucumber distribution per macrozone as reflected by those statistics was then used to calculate the minimum number of replicates necessary per macrozone to achieve a precisión of ±25% applying the following formula:
with n=minimum number of replicates required to achieve a precision of ±25% around our estímate of mean density; t=value of the t distribution (student’s t-test) for p<0.05; Av=annual average of the sea cucumber density per macrozone and SD = standard deviation.
Using the above formula, differences in spatial distribution and stock density per macrozone resulted in different numbers of replicates required for the different areas, with more replicates for areas of higher patchiness, and lower numbers where the population appears more evenly distributed. Based on this procedure population size estimates are considered substantially more precise than if the replicate number was just proportional to the size of the area.
Sampling: The type of sample unit used was a circular transect with a radius of 5.6m which covers an area of 100m2. This has been used in monitoring activities before and has proven to allow for the collection of available sea cucumbers with low error (Hearn et al. 2005). Moreover, using this sample unit unbiased comparisons with previous surveys became possible. The exact location of each transects in each macrozone was decided jointly between fishermen and scientists with the aim to adequately cover each area. The sampling sites were distributed in two depth strata: shallow (<15m) and deep (>15m), with the shallowest and deepest waters around five and 25m respectively.
The stock size per macrozone was estimated extrapolating the mean density value (ind./m2) to the corresponding total area. Then, the stock sizes of each macrozone were added up to estimate the stock for the whole fishing area.
The mean density value within the West Isabela macrozone was then compared with the sea cucumber reference points defined in the Fishery Chapter of the Management Plan for the Galapagos Marine Reserve (GMR) (Castrejon et al. 2008, Comision Tecnica Pesquera de la Junta de Manejo Participativo 2009). According to these reference points a healthy, abundant stock should have a West Isabela macrozone density >21ind./100m2, while densities of a stock in recuperation should range from 11-20.9 ind./100m2. If densities are <11ind./100m2, the stock is closed for fishing.
Precision of density estimates and density comparisons between depth strata: Since the density values of each macrozone proved to be not normally distributed, a bootstrap resampling routine (Efron 1981) was applied, which consisted in a random resampling (1 000x) of the data matrix for each macrozone. This yielded 1 000 normally distributed mean density values and allowed for the computation of the standard deviation and coefficient of variation (CV%) around the mean of these values.
In order to test for depth strata differences in sea cucumber densities, all density measurements taken in each depth stratum (shallow and deep), were considered for the calculation of overall means per depth strata. The resulting mean densities were bootstrapped for each depth stratum and compared using a t-test of means. For comparative purposes also a non-parametric Mann-Whitney U test for the medians was applied. We repeated this analysis by combining the information of sea cucumber density per depth strata for all those years where sufficient samples had been taken (1999-2002 and 2006-2009).
Calculating the catch quota. Annual stock production can be calculated by multiplying mean stock size by the rate of total production (P/B=Z) which is the sum of natural (M) and fisheries (F) mortalities. P/B tends to increase with fishing pressure while the stock biomass decreases. Gulland (1971) and Garcia & Le Reste (1981) proposed to approximate the maximum sustainable yield (MSY) of a stock from an estimate of its virgin biomass (B∞) and the rate of natural mortality (M). They propose: MSY = X* M*B∞ (With X=0.5 in the formula of Gulland and in the range of 0.32-0.44 in the formula of Garcia and Le Reste respectively). If a resource is heavily exploited and virgin stock levels can not be determined this formula should not be applied. Cadima (in Troadec 1977) proposed to use the following formula instead:
This formula is identical to MSY=M*B, if F=M at an exploitation rate of E=0.5.
Garcia et al. (1989) pointed out that Cadima’s formula only gives unbiased estimates of MSY if the stock is virgin and Z=M (when it is identical to Gullands formula mentioned above) or when the stock happens to be exploited at the level of MSY already (at B∞/2 and an exploitation rate of 0.5).
Considering this reasoning of the above authors and assuming that the current stock level of the Galapagos Sea Cucumber is far below B∞/2 it was decided to use a lower (precautionary) exploitation rate of E=0.3 when applying the Cadima formula. The M- value (0.17/year) of Hearn et al. (2005) was used, which was derived from a stock depletion model. This value was based on a rich data source and appears as a sound estimate in the right order of magnitude, when compared to other slow growing marine invertebrates reported in the literature (Brey 2001). A value double as high for this species in Mexico (M= 0.354/year) was proposed by Reyes-Bonilla & Herrero-Perézrul (2003), who, however used empirical formulas for its derivation, which were not established for holothurians.
Considering this M value of 0.17 the F value was calculated corresponding to an exploitation rate of E=0.3 by calculating:
By inserting the F and M values in the Cadima formula (above), we arrived at:
The annual quota here proposed is thus 12.2% of the standing stock.
Results
Estimates of macrozone areas and number of transects per macrozone: Figure 2 shows the distribution of sea cucumber fishing activities in the archipelago for the years 2001 and 2008 and the 15 macrozones using these data. Table 1 gives their extension and the numbers of replicates per macrozone required for a mean stock density estimates <±25% precision. It also provides the density estimates and quota per macrozone derived from the monitoring survey of 2009. The overall estimate of fishable area of all macrozones combined is 124.8km2.
The population monitoring was carried out in the last two weeks of May 2009 by fishermen, National Park and CDF staff coordinated and financed mainly by the National Park. San Cristobal is the island with the largest fishing area (52km2), followed by Isabela (33km2) and Santa Cruz (20.4km2). Floreana, Espanola and Fernandina combined only represent 20km2. While the coastline of Isabela where fishing takes place is much larger than the one of San Cristobal, the fishing area is smaller due to the very steep slope bringing the -30m isobath much closer to the coastline in Isabela than in San Cristobal. It is interesting to see that replicate numbers vary greatly between zones with Espanola requiring the highest number per area (49/5km2), while Santa Cruz requires only 31 transects in 20.5km2.
Densities and catch quota for the season 2009: Mean density for West-Isabela (3.72ind./100m2) is far below the critical value for the opening of the fishery (11ind./100m2) and was de lowest ever recorded in the last decade (Fig. 3). So, following the decision rule in place, it was recommended not to open the fishery for the year (2009). This recommendation was thereafter accepted by the co-management body (Interinstitutional Management Authority, IMA). The densities of all macrozones with the coefficient of variation around the mean (CV, %) are given in Table 1. If our rationale for a quota (TAC) estimate based on the stock size (4.9 million individuals) derived from the overall mean density (0.039ind./m2) and our combined area estimate (124.8km2) had been followed, the TAC would have been 59 889 individuals for the 2009 fishing season for the whole archipelago.
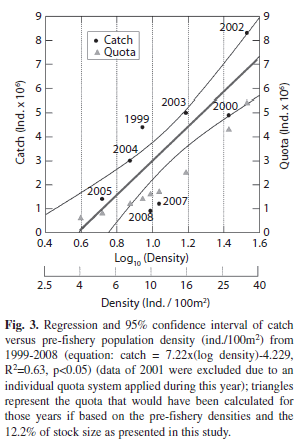
Figure 4 shows the mean densities (left) and the proportion of small (<20cm) sea cucumbers in the samples (right). Floreana, Isabela and Fernandina show a steady density decrease over the past years, while Santa Cruz has remained quite constant over the past six years. The density value of San Cristobal in 2009 was surprisingly the second highest since 1999.
The proportion of juveniles (recruits) in the stock has steadily decreased for the Western islands Isabela and Fernandina and is the lowest ever recorded in Espanola and Floreana. Santa Cruz and Cristobal revealed a slight increase over the last three years.
The 2009 monitoring data for the two depth strata showed higher densities in the shallow stratum compared to the deep stratum (4.5 compared to 3.2ind./100m2 respectively). Statistically, this difference was significant if the non-parametric Mann-Whitney U test of the median density values was used or if the mean values using the bootstrapping routine were compared (t-test, p<0.05). The density difference between depth strata was even more pronounced, when the data of eight years was combined (8.7 versus 17.9ind./100m2 for deep and shallow strata respectively).
Discussion
This study is the first in trying to estímate the fishing area of the sea cucumber stock of Galapagos, which seemed imperative if overall stock size was to be approximated for quota calculations. Since the topography and slope of the sea bottom varies substantially between macrozones, and available bathymetric data points were not covering all areas uniformly, the mapping of the polygons between the coastline and 30m isobath using ArcGIS required an interpolation procedure. The TIN interpolation used to define the -30m isobath for our 15 macrozones was supported by 8 615 geographical data points over the depth range from 0-1 500m, of which a large proportion (3 228 points, 37.5%) were situated within the macrozone depth limits. Based on a nearest neighbor analysis, a separation value for the mean distance between points was found equal to 0.0031589 with a standard deviation of 0.0054607 (degrees).
While we believe that our first fishing area estimate is a good approximation, it can definitely be improved through a more detailed bathymetric survey of the coastlines of the Galapagos Archipelago.
The assumption was then made that of the estimated area 20% is unsuitable Sandy bottom habitat and 30% too shallow (<5m) intertidal water or comprised by too deep waters (>25m) or inhabitable steep slopes. These assumptions are derived from a decade of sub-tidal macrofauna monitoring, as well as specific pre-and post-fishery monitoring reflecting a sufficient amount of data and the best estimate available for this study. It should be stated here, that the Ecuadorian Oceanographic Institute (INOCAR) has already started to conduct a mapping of the whole Galapagos coastal sub tidal areas using side scan sonar technology. We expect to soon be able to update our here presented estimates based on this information.
Only 383 out of 547 planned transects (70%) could be carried out during the 2009 pre-fishery monitoring due to financial constraints. However, this transect number is the highest ever used in the Galapagos sea cucumber pre-fishery monitoring (the second highest was 303 transects taken in the year 2008). The precision around the mean densities differs between macrozones with a coefficient of variation (CV) ranging from 12.2% for Eastern Espanola (n=27/a=2.1km2) to 81.2% for Southern Fernandina (n=4/a=8.5km2). These differences can be attributed to the number of transects and the degree of patchiness of the sea cucumbers in each zone. When the transect data are integrated for each island, the respective density estimate is greatly improved with CVs always <25%. The two islands that had the highest transect numbers (Isabela with 125 and San Cristobal with 97) had the lowest CV around the mean density estimate (11.6% and 13.3% respectively). The density estímate for all transects combined (3.94ind./100m2,CV=6.8%) can be considered of a very good precision. The great differences in densities and stock aggregation found between areas have been emphasized as being symptomatic for sea cucumber populations in general. Hand & Rogers (1999) summarized this problem by pointing to the variable spatio-temporal distribution of sea cucumbers, which make random surveys and conventional statistical approaches inappropriate. They also argue for the collection of ancillary information, such as substrate type to increase the precision of density estimates and for the use of geostatistical analysis and GIS to map the sea bed for benthic invertebrates. In our study, we followed the reasoning of these authors and our statistical analysis suggests that our macrozone and overall density estimates are good in general. However, some directed sampling has possibly occurred since fishermen often argued for sampling in those areas, where they had found sea cucumbers in previous years, sometimes not permitting full random sampling in each macrozone.
Of all macrozones sampled, none reached the minimum density of 11ind./100m2 to open the fishery, which points to a very critical state of the stock in all macrozones. Several factors may explain this situation. During years 1999-2002 the seasonal fishery was opened without quota limits, and the stock was depleted to extreme low densities, not keeping a large enough residual biomass for the next season. In years, when catch quota were determined through the co-management process, these were often too high, representing too large a part of the available stock. This may be illustrated by the example of the year 2004, when a mean density of 7ind./100m2 was counted during the pre-fisheries monitoring and a catch quota of three million individuals as agreed upon, 2.5 times the number which would have been estimated considering the reasoning of this study (12.2% of 8.73 million individuals, which are only 1.06 million). The general problem was that the quota was set with no available estimate of absolute stock size.
The density and recruit fraction trend over the past decade, suggests a further reason for the critical state of the stock: a lack of substantial recruitment during the past decade of predominant cold waters. Since the strong El Nino 1997/98, which seemed to have improved recruitment of sea cucumbers to the fishery during the years 2000-2003, sea surface temperatures (SST) around the Galapagos archipelago have remained quite low for most of the time representing an extended La Nina cold regime (Wolff 2010; see also SST data base of CDF on www.cdf.org.ec). So it may well be that in addition to the problem of a too small spawning stock remaining after each fishing season, spawning activity as well as larval and pre-recruit survival, may have been comparatively low during these years. Unfortunately, as yet little is known about the environmental window for optimal reproduction and early life stages development of this species. The strongest reduction in recruit proportions within the monitoring surveys over the past years was found in the Western islands Isabela and Fernandina, which were strongly exposed to cold upwelling waters during the past years of La Nina regime. The El Nino 1997/98 warming, on the other hand, seem to have caused strong recruitment in these areas, leading to enormous stock densities during the post-El Nino years 2000-2003. This positive El Nino warming effect on the recruitment of I. fuscus was first published by Herrero-Perézrul et al. (1999). Santa Cruz is the only island, where the fraction of small specimens <20cm seem to have increased over the past years 2008 and 2009. However, since mean density has not increased in parallel, this relative increase in small specimens is rather a sign of heavy depletion of larger adults than of a successful recruitment. In Espanola a density increase during the year 2007 was paralleled by an increased fraction of small specimens, which may suggest a small recruitment here.
In this report, an empirical relationship between the pre-fishery (log) density obtained through the annual monitoring surveys and the catches obtained later in the same year has been assembled. While there is a great scatter around the regression line, possibly partly due to differences in monitoring precision between years (see discussion above), the figure shown suggests a significant relationship between both variables. The quota estimate for all these years was included when the fishery was opened and it is evident that catches taken were in most cases far higher (2-3 times) than the quota that would have been recommended using the reasoning of this study. This, however, is not the case for the years 2007 and 2008, when less sea cucumber were fished, than the quota would have allowed. We think that this discrepancy is due to great overestimates of mean pre-fishery stock densities in these years (through which too high quota were negotiated).
The often heard statement by the fishing sector that sea cucumber densities are higher in deeper waters giving the stock a strength in reserve if fishing pressure in shallower waters is high, could clearly be shown to be wrong for the year 2009, and also for the combined data of the eight year’s period. This is an important finding of our study since it removes the basis for the argument that a large portion of the stock is out there in deeper waters where it can not be caught.
We believe that the monitoring and management strategy of the Galapagos sea cucumber stock that has been presented in this paper is an important step towards a sustainable fishery of this species. It is the first time that the attempt was made to estimate the size of the whole fishing area and of the fishable stock. Moreover, the monitoring was adapted to specific conditions (size and sea cucumber patchiness) of each macrozone, and the quota was made a fraction of the stock size (12.2%), which makes it adaptive to natural inter-annual stock fluctuations.
As a future step it may be considered to look for spatially-explicit tools for management of the Galapagos sea cucumber such as the implementation of territorial use rights (Defeo & Castilla 2005) or rotational closures of different areas from year to year. The first seems difficult in Galapagos because there are more fishermen with licenses than active fishermen and stock productivity is not evenly distributed over the different macrozones and also seems to vary spatially and temporally, which makes difficult a possible distribution of sub-areas to fishermen groups. The latter, however, seems a viable approach and our study provides a good basis through the classification and delimitation of macrozones and the estimation of their relative contribution to the overall stock. Closing macrozones completely for the fishery over a longer period of several years, would allow for a substantial stock rebuilding, and fertilization success should increase in these higher density areas and population wide recruitment may result. While this paper is being written, the National Park of Galapagos and the Charles Darwin Foundation are preparing for a pilot project for stock enhancement of the Galapagos sea cucumber through the collection of wild larvae in areas closed to the fishery. If successful, this project would allow for an acceleration of the stock rebuilding process.
Acknowledgments
We want to thank all participants of the monitoring survey of 2009: H. Reyes, J. Paredes, G. Vasquez, M. Villalta, L. Garcia, W. Fuertes, O. Ricaurte, J. Garcia, Y. Llerena, Y. Mascarell, M. Ortega, J.L. Ballesteros, J. Pilamunga, P. Espinoza, W. Bran, J. Araujo, L. Lozano, F. Lucas, F. Parrales, Y. Araujo, A. Yamuca, F. Velez, J. Camacho, C. Lozano, I. Maffare, P. Tipan, L. Bonilla, G. Gil, J. Moreno, J. Delgado, S. Clarke, J.P. Tiernan, J.C. Murillo, S. Cruz, the National Park of Galapagos and the WWF. This publication is contribution number 2048 of the Charles Darwin Foundation for the Galapagos Islands.
References
Aguilar, F., X. Chalen, F. Castro, J. Sonnenholzner & M. Herrera. 1993. Evaluacion del recurso pepino de mar (Holothuroidea) al este de la Isla Fernandina en la Provincia de Galapagos, Guayaquil. Instituto Nacional de Pesca. [ Links ]
Aguilar-Ibarra, A. & G. Ramirez-Soberon. 2002. Economic reasons, ecological actions and social consequences in the Mexican sea cucumber fishery. SPC Beche-de- Mer Information Bulletin 17:33-36. [ Links ]
Banks, S., M.Vera, M. Toscano, D. Ruiz & N. Tirado. 2006. Monitoreo ecologico de la zona costera para la evaluacion de la zonificacion provisional consensuada (ZPC). Resumen de actividades octubre 2004 – septiembre 2006. Informe de avances para USAID. Fundacion Charles Darwin, Santa Cruz, Galapagos, Ecuador. [ Links ]
Brey, T. 2001. Population dynamics in benthic invertebrates. A virtual handbook. Version 01.2. (http://www.thomas-brey.de/science/virtualhandbook). [ Links ]
Castrejon, M. 2011. Co-manejo pesquero en la Reserva Marina de Galapagos: tendencias, retos y perspectivas de cambio. Fundacion Charles Darwin, Puerto Ayora, Santa Cruz, Galapagos, Ecuador. [ Links ]
Castrejon, M., A. Hearn, J.C. Murillo, A. Lalancette, H. Reyes, N. Gaibor, X. Chalen, E. Espinoza & U. Avendano. 2008. Puntos de referencia objetivo para la pesqueria de pepino de mar (Isostichopus fuscus) en la Reserva Marina de Galapagos. Reporte de la Comision Tecnica de la JMP, Puerto Ayora, Santa Cruz, Galapagos, Ecuador. [ Links ]
Chadwick, B. 1994. Bathymetric Data of Galapagos Downloaded: July 29, 2011, http://www.pmel.noaa.gov/vents/staff/chadwick/galapagos.html to download the file click the following link “galapall.xyz.Z” [ Links ].
Conand, C. 2004. Present status of world sea cucumber resources and utilisation: an international overview, p. 13-23. In A. Lovatelli, C. Conand, S. Purcell, S. Uthicke, J.F. Hamel & A. Mercier (eds.). Advances in sea cucumber aquaculture and management. FAO Fisheries Technical Paper No. 463. [ Links ]
Defeo, O. & J.C. Castilla. 2005. More than one bag for the world fishery crisis and keys for co-management successes in selected artisanal Latin American shellfisheries. Rev. Fish. Biol. Fish. 15: 265-283. [ Links ]
De Paco, C., M. Hurtado, C. McFarland, P. Martinez, G. Reck & R. Richmond. 1993. Evaluacion de la pesqueria de pepinos de mar en las islas Galapagos, Ecuador. Informe para la Union Mundial de la Naturaleza (UICN) como resultado de la Mision realizada a solicitud de la Fundacion Charles Darwin para las Islas Galapagos, Fundacion Charles Darwin, Quito, Ecuador. [ Links ]
Efron, B. 1981. Nonparametric estimates of standard error: the jackknife, the bootstrap and other methods. Biometrika 68: 589-599. [ Links ]
Garcia, S. & L. Le Reste. 1981. Life cycles, dynamics, exploitation and management of coastal peneid shrimp stocks. FAO Fish.Tech. Pap. 203. [ Links ]
Garcia, S., P. Sparre & J. Csirke. 1989. Estimating surplus production and maximum sustainable yield from biomass data when catch and effort time series are not available. Fish. Res. Fish. Res. 8: 13-23. [ Links ]
Gulland, J.A. 1971. The fish resources of the ocean. Fishing News Books, West Byfleet, United Kingdom. [ Links ]
Hamel, J.F., R. Ycaza-Hidalgo & A. Mercier. 2003. Larval development and juvenile growth of the Galapagos Sea cucumber Isostichopus fuscus. SPC Beche-de-Mer Information Bulletin 18: 3-8. [ Links ]
Hand, C.M. & J. Rogers. 1999. Sea Cumber Phase 1 Fishery Progress Report. Canadian Stock Assessment Secretariat Research Document 99/141, Canada. [ Links ]
Hearn, A., P Martinez, M.V. Toral-Granda, J.C. Murillo & J. Polovina. 2005. Population Dynamics of the exploited sea cucumber Isostichopus fuscus in the Western Galapagos Islands, Ecuador. Fish. Oceanogr. 14: 1-9. [ Links ]
Herrero-Perezrul, M.D., H. Reyes-Bonilla, F. Garcia- Dominguez & C.E. Cintra-Buenrostro. 1999. Reproduction and growth of Isostichopus focus (Echinodermata: Holothuridae) in the southern Gulf of California, Mexico. Mar. Biol. 135: 521-532. [ Links ]
Maluf, L.Y. 1991. Composition and distribution of the central eastern Pacific echinoderms. Tec. Rep. Nat. Hist. Mus. Los Ang. County 2: 1-242. [ Links ]
Martinez, P.C. 2001. The Galapagos sea cucumber fishery: a risk or an opportunity for conservation? SPC Beche-de-Mar Inf. Bull. 14: 22-23. [ Links ]
Murillo, J.C., P. Martinez, M.V. Toral-Granda & A. Hearn. 2002. Pepino de Mar, p. 176-198. In E. Danulat & G.J. Edgar (eds.). Reserva Marina de Galapagos, Linea base de Biodiversidad. Fundacion Charles Darwin y Servicio Parque Nacional de Galapagos, Santa Cruz, Ecuador. [ Links ]
Murillo, J.C., H. Reyes & M. Wolff. 2008. Tecnico de las Pesquerias de Pepino de mar (Isostichopus fuscus) y Langosta espinosa (Panuliris penicilatus y P. gracilis) en la Reserva Marina de Galapagos, Parque Nacional Galapagos, Ecuador. [ Links ]
Powell, J.R. & J.P. Gibbs. 1995. A report from Galapagos. TREE 10: 351-354. [ Links ]
Reyes-Bonilla, H. & M.D. Herrero-Perézrul. 2003. Population parameters of an exploited population of Isostichopus fuscus (Holothuroidea) in the southern Gulf of California, Mexico. Fish. Res. 59: 423-430. [ Links ]
Richmond, R.H. & P.C. Martinez. 1993. Sea cucumber fisheries in the Galapagos Islands. Biological aspects, impacts and concerns. World Conservation Union (IUCN), Technical Report. [ Links ]
Comision Tecnica Pesquera de la Junta de Manejo Participativo, 2009. Capitulo Pesca del Plan de Manejo de la Reserva Marina de Galapagos. Galapagos, Ecuador. [ Links ]
Toral-Granda, M.V. 1996. Biologia reproductiva del pepino de mar Isostichopus fuscus en la isla Caamano, Santa Cruz, Galapagos. Tesis de Licenciatura, Universidad del Azuay, Cuenca, Ecuador. [ Links ]
Toral-Granda, M.V. & P.C. Martinez. 2004. Population density and fisheries impacts on the sea cucumber (Isostichopus fuscus) in the Galapagos Marine Reserve, p. 91-100. In A. Lovatelli, C. Conand, S. Purcell, S. Uthicke, J.F. Hamel & A. Mercier (eds.). Advances in sea cucumber aquaculture and management. FAO Fisheries technical Paper, No. 463. Rome, FAO. [ Links ]
Toral-Granda, M.V. 2008. Galapagos Islands: a hotspot of sea cucumber fisheries in Central and South America, p. 231-253. In V. Toral-Granda, A. Lovatelli & M. Vasconcellos (eds.). Sea cucumbers. A global review of fisheries and trade. FAO Fisheries and Aquaculture Technical Paper, No. 516. Rome, FAO, Italy. [ Links ]
Toral-Granda, V., A. Lovatelli & M. Vasconcellos. 2008. Sea cucumbers. A global review of fisheries and trade. FAO Fisheries and Aquaculture Technical Paper. No. 516. Rome, FAO. [ Links ]
Troadec, J.P. 1977. Methodes semi-quantitatives d’evaluation.FAO Circ. Peches 701: 131-141. [ Links ]
Uthicke, S. 2004. Overfishing of holothurians: lessons from the Great Barrier Reef, p. 163-171. In A. Lovatelli, C. Conand, S. Purcell, S. Uthicke, J.F. Hamel & A. Mercier (eds.). Advances in sea cucumber Aquaculture and Management, FAO Fish. Tech. Paper, No. 463, FAO, Rome, Italy. [ Links ]
Vadas, F. 2008. Sea cucumber (I. fuscus) stock dynamics around the Galapagos Islands, 1999-2005. Charles Darwin Foundation, Internal Report Galapagos, Ecuador. [ Links ]
Wolff, M. 2010. Galapagos does not show recent warming but increased seasonality. Galapagos Research 67:38-44. [ Links ]
*Correspondencia a: Matthias Wolff: Charles Darwin Foundation (CDF), Santa Cruz, Galapagos, Ecuador; anna.schuhbauer@fcdarwin.org.ec, acschuhbauer@gmail.co Leibniz Center for Tropical Marine Ecology, Fahrenheitstr. 6, 28359 Bremen, Deutschland; matthias.wolff@zmt-bremen.de
Anna Schuhbauer: Charles Darwin Foundation (CDF), Santa Cruz, Galapagos, Ecuador; anna.schuhbauer@fcdarwin.org.ec, acschuhbauer@gmail.co
Mauricio Castrejon: World Wildlife Fund (WWF), Santa Cruz, Galapagos, Ecuador; maucm@hotmail.com
1. Charles Darwin Foundation (CDF), Santa Cruz, Galapagos, Ecuador; anna.schuhbauer@fcdarwin.org.ec, acschuhbauer@gmail.com
2. Leibniz Center for Tropical Marine Ecology, Fahrenheitstr. 6, 28359 Bremen, Deutschland; matthias.wolff@zmt-bremen.de
3. World Wildlife Fund (WWF), Santa Cruz, Galapagos, Ecuador; maucm@hotmail.com
Received 09-V-2011. Corrected 05-IX-2011. Accepted 07-X-2011.


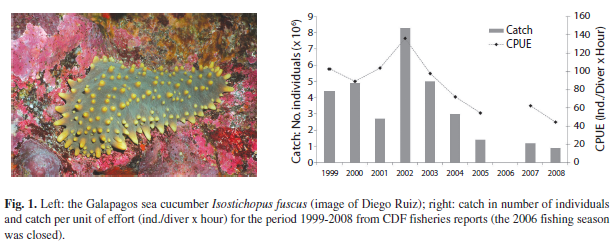
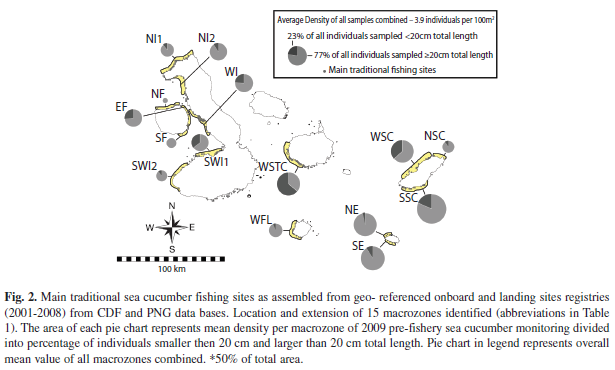
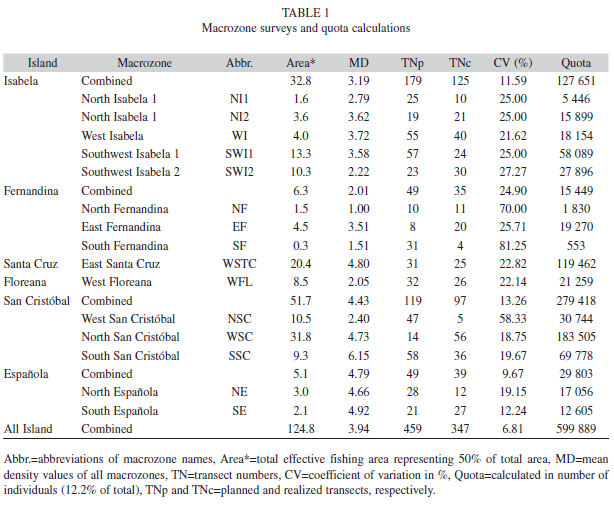
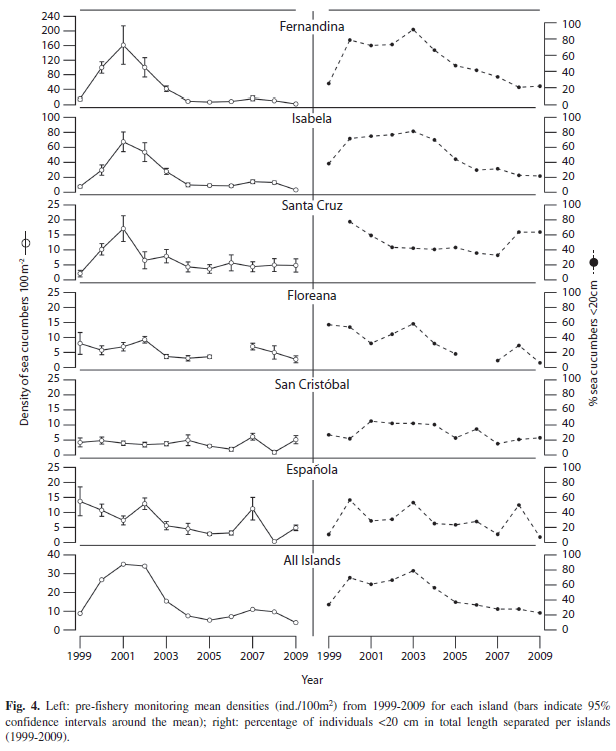