


Services on Demand
Journal
Article
 English (pdf)
 Article in xml format
 Article references
 Send this article by e-mail
Indicators
-
 Cited by SciELO
 -
 Access statistics
Related links
-
 Similars in
SciELO
Similars in
SciELO  uBio
uBio
Share

 Permalink
Revista de Biología Tropical
On-line version ISSN 0034-7744Print version ISSN 0034-7744
Rev. biol. trop vol.60 n.1 San José Mar. 2012
Genetic diversity and structure of wild populations of the tropical dry forest tree Jacaratia Mexicana (Brassicales: Caricaceae) at a local scale in Mexico
Dulce M. Arias1*, Ana L. Albarrán-Lara2*, Antonio González-Rodríguez2, Juan Peñaloza-Ramírez2, Oscar Dorado1 & Esaú Leyva1
*Dirección para correspondencia
Abstract
The tropical dry forest is a greatly endangered ecosystem, from which Jacaratia mexicana is a native tree. With the aim to assess the levels of genetic variation and population structure, four wild populations of J. mexicana were studied in the Sierra de Huautla Biosphere Reserve, Morelos, Mexico. For this, DNA was extracted from 159 individuals and were amplified with six random primers using the Random Amplified Polymorphic DNA (RAPD). A total of 54 bands were obtained, of which 50 (92.6%) were polymorphic. The total genetic diversity found within the four populations was 0.451 when estimated by Shannon’s index. An AMOVA analysis showed that 84% of the total genetic variation was found within populations and 16% was among populations. The UPGMA dendrogram showed that all individuals from one of the populations (Huaxtla) formed one distinct genetic group, while the rest of the individuals did not cluster according to population. A Mantel test did not show an association between genetic and geographical distances among populations (r=0.893, p=0.20). A Bayesian cluster analysis performed with STRUCTURE, showed that the most probable number of genetic groups in the data was four (K=4), and confirmed the distinctness of Huaxtla population. Our results showed that important genetic differentiation among populations can occur even at this small geographic scale and this has to be considered in conservation actions for this genetic resource.
Key words: Jacaratia mexicana, Caricaceae, genetic diversity, population structure, Bayesian methods, RAPDs.
Resumen
Jacaratia mexicana es un árbol nativo del bosque tropical seco, que es considerado el tipo de vegetación en mayor riesgo de desaparecer completamente. Se utilizaron polimorfismos de ADN amplificados al azar (RAPD, Random Amplified Polymorphic DNA), para evaluar los niveles de variación y estructura genética en cuatro poblaciones silvestres de J. mexicana en la Reserva de la Biósfera Sierra de Huautla (Morelos, México). Se amplificó el ADN de 159 individuos utilizando seis oligonucleótidos (“primers”) aleatorios. Se obtuvieron en total 54 bandas, de las cuales 50 (92.6%) fueron polimórficas. La diversidad genética total que se encontró en las cuatro poblaciones de J. mexicana fue de 0.451 de acuerdo con el índice de Shannon. Un análisis de varianza molecular (AMOVA) mostró que el 84% de la variación genética total se encuentra dentro de las poblaciones y el 16% entre las poblaciones. Un dendrograma construido mediante el algoritmo UPGMA mostró que los individuos de una población (Huaxtla) formaron un grupo, mientras que el resto de los individuos no se agruparon de acuerdo a su población de origen. Una prueba de Mantel no mostró una asociación entre las distancias genéticas y geográficas entre las poblaciones (r=0.893, p=0.20). Un análisis de agrupamiento Bayesiano realizado mediante STRUCTURE mostró que el número más probable de grupos genéticos es cuatro (K=4) y confirmó la diferenciación de la población Huaxtla. Nuestros resultados muestran que una considerable diferenciación genética entre poblaciones puede existir incluso a esta escala geográfica, lo cual es de interés para la conservación de este recurso genético.
Palabras clave: Jacaratia mexicana, Caricaceae, diversidad genética, estructura poblacional, métodos Bayesianos, RAPDs, Reserva de la Biósfera Sierra de Huautla.
Information on the levels and geographic distribution of population genetic variation within species is fundamental to define efficient conservation strategies (Palacios & González-Candelas 1997, Fergunson et al. 1998, Maki & Horie 1999). Genetic variability confers a species the ability to respond to possible environmental changes, providing a higher capacity to evolve and survive in the long-term (Ayala & Kinger 1980, Dobzhansky et al. 1993, Griffiths et al. 2000). The genetic variation and the change in allele frequencies from one population to another constitute the genetic structure of populations (Wright 1978). This genetic structure is affected not only by evolutionary events (e.g. recombination, mutation, gene flow, genetic drift, inbreeding and natural selection) but also by various ecological factors, such as effective population size, reproductive system, fertility, life history traits, pollination syndromes, and seed dispersal rate in the case of plants (Hamrick et al. 1979, Hamrick & Godt 1989). All these ecological and evolutionary factors are needed to understand the structure of genetic variation over time and space (Hamrick et al. 1979, Hamrick & Godt 1989, Schierenbeck et al. 1997).
Jacaratia mexicana A D.C. (Caricaceae), commonly named “bonete” is a long-lived native tree of tropical dry forests in Mexico, considered the type of vegetation in greater danger of disappearing totally (Janzen 1988) mainly due to land use change (Sala et al. 2000). J. mexicana has a neotropical distribution that extends in Mexico through the Southern region of the Sierra Madre Occidental, the Trans-Mexican Volcanic Belt, and the Sierra Madre del Sur (Rzedowski & Equihua 1987). It is also found in Nicaragua and El Salvador in Central America (Cronquist 1981). It is a dioecious species (Moreno 1980, Bullock 2002), with biotic pollination that depends on visual and scent mimicry (Bawa 1980). Female flowers lack reward for pollinators but their scent is similar to the male flowers, which produce a little nectar with a high content of amino acids. Nocturnal moths (Sphingidae) have been observed visiting both male and female flowers (Bullock 2002). A recent study on the morphological variation of the flowers of J. mexicana showed that female plants produce only pistillate flowers, while male plants are sexually variable and can bear three different types of flowers: staminate, pistillate and perfect (Aguirre et al. 2009). This pattern of sexual variation raises interesting evolutionary, ecological and genetic questions about the evolution of sexual expression in this species and in the Caricaceae family (Aguirre et al. 2009). The fruits of J. mexicana are fleshy, and mature during the dry season, and the seeds are dispersed by birds, bats and coatis (Valenzuela & Ceballos 2000, Bullock 2002). The uses of J. mexicana date from the pre-Hispanic time (Briones 2002). Fruit and seeds are used for food (Guizar & Sánchez 1991). Moreover, antiparasitic properties are attributed to this plant (Niembro 1986), and a proteolytic enzyme called “mexicain”, analogous to papain, is also present in the flesh of the fruits (Moreno 1980). For all these reasons J. mexicana is cultivated sometimes in dry tropical zones (Rzedoswki & Equihua 1987), and several important questions regarding possible processes of domestication have been recently pointed out.
A recent phylogeographic study of wild and cultivated accessions of J. mexicana in Mexico, using chloroplast and nuclear sequences, revealed that haplotype and nucleotide diversity are significantly higher in wild populations than in cultivated ones. The reduction in genetic diversity suggests that artificial selection (mainly on fruit traits) and possible population bottlenecks during the domestication process resulted in a progressive loss of genetic diversity (Arias et al. 2010). However, there is no information regarding the diversity and genetic structure of J. mexicana natural populations, despite its importance as a model system of plant evolution, and its economic value as food and as a potential source of pharmaceutical products. This knowledge would be very useful to understand processes involved in the evolution and ecology of populations of the species, and could contribute to optimize the use of this genetic resource. In this study, we analyzed the level and distribution of genetic variation within and between four populations of J. mexicana at a local scale in the Sierra de Huautla Biosphere Reserve, Morelos, Mexico.
Material and Methods
Study site: The Sierra de Huautla Biosphere Reserve (REBIOSH) is located in the central region of Mexico, Southern Morelos State. The reserve belongs to the province of the Balsas River Basin, in which the predominant vegetation is tropical dry forest and grassland (Rzedowski 1978, Morrone 2005). The tropical dry forests of Mexico have a large number of endemic plant taxa, especially at the species level, which are concentrated in the Balsas Basin, the Yucatan Peninsula and Northwestern Mexico (Rzedowski 1991). Throughout the country, many rural human populations are situated in this type of vegetation (Arias et al. 2002). The inhabitants of these communities use a great variety of species for medicinal, edible, ornamental and religious purposes (Maldonado 1997). The REBIOSH faces problems of deforestation, mainly due to land use change. The economy of rural populations living in the reserve was based on mining until 1991, when this activity was abandoned, which resulted in the opening of new areas for agriculture and generated habitat fragmentation (Dorado et al. 2005).
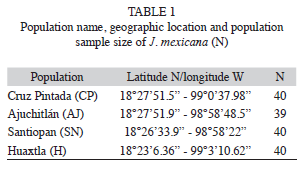
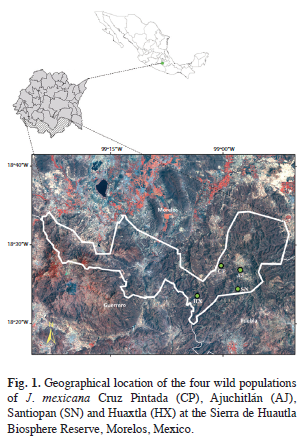
Sample collections and DNA extraction: A total of 159 individuals from four natural populations of J. mexicana were sampled in the Sierra de Huautla Biosphere Reserve during the rainy season in July-August 2003. The four populations were Cruz Pintada (CP), Ajuchitlán (AJ), Santiopan (SN) and Huaxtla (HX) and their geographical location and sample size are provided in table 1 and figure 1. From each individual, five young leaves were collected (from mature trees) and were placed in sealed plastic bags and stored at -80°C in the laboratory for further DNA extraction.
Genomic DNA was extracted from approximately 100mg of leaf tissue using a modification of the cetyltrimethylammonium bromide (CTAB) with an additional phenol-chloroformisoamylalcohol (25:24:1) cleaning step (Lefort & Douglas 1999). Once genomic DNA was obtained, it was quantified with a spectrophotometer (GENEQUANT pro.), and the DNA from each individual was diluted and standardized to a final concentration of 25ng/μL.
Primer selection and RAPD analysis: Polymerase chain reactions (PCR) were carried out in 25μL mixes containing 25ng of template DNA, 0.2mM of each dNTP, 1X Taq polymerase PCR buffer, 1.5mM MgCl2, 1 unit of Taq polymerase (Gibco/Invitrogene, San Diego, California, USA) and 0.2μM of a single 10-mer primer. Each reaction was overlaid with two drops of mineral oil to prevent evaporation. Amplifications were performed in a PTC-100TM (MJ Research, Inc. Waterton, Massachusetts, USA) thermal cycler with a program consisting of 45 cycles, each at 94°C for 2min, annealing at 36°C for 2min, and extension at 72°C for 2min. A final extension at 72°C for 7min was included. Amplification products were separated electrophoretically on 1.4% agarose gels with 1X TBE buffer at 200V for 2hrs and visualized by ethidium bromide fluorescence. Gels were photographed and further edited using a Genegenius program (Syngene, Cambridge, UK) and printed photographs were produced with a Syngene Digital Graphic Printer Up-D890 Sony. Molecular size of the RAPD bands was estimated using a 123- bp ladder as reference (Gibco/Invitrogene, San Diego California, USA).
In total, 280 10-mer random primers from Operon Technologies Inc., from Kit A (OPA) to N (OPN), were surveyed for consistency and repeatability. Six primers (OPH-04, OPH-07, OPH-13, OPH-18, OPI-09, and OPI-13) that produced consistent and reproducible RAPD bands were chosen for this study.
The interpretation of RAPD data assumes that RAPD fragments with the same weight (in the gel) represent the same locus (Fritsch & Rieseberg 1996). Absence of a marker within a population, although present in others, was assumed to indicate that all individuals of the population were homozygous for the “null” allele, rather than representing the loss of a locus (Liu 1998). RAPD fragments were scored as present (1) or absent (0) and these data were used to create a matrix of RAPD phenotypes. Genetic diversity levels within each population were assessed by calculating the percentage of polymorphic loci (P) and Shannon’s information index (I) using POPGENE ver. 1.31 (Yeh et al. 1999).
The partitioning of genetic variation among and within populations was investigated with an analysis of molecular variance (AMOVA; Excoffier et al. 1992) using the Arlequin ver. 3.0 software (Excoffier et al. 2005). The significances of the different variance components were estimated from distributions generated from 10 000 random permutations. We also estimated pairwise population differentiation using Slatkin’s linearized FST (Slatkin 1995) and the absolute number of migrants (M) between populations using Arlequin ver. 3.0 software (Excoffier et al. 2005). A Mantel test using Arlequin ver. 3.0 (Excoffier et al. 2005) was performed to evaluate the correlation between the matrices of genetic and geographical distances among populations.
The genetic relationship among individuals was assessed using a binary data matrix of 47 fragments. The selection of the fragments was based on their presence at a percentage greater than or equal to 75% in at least one population, the autopomorphic or bands present in only one individual were left out of the analysis because they do not provide relevant information for the clustering analysis. Each of the 159 individuals employed in this analysis was considered as an OTU, in order to observe genetic relationships regardless of population of origin. Genetic distances among individuals were calculated according to Nei & Li (1979). This distances were then used to depict relationships of genetic similarity among individuals with the unweighted pair group method with arithmetic averages (UPGMA) dendrogram, constructed using the PAUP program (Swofford 2002).
We further assessed the genetic structure of populations using the Bayesian clustering approach implemented in the software STRUCTURE version 2.3.1 (Pritchard et al. 2000). The data matrix was set up as specified in the program instructions for dominant markers. All 159 individuals from the four populations were analyzed jointly, without prior population information, under the admixture model with correlated allele frequencies. Even though the admixture model was not directly developed for dominant markers, STRUCTURE is expected to produce unbiased results with this kind of data, particularly when information is available for many loci (Pritchard et al. 2000). We ran K values (number of potential genetic clusters) from 1 to 10, with 10 independent runs for each K. The length of the burn-in was 500 000 steps followed by 106 iterations. The K value with the highest posterior probability was identified in this way, and also by using the ΔK statistics, which quantifies the second order rate of change of the likelihood function with respect to K (Evanno et al. 2005).
Results
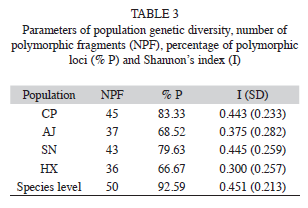
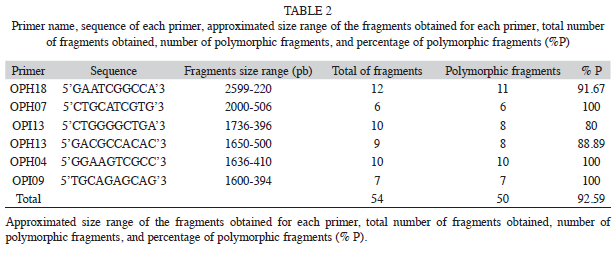
The six primers chosen for this study consistently amplified a total of 54 fragments that ranged in size from 220 to 2 599bp, with an average of nine fragments per primer (Table 2). Four of them (7.41%) were present in all individuals and 50 (92.59%) markers were polymorphic (Table 2). The percentage of Approximated size range of the fragments obtained for each primer, total number of fragments obtained, number of polymorphic fragments, and percentage of polymorphic fragments (% P). polymorphic fragments per population ranged from 83.3% (in population CP) to 66.7% (HX). Shanon’s index (I) values are shown in the table 3. The SN population showed the highest value (I=0.44), while population HX showed the lowest value (I=0.30). At the species level the value was I=0.45 (Table 3).
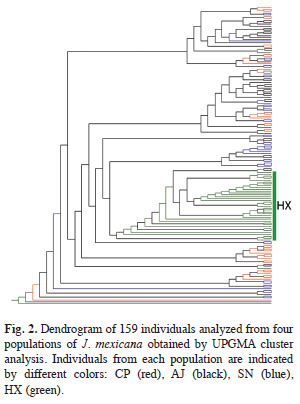
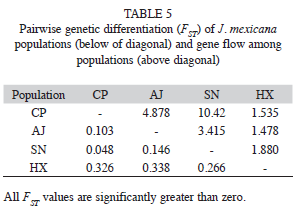
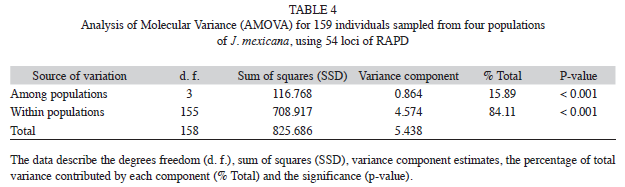
The AMOVA analysis showed that 15.89% (p<0.001) of the total genetic variation was among populations and 84.11% (p<0.001) was within populations (Table 4). The matrix of pairwise linearized FST values, and gene flow values, are shown in table 5. The highest genetic differentiation was between populations AJ and HX (FST=0.34), the lowest differentiation was between populations CP and SN (FST=0.05). Accordingly, the absolute number of migrants (M=Nm) among populations ranged from M=10.42 to M=1.48, with the highest gene flow between CP and SN, and the lowest gene flow between AJ and HX (Table 5). The UPGMA dendrogram depicting the genetic relationships among individuals is shown infigure 2. Almost all individuals belonging to the HX population formed a defined cluster, while the other 119 individuals belonging to CP, AJ and SN did not group according to population of origin (Fig. 2). The correlation between genetic and geographical distances among populations was positive but not significant (Mantel’s test, r=0.853, p=0.20).
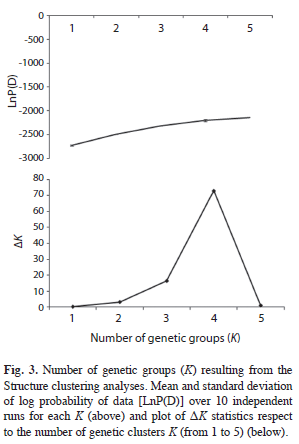
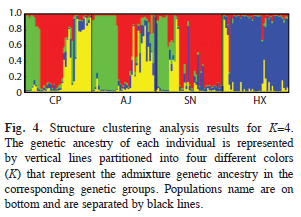
The results of the STRUCTURE analysis showed that the estimated ‘log probability of the data’ increase sharply from K=1 [LnP(D)=- 2 720.1] to K=4 [LnP(D)=-2 195.2] (Fig. 3). The values of ΔK indicated that K=4 (Fig. 3) is the most likely number of genetic groups for J. mexicana (Fig. 4).
Discussion
In this study, RAPD markers were used to evaluate levels of genetic variation and structure within and among populations of J. mexicana at the Biosphere Reserve of Sierra de Huautla, Morelos, Mexico. The data showed that populations CP, AJ and SN have comparatively higher levels of genetic diversity in comparison to the HX population. These results can be explained by the large demographic sizes of these populations (pers. obs.), and their geographic proximity, which may be facilitating gene flow, and in turn reducing inbreeding, fixation of alleles and genetic drift. In contrast, the HX population is characterized by a low density of trees and it is also the spatially more isolated, situated at an average linear distance of 10.79km from the other three populations. This spatial separation could increase inbreeding and genetic drift.
J. mexicana is a long-lived dioecious tree (Moreno 1980, Bullock 2002) mainly pollinated by nocturnal moths (Sphingidae) (Bawa 1980). These traits favor outcrossing and probably contribute to the maintenance of high levels of gene diversity (Hamrick et al. 1979, Hamrick & Godt 1989, Schierenbeck et al. 1997). The comparison of our data with similar studies using dominant markers showed that J. mexicana has on average higher levels of genetic diversity than Plathymenia reticulate (P=70.8%, I=0.396), an outcrossing, long-lived tropical tree of the Brazilian Cerrado, a kind of vegetation with a dry season that occurs for fivesix months, like in the tropical dry forest (Lacerda et al. 2001); Neolitsea sericea (P=50.5%, I=0.257) a woody, long-lived, perennial, outcrossing and insect pollinated plant (Wang et al. 2005); the temperate tree pollinated by insects and with fleshy fruits dispersed by animals Prunus mahaleb (P=52.1%, h=0.141; Jordano & Godoy 2000); and its congener Prunus pseudocerasus (P=84%, h=0.224, I=0.348), an insect-pollinated, perennial species with a long history of cultivation (Li et al. 2009); and Jacaranda decurrens (P=69.2% and 46.34% with RAPD and AFLP, respectively) (Bertoni et al. 2010). In contrast, J. mexicana shows lower levels of genetic diversity compared to Sesamum indicum (P=83%, h=0.34, I=0.513), an ancient oil crop cultivated throughout South East Asia that grows in tropical as well as in temperate climates (Pham et al. 2009). The genetic variation levels of J. mexicana were similar to those encountered in woody plants with long life cycles, wide distribution, crosspollination and biotic dispersal (Wang et al. 2005, Li et al. 2009).
The genetic structure of J. mexicana populations reveled significant genetic subdivision among populations (ΦST=0.16, P<0.001). Based on Wright’s interpretations of FST values (Wright 1978), J. mexicana populations at the REBIOSH were moderately differentiated. Similar results have been reported for several tropical trees that have high levels of genetic diversity and low or moderate levels of genetic differentiation even in populations that were located several kilometers away (Lacerda et al. 2001, Nason 2002). These patterns were explained by the close evolutionary and ecological relationships between tropical tree species and the animals that act as pollinators and seed dispersers (Nason 2002). Seed dispersal patterns can contribute to the partitioning of genetic variation within and among populations (Hamrick et al. 1993). Species with limited seed dispersal are likely to have genetic structure, while plant species with wide seed dispersal should have less spatial genetic structure. When dispersal is performed by animals (endozoochorous), plant species tend to have high levels of within-population genetic variation in comparison to species with other seeddispersal syndromes (Hamrick et al. 1993, Jordano & Godoy 2000). In this context, the fruit characteristics of J. mexicana should promote the movement of seeds, favoring some extent of gene flow. This is due to the presence of fleshy fruits that seem to fit the syndrome of dispersion by bats; and on the basis of the pulp color (intense orange), it can be suggested that these fruits are attractive to birds and coati (Valenzuela & Ceballos 2000, Bullock 2002) Valenzuela & Ceballos (2000) reported that coati consume fruits of J. mexicana commonly named bonete, which represent the 47% of the diet of these mammals during the time of drought in the tropical dry forests of Chamela-Cuixmala. Coati form herds of approximately 23 individuals, are nomadic and can move daily an average of 3.9km during the dry period of the year, so, they disperse the seeds in all directions facilitating germoplasm movement.
The genetic relationship among the 159 analyzed individuals of J. mexicana were represented in a dendrogram showing a clear genetic differentiation of HX individuals respect to the others 119 individuals of CP, AJ and SN. A possible explanation could be that CP, AJ and SN populations are geographically proximate (pairwise distances vary from 2 to 4.63km) and have large population sizes (pers. obs.). These factors could be favoring interpopulation genetic interchange through pollen and seed dispersal. In contrast, HX individuals were the most genetically differentiated and geographically distant (separated on average 10.79km of linear distant from the other populations). In addition to geographical distance, some orographic and ecological factors could be contributing to the isolation of this population. Some patches of secondary vegetation were situated between this population and the other three, which may limit the movement of seed dispersers. Also, the HX population was located on a slope with chalky soil, what results in a dry microhabitat with low humidity, that could affect the flowering phenology of the trees, generating ecological isolation despite the considerable dispersal capability of pollinators. Also, this population was characterized by a low density of J. mexicana trees and there was little evidence of recruitment (per. obs). These suggests that even though seeds could be moved to this site by dispersers, the probability of germination and successful establishment is low, thus resulting in lower levels of realized gene flow.
The results of the Bayesian clustering analysis of genetic structure showed that the populations analyzed of J. mexicana from the REBIOSH, best fit four genetic groups (K=4). This analysis also recognized the genetic distinctness of population HX, which was almost completely constituted by a single genetic group found in low proportion in the other three populations. These, in turn, appeared to have heterogeneous proportions from the other three genetic groups, probably highlighting groups of individuals that are genealogically related. This result is largely congruent with the relationships depicted in the UPGMA dendrogram.
The use of molecular-genetic markers as RAPD allowed us to determine the genetic structure of J. mexicana, and provided an opportunity to infer indirectly gene flow and relationships among individuals at a local geographical scale. Our results emphasize the potential genetic heterogeneity of some tropical dry forest tree populations even at small geographical scales, which should be considered when designing conservation or management programs. Particularly, the translocation of individuals with reforestation purposes should take into account the local genetic composition of populations, even if these are in geographic proximity. Overall, this work contributes to the scientific knowledge of biological conservation areas, which have been considered as reservoirs of genetic diversity and evolutionary processes of wildlife.
Acknowledgments
The authors thank to David Salinas, Rolando Ramírez, Valentino Sorani and Karla T. Rojas for technical support. We thank Omar Chassin and one anonymous reviewers for their comments and suggestions.
Jacaratia mexicana A D.C. (Caricaceae), commonly named “bonete” is a long-lived native tree of tropical dry forests in Mexico, considered the type of vegetation in greater danger of disappearing totally (Janzen 1988) mainly due to land use change (Sala et al. 2000). J. mexicana has a neotropical distribution that extends in Mexico through the Southern region of the Sierra Madre Occidental, the Trans-Mexican Volcanic Belt, and the Sierra Madre del Sur (Rzedowski & Equihua 1987). It is also found in Nicaragua and El Salvador in Central America (Cronquist 1981). It is a dioecious species (Moreno 1980, Bullock 2002), with biotic pollination that depends on visual and scent mimicry (Bawa 1980). Female flowers lack reward for pollinators but their scent is similar to the male flowers, which produce a little nectar with a high content of amino acids. Nocturnal moths (Sphingidae) have been observed visiting both male and female flowers (Bullock 2002). A recent study on the morphological variation of the flowers of J. mexicana showed that female plants produce only pistillate flowers, while male plants are sexually variable and can bear three different types of flowers: staminate, pistillate and perfect (Aguirre et al. 2009). This pattern of sexual variation raises interesting evolutionary, ecological and genetic questions about the evolution of sexual expression in this species and in the Caricaceae family (Aguirre et al. 2009). The fruits of J. mexicana are fleshy, and mature during the dry season, and the seeds are dispersed by birds, bats and coatis (Valenzuela & Ceballos 2000, Bullock 2002). The uses of J. mexicana date from the pre-Hispanic time (Briones 2002). Fruit and seeds are used for food (Guizar & Sánchez 1991). Moreover, antiparasitic properties are attributed to this plant (Niembro 1986), and a proteolytic enzyme called “mexicain”, analogous to papain, is also present in the flesh of the fruits (Moreno 1980). For all these reasons J. mexicana is cultivated sometimes in dry tropical zones (Rzedoswki & Equihua 1987), and several important questions regarding possible processes of domestication have been recently pointed out.
A recent phylogeographic study of wild and cultivated accessions of J. mexicana in Mexico, using chloroplast and nuclear sequences, revealed that haplotype and nucleotide diversity are significantly higher in wild populations than in cultivated ones. The reduction in genetic diversity suggests that artificial selection (mainly on fruit traits) and possible population bottlenecks during the domestication process resulted in a progressive loss of genetic diversity (Arias et al. 2010). However, there is no information regarding the diversity and genetic structure of J. mexicana natural populations, despite its importance as a model system of plant evolution, and its economic value as food and as a potential source of pharmaceutical products. This knowledge would be very useful to understand processes involved in the evolution and ecology of populations of the species, and could contribute to optimize the use of this genetic resource. In this study, we analyzed the level and distribution of genetic variation within and between four populations of J. mexicana at a local scale in the Sierra de Huautla Biosphere Reserve, Morelos, Mexico.
Material and Methods
Sample collections and DNA extraction: A total of 159 individuals from four natural populations of J. mexicana were sampled in the Sierra de Huautla Biosphere Reserve during the rainy season in July-August 2003. The four populations were Cruz Pintada (CP), Ajuchitlán (AJ), Santiopan (SN) and Huaxtla (HX) and their geographical location and sample size are provided in table 1 and figure 1. From each individual, five young leaves were collected (from mature trees) and were placed in sealed plastic bags and stored at -80°C in the laboratory for further DNA extraction.
Genomic DNA was extracted from approximately 100mg of leaf tissue using a modification of the cetyltrimethylammonium bromide (CTAB) with an additional phenol-chloroformisoamylalcohol (25:24:1) cleaning step (Lefort & Douglas 1999). Once genomic DNA was obtained, it was quantified with a spectrophotometer (GENEQUANT pro.), and the DNA from each individual was diluted and standardized to a final concentration of 25ng/μL.
Primer selection and RAPD analysis: Polymerase chain reactions (PCR) were carried out in 25μL mixes containing 25ng of template DNA, 0.2mM of each dNTP, 1X Taq polymerase PCR buffer, 1.5mM MgCl2, 1 unit of Taq polymerase (Gibco/Invitrogene, San Diego, California, USA) and 0.2μM of a single 10-mer primer. Each reaction was overlaid with two drops of mineral oil to prevent evaporation. Amplifications were performed in a PTC-100TM (MJ Research, Inc. Waterton, Massachusetts, USA) thermal cycler with a program consisting of 45 cycles, each at 94°C for 2min, annealing at 36°C for 2min, and extension at 72°C for 2min. A final extension at 72°C for 7min was included. Amplification products were separated electrophoretically on 1.4% agarose gels with 1X TBE buffer at 200V for 2hrs and visualized by ethidium bromide fluorescence. Gels were photographed and further edited using a Genegenius program (Syngene, Cambridge, UK) and printed photographs were produced with a Syngene Digital Graphic Printer Up-D890 Sony. Molecular size of the RAPD bands was estimated using a 123- bp ladder as reference (Gibco/Invitrogene, San Diego California, USA).
In total, 280 10-mer random primers from Operon Technologies Inc., from Kit A (OPA) to N (OPN), were surveyed for consistency and repeatability. Six primers (OPH-04, OPH-07, OPH-13, OPH-18, OPI-09, and OPI-13) that produced consistent and reproducible RAPD bands were chosen for this study.
The interpretation of RAPD data assumes that RAPD fragments with the same weight (in the gel) represent the same locus (Fritsch & Rieseberg 1996). Absence of a marker within a population, although present in others, was assumed to indicate that all individuals of the population were homozygous for the “null” allele, rather than representing the loss of a locus (Liu 1998). RAPD fragments were scored as present (1) or absent (0) and these data were used to create a matrix of RAPD phenotypes. Genetic diversity levels within each population were assessed by calculating the percentage of polymorphic loci (P) and Shannon’s information index (I) using POPGENE ver. 1.31 (Yeh et al. 1999).
The partitioning of genetic variation among and within populations was investigated with an analysis of molecular variance (AMOVA; Excoffier et al. 1992) using the Arlequin ver. 3.0 software (Excoffier et al. 2005). The significances of the different variance components were estimated from distributions generated from 10 000 random permutations. We also estimated pairwise population differentiation using Slatkin’s linearized FST (Slatkin 1995) and the absolute number of migrants (M) between populations using Arlequin ver. 3.0 software (Excoffier et al. 2005). A Mantel test using Arlequin ver. 3.0 (Excoffier et al. 2005) was performed to evaluate the correlation between the matrices of genetic and geographical distances among populations.
The genetic relationship among individuals was assessed using a binary data matrix of 47 fragments. The selection of the fragments was based on their presence at a percentage greater than or equal to 75% in at least one population, the autopomorphic or bands present in only one individual were left out of the analysis because they do not provide relevant information for the clustering analysis. Each of the 159 individuals employed in this analysis was considered as an OTU, in order to observe genetic relationships regardless of population of origin. Genetic distances among individuals were calculated according to Nei & Li (1979). This distances were then used to depict relationships of genetic similarity among individuals with the unweighted pair group method with arithmetic averages (UPGMA) dendrogram, constructed using the PAUP program (Swofford 2002).
We further assessed the genetic structure of populations using the Bayesian clustering approach implemented in the software STRUCTURE version 2.3.1 (Pritchard et al. 2000). The data matrix was set up as specified in the program instructions for dominant markers. All 159 individuals from the four populations were analyzed jointly, without prior population information, under the admixture model with correlated allele frequencies. Even though the admixture model was not directly developed for dominant markers, STRUCTURE is expected to produce unbiased results with this kind of data, particularly when information is available for many loci (Pritchard et al. 2000). We ran K values (number of potential genetic clusters) from 1 to 10, with 10 independent runs for each K. The length of the burn-in was 500 000 steps followed by 106 iterations. The K value with the highest posterior probability was identified in this way, and also by using the ΔK statistics, which quantifies the second order rate of change of the likelihood function with respect to K (Evanno et al. 2005).
Results
The six primers chosen for this study consistently amplified a total of 54 fragments that ranged in size from 220 to 2 599bp, with an average of nine fragments per primer (Table 2). Four of them (7.41%) were present in all individuals and 50 (92.59%) markers were polymorphic (Table 2). The percentage of Approximated size range of the fragments obtained for each primer, total number of fragments obtained, number of polymorphic fragments, and percentage of polymorphic fragments (% P). polymorphic fragments per population ranged from 83.3% (in population CP) to 66.7% (HX). Shanon’s index (I) values are shown in the table 3. The SN population showed the highest value (I=0.44), while population HX showed the lowest value (I=0.30). At the species level the value was I=0.45 (Table 3).
The AMOVA analysis showed that 15.89% (p<0.001) of the total genetic variation was among populations and 84.11% (p<0.001) was within populations (Table 4). The matrix of pairwise linearized FST values, and gene flow values, are shown in table 5. The highest genetic differentiation was between populations AJ and HX (FST=0.34), the lowest differentiation was between populations CP and SN (FST=0.05). Accordingly, the absolute number of migrants (M=Nm) among populations ranged from M=10.42 to M=1.48, with the highest gene flow between CP and SN, and the lowest gene flow between AJ and HX (Table 5). The UPGMA dendrogram depicting the genetic relationships among individuals is shown infigure 2. Almost all individuals belonging to the HX population formed a defined cluster, while the other 119 individuals belonging to CP, AJ and SN did not group according to population of origin (Fig. 2). The correlation between genetic and geographical distances among populations was positive but not significant (Mantel’s test, r=0.853, p=0.20).
The results of the STRUCTURE analysis showed that the estimated ‘log probability of the data’ increase sharply from K=1 [LnP(D)=- 2 720.1] to K=4 [LnP(D)=-2 195.2] (Fig. 3). The values of ΔK indicated that K=4 (Fig. 3) is the most likely number of genetic groups for J. mexicana (Fig. 4).
Discussion
In this study, RAPD markers were used to evaluate levels of genetic variation and structure within and among populations of J. mexicana at the Biosphere Reserve of Sierra de Huautla, Morelos, Mexico. The data showed that populations CP, AJ and SN have comparatively higher levels of genetic diversity in comparison to the HX population. These results can be explained by the large demographic sizes of these populations (pers. obs.), and their geographic proximity, which may be facilitating gene flow, and in turn reducing inbreeding, fixation of alleles and genetic drift. In contrast, the HX population is characterized by a low density of trees and it is also the spatially more isolated, situated at an average linear distance of 10.79km from the other three populations. This spatial separation could increase inbreeding and genetic drift.
J. mexicana is a long-lived dioecious tree (Moreno 1980, Bullock 2002) mainly pollinated by nocturnal moths (Sphingidae) (Bawa 1980). These traits favor outcrossing and probably contribute to the maintenance of high levels of gene diversity (Hamrick et al. 1979, Hamrick & Godt 1989, Schierenbeck et al. 1997). The comparison of our data with similar studies using dominant markers showed that J. mexicana has on average higher levels of genetic diversity than Plathymenia reticulate (P=70.8%, I=0.396), an outcrossing, long-lived tropical tree of the Brazilian Cerrado, a kind of vegetation with a dry season that occurs for fivesix months, like in the tropical dry forest (Lacerda et al. 2001); Neolitsea sericea (P=50.5%, I=0.257) a woody, long-lived, perennial, outcrossing and insect pollinated plant (Wang et al. 2005); the temperate tree pollinated by insects and with fleshy fruits dispersed by animals Prunus mahaleb (P=52.1%, h=0.141; Jordano & Godoy 2000); and its congener Prunus pseudocerasus (P=84%, h=0.224, I=0.348), an insect-pollinated, perennial species with a long history of cultivation (Li et al. 2009); and Jacaranda decurrens (P=69.2% and 46.34% with RAPD and AFLP, respectively) (Bertoni et al. 2010). In contrast, J. mexicana shows lower levels of genetic diversity compared to Sesamum indicum (P=83%, h=0.34, I=0.513), an ancient oil crop cultivated throughout South East Asia that grows in tropical as well as in temperate climates (Pham et al. 2009). The genetic variation levels of J. mexicana were similar to those encountered in woody plants with long life cycles, wide distribution, crosspollination and biotic dispersal (Wang et al. 2005, Li et al. 2009).
The genetic structure of J. mexicana populations reveled significant genetic subdivision among populations (ΦST=0.16, P<0.001). Based on Wright’s interpretations of FST values (Wright 1978), J. mexicana populations at the REBIOSH were moderately differentiated. Similar results have been reported for several tropical trees that have high levels of genetic diversity and low or moderate levels of genetic differentiation even in populations that were located several kilometers away (Lacerda et al. 2001, Nason 2002). These patterns were explained by the close evolutionary and ecological relationships between tropical tree species and the animals that act as pollinators and seed dispersers (Nason 2002). Seed dispersal patterns can contribute to the partitioning of genetic variation within and among populations (Hamrick et al. 1993). Species with limited seed dispersal are likely to have genetic structure, while plant species with wide seed dispersal should have less spatial genetic structure. When dispersal is performed by animals (endozoochorous), plant species tend to have high levels of within-population genetic variation in comparison to species with other seeddispersal syndromes (Hamrick et al. 1993, Jordano & Godoy 2000). In this context, the fruit characteristics of J. mexicana should promote the movement of seeds, favoring some extent of gene flow. This is due to the presence of fleshy fruits that seem to fit the syndrome of dispersion by bats; and on the basis of the pulp color (intense orange), it can be suggested that these fruits are attractive to birds and coati (Valenzuela & Ceballos 2000, Bullock 2002) Valenzuela & Ceballos (2000) reported that coati consume fruits of J. mexicana commonly named bonete, which represent the 47% of the diet of these mammals during the time of drought in the tropical dry forests of Chamela-Cuixmala. Coati form herds of approximately 23 individuals, are nomadic and can move daily an average of 3.9km during the dry period of the year, so, they disperse the seeds in all directions facilitating germoplasm movement.
The genetic relationship among the 159 analyzed individuals of J. mexicana were represented in a dendrogram showing a clear genetic differentiation of HX individuals respect to the others 119 individuals of CP, AJ and SN. A possible explanation could be that CP, AJ and SN populations are geographically proximate (pairwise distances vary from 2 to 4.63km) and have large population sizes (pers. obs.). These factors could be favoring interpopulation genetic interchange through pollen and seed dispersal. In contrast, HX individuals were the most genetically differentiated and geographically distant (separated on average 10.79km of linear distant from the other populations). In addition to geographical distance, some orographic and ecological factors could be contributing to the isolation of this population. Some patches of secondary vegetation were situated between this population and the other three, which may limit the movement of seed dispersers. Also, the HX population was located on a slope with chalky soil, what results in a dry microhabitat with low humidity, that could affect the flowering phenology of the trees, generating ecological isolation despite the considerable dispersal capability of pollinators. Also, this population was characterized by a low density of J. mexicana trees and there was little evidence of recruitment (per. obs). These suggests that even though seeds could be moved to this site by dispersers, the probability of germination and successful establishment is low, thus resulting in lower levels of realized gene flow.
The results of the Bayesian clustering analysis of genetic structure showed that the populations analyzed of J. mexicana from the REBIOSH, best fit four genetic groups (K=4). This analysis also recognized the genetic distinctness of population HX, which was almost completely constituted by a single genetic group found in low proportion in the other three populations. These, in turn, appeared to have heterogeneous proportions from the other three genetic groups, probably highlighting groups of individuals that are genealogically related. This result is largely congruent with the relationships depicted in the UPGMA dendrogram.
The use of molecular-genetic markers as RAPD allowed us to determine the genetic structure of J. mexicana, and provided an opportunity to infer indirectly gene flow and relationships among individuals at a local geographical scale. Our results emphasize the potential genetic heterogeneity of some tropical dry forest tree populations even at small geographical scales, which should be considered when designing conservation or management programs. Particularly, the translocation of individuals with reforestation purposes should take into account the local genetic composition of populations, even if these are in geographic proximity. Overall, this work contributes to the scientific knowledge of biological conservation areas, which have been considered as reservoirs of genetic diversity and evolutionary processes of wildlife.
Acknowledgments
The authors thank to David Salinas, Rolando Ramírez, Valentino Sorani and Karla T. Rojas for technical support. We thank Omar Chassin and one anonymous reviewers for their comments and suggestions.
References
Aguirre, A., M. Vallejo-Marín, E.M. Piedra-Malagón, R. Cruz-Ortega & R. Dirzo. 2009. Morphological variation in the flowers of Jacaratia mexicana A. DC. (Caricaceae), a subdioecious tree. Plant Biol. 11: 417-424. [ Links ]
Arias, D., O. Dorado & B. Maldonado. 2002. Biodiversidad e importancia de la selva baja caducifolia: la reserva de la biosfera Sierra de Huautla. Biodiversitas 45: 7-12. [ Links ]
Arias, D., J. Peñaloza-Ramírez, O. Dorado, P. Cuevas-Reyes, E. Leyva, A.L. Albarrán-Lara & G. Rangel-Altamirano. 2010. Phylogeographic patterns and possible incipient domestication of Jacaratia Mexicana A DC. (Caricaeae) in Mexico. Genet. Resour. Crop Evol. 57: 1227-1238. [ Links ]
Ayala, F.J. & J.A. Kinger. 1980. Modern genetics. The Benjamin/Cummings, California, USA. [ Links ]
Bawa, K.S. 1980. Outcrossing and the incidence of dioecism in island floras. Am. Nat. 199: 866-871. [ Links ]
Bertoni, B.W., M.P.C. Telles, M.G. Malosso, S.C.Z. Torres, J.O. Pereira, M.V. Lourenco, S.C. Franca & A.M.S. Pereira. 2010. Genetic diversity in natural populations of Jacaranda decurrens Cham. Determined using RAPD and AFLP markers. Genet. Mol. Biol. 33: 532-538. [ Links ]
Briones, M.R. 2002. Timbiriche y Cuaguayote: Plantas milenarias en extinción. Hypatia 17: 1-3. [ Links ]
Bullock, S. 2002. Jacaratia mexicana A. DC. (Caricaceae): bonete, p. 155-157. In F.A. Noguera, R.J.H. Vega, A.A.N. García & A.M. Quesada. Historia Natural de Chamela. Instituto de Biología-UNAM, México D.F., México. [ Links ]
Cronquist, A. 1981. An integrated system of classification of flowering plants. Columbia University, New York, USA. [ Links ]
Dobzhansky, T., F.J. Ayala, G.L. Stebbins & J.W. Valentine. 1993. Evolution. Omega, Barcelona, Spain. [ Links ]
Dorado, O., B. Maldonado, D.M. Arias, V. Sorani, R. Ramírez, E. Leyva & D. Valenzuela. 2005. Programa de Conservación y Manejo Reserva de la biosfera Sierra de Huautla. CONANP, México. [ Links ]
Evanno, G., S. Regnaut & J. Goudet. 2005. Detecting the number of clusters of individuals using software STRUCTURE: a simulation study. Mol. Ecol. 14: 2611-2620. [ Links ]
Excoffier, L., P.E. Smouse & J.M. Quattro. 1992. Analysis of molecular variance inferred from metric distances among DNA haplotypes: application to human mitochondrial DNA restriction data. Genetics 131: 479-491. [ Links ]
Excoffier, L., G. Laval & S. Schneider. 2005. Arlequin ver. 3.0: an integrated software package for population genetics data analysis. EBO 1: 47-50. [ Links ]
Fergunson, M.E., B.V. Ford-Lloyd, L.D. Robertson, N. Maxted & H.J. Newbury. 1998. Mapping the geographical distribution of genetic variation in the genus Lens for the enhanced conservation of plant genetic diversity. Mol. Ecol. 7: 1743-1755. [ Links ]
Fritsch, P. & L.H. Rieseberg. 1996. The use of Random Amplified Polymorphic DNA (RAPD) in conservation genetics, p 54-73. In T.B. Smith & R.K. Wayne. Molecular genetic approaches in conservation. Oxford University, New York, USA. [ Links ]
Griffiths, A.J.F., J.H. Miller, D.T. Suzuki, R.C. Lewontin & W.M. Gelbart. 2000. An introduction to genetic analysis. WH Freeman and Company, New York. USA. [ Links ]
Guizar, N. & V. Sánchez. 1991. Principales árboles del alto Balsas. Universidad de Chapingo. México D.F., México. [ Links ]
Hamrick, J.L., Y.B. Linhart & J.B. Mitton. 1979. Relationships between life history characteristics and electrophoretically detectable genetic variation in plants. Ann. Rev. Ecol. Syst. 10: 173-200. [ Links ]
Hamrick, J.L. & M.J. Godt. 1989. Allozyme diversity in plant species, p 43-63. In A.H.D. Brown, M.T. Clegg, A.L. Kahler & B.S. Weir. Plant population genetics, breeding and germplasm resources. Sinauer, Sunderland, Massachusetts, USA. [ Links ]
Hamrick, J.L., D.A. Murawski & J.D. Nason. 1993. The influence of seed dispersal mechanisms on the genetic structure of tropical tree populations. Vegetatio 108: 281-297. [ Links ]
Janzen, D.H. 1988. Tropical dry forests: The most endangered major tropical ecosystem, p. 130-137. In E.O. Wilson. Biodiversity. Natural Academy, Washington, USA. [ Links ]
Jordano, P. & J.A. Godoy. 2000. RAPD variation and population genetic structure in Prunus mahaleb (Rosaceae), an animal-dispersed tree. Mol. Ecol. 9: 1293-1305. [ Links ]
Lacerda, D.R., M.D.P. Acedo, J.P. Lemos Filho & M.B. Lovato. 2001. Genetic diversity and structure of natural populations of Plathymenia reticulata (Mimosoideae), a tropical tree from the Brazilian Cerrado. Mol. Ecol. 10: 1143-1152. [ Links ]
Lefort, F., G.C. Douglas. 1999. An efficient micro-method of DNA isolation from mature leaves of four hardwood tree species Acer, Fraxinus, Prunus and Quercus. Ann. Forest Sci. 56: 259-263. [ Links ]
Li, M.M., Y.L. Cai, Z.Q. Qian & G.F. Zhao. 2009. Genetic diversity and differentiation in Chinese sour cherry Prunus pseudocerasus Lindl., and its implications for conservation. Genet. Resour. Crop Evol. 56: 455-464. [ Links ]
Liu, B.H. 1998. Statistical genomics: linkage, mapping and QTL analysis. CRC Science, New York, USA. [ Links ]
Maki, M. & S. Horie. 1999. Random amplified polymorphic DNA (RAPD) markers reveal less genetic variation in the endangered plant Cerastium fischerianum var. molle than in the widespread conspecific C. fischerianum var. fischerianum (Caryophyllaceae). Mol. Ecol. 8: 145-150. [ Links ]
Maldonado, A.B. 1997. Aprovechamiento de los recursos florísticos de la Sierra de Huautla, Morelos, México. Master Thesis, Universidad Nacional Autónoma de México, México. [ Links ]
Moreno, N.P. 1980. Flora de Veracruz: Cariacaceae. Instituto Nacional de Investigaciones sobre Recursos Bióticos, Xalapa, Veracruz, México. [ Links ]
Morrone, J.J. 2005. Hacia la síntesis biogeográfica de México. Rev. Mex. Biodivers. 76: 207-252. [ Links ]
Nason, J.D. 2002. La estructura genética de las poblaciones de árboles, p 299-330. In M.R. Guariguata & G.H. Kattan. Ecología y conservación de Bosques Neotropicales. Libro Universitario Regional, Cartago, Costa Rica. [ Links ]
Nei, M. & W.H. Li. 1979. Mathematical model for studying genetic variation in terms of restriction endonucleases. Proc. Natl. Acad. Sci. USA 76: 5269-5273. [ Links ]
Niembro, R. 1986. Árboles y arbustos de México. Limusa, México D.F., México. [ Links ]
Palacios, C. & F. González-Candelas. 1997. Lack of genetic variability in the rare and endangered Limonium cavanillesii (Plumbaginaceae) using RAPD markers. Mol. Ecol. 6: 671-675. [ Links ]
Pham, T.D., T.M. Bui, G. Werlemark, T.C. Bui, A. Merker & A.S. Carlsson. 2009. A study of genetic diversity of sesame (Sesamum indicum L.) in Vietnam and Cambodia estimated by RAPD markers. Genet. Resour. Crop Evol. 56: 679-690. [ Links ]
Pritchard, J.K., M. Stephens, P. Donnelly. 2000. Inference of population structure using multilocus genotypes data. Genetics 155: 945-959. [ Links ]
Rzedowski, J. 1978. Vegetación de México. Limusa, México, D.F., México. [ Links ]
Rzedowski, J. & M. Equihua. 1987. Colección atlas cultural: flora. Secretaría de Educación Pública, Instituto Nacional de Antropología e Historia. Planeta, México D.F., México. [ Links ]
Rzedowski, J. 1991. Diversidad y orígenes de la flora fanerogámica de México. Acta Bot. Mex. 14: 3-21. [ Links ]
Sala, O.E., F. Stuart, F. Chapin III, J.J. Armesto, E. Berlow, J. Bloomfield, R. Dirzo, E. Huber-Sanwald, L.F. Huenneke, R.B. Jackson, A. Kinzig, R. Leemans, D.M. Lodge, H.A. Mooney, M. Oesterheld, N.L. Poff, M.T. Sykes, B.H. Walker, M. Walker & D.H. Wall. Global biodiversity scenarios for the year 2100. Science 287: 1770-1774. [ Links ]
Schierenbeck, K.A., M. Skupski, D. Lieberman & M. Liberman. 1997. Population structure and genetic diversity in four tropical tree species in Costa Rica. Mol. Ecol. 6: 137-144. [ Links ]
Slatkin, M. 1995. A measure of population subdivision base on microsatellites allele frequencies. Genetics 139: 467-462. [ Links ]
Swofford, D.L. 2002. PAUP: Phylogenetic Analysis Using Parsimony (and other methods), version 4. Sinauer Associates, Sunderland Massachusetts, USA. [ Links ]
Valenzuela, D. & G. Ceballos. 2000. Habitat selection, home range, and activity of the white-nosed coati (Nasua narica) in a Mexican tropical dry forest. J. Mammal. 81: 810-819. [ Links ]
Wang, Z.S., S.Q. An, H. Liu, X. Leng, J.W. Zheng & Y.H. Liu. 2005. Genetic structure of the endangered plant Neolitsea sericea (Lauraceae) from the Zhoushan Archipelago using RAPD markers. Ann. Bot. 95: 305-313. [ Links ]
Wright, S. 1978. Evolution and the genetics of populations: Vol 4. Variability within andamong natural populations. University of Chicago, Chicago, USA. [ Links ]
Yeh, F.C., R.C. Yang, T. Boyle. 1999. POPGENE Version 1.31. Microsoft window-based freeware for population genetic analysis. University of Alberta and Centre for International Forestry Research. [ Links ]
*Correspondencia a: Dulce M. Arias, Oscar Dorado & Esaú Leyva; Centro de Educación Ambiental e Investigación Sierra de Huautla (CEAMISH), Universidad Autónoma del Estado de Morelos, Av. Universidad 1001, Col. Chamilpa, Cuernavaca, 62210, Morelos, México; dulce@uaem.mx, esau@uaem.mx , odorado@uaem.mx
Ana L. Albarrán-Lara, Antonio González-Rodríguez & Juan Peñaloza-Ramírez; Centro de Investigaciones en Ecosistemas (CIEco), Universidad Nacional Autónoma de México (UNAM), Antigua Carretera a Pátzcuaro No. 8701, Col. Ex Hacienda de San José de la Huerta, Morelia, 58190, Michoacán, México; aalbarran@oikos.unam.mx , agrodrig@oikos.unam.mx, jpenaloza@oikos.unam.mx
1. Centro de Educación Ambiental e Investigación Sierra de Huautla (CEAMISH), Universidad Autónoma del Estado de Morelos, Av. Universidad 1001, Col. Chamilpa, Cuernavaca, 62210, Morelos, México; dulce@uaem.mx, esau@uaem.mx , odorado@uaem.mx
2. Centro de Investigaciones en Ecosistemas (CIEco), Universidad Nacional Autónoma de México (UNAM), Antigua Carretera a Pátzcuaro No. 8701, Col. Ex Hacienda de San José de la Huerta, Morelia, 58190, Michoacán, México; aalbarran@oikos.unam.mx , agrodrig@oikos.unam.mx, jpenaloza@oikos.unam.mx
Received 14-XII-2010. Corrected 13-V-2011. Accepted 16-VI-2011.

