


Services on Demand
Journal
Article
 English (pdf)
 Article in xml format
 Article references
 Send this article by e-mail
Indicators
-
 Cited by SciELO
 -
 Access statistics
Related links
-
 Similars in
SciELO
Similars in
SciELO  uBio
uBio
Share

 Permalink
Revista de Biología Tropical
On-line version ISSN 0034-7744Print version ISSN 0034-7744
Rev. biol. trop vol.59 n.4 San José Dec. 2011
Age, growth and mortality of Clarias gariepinus (Siluriformes: Clariidae) in the Mid-Cross River-Floodplain ecosystem, Nigeria
Okechukwu Idumah Okogwu
Applied Biology Department, Ebonyi State University, PMB 53, Abakaliki, Ebonyi State, Nigeria; okeyokogwu@yahoo.com
Abstract
Clarias gariepinus is a threatened highly prized species used for some elite ceremonies by the local communities. Artisanal fishers take advantage of this species annual breeding migration from the lower Cross River to the floodplain lakes in Mid-Cross River during the rainy season, and some migrant stocks are not able to spawn. Since there is a lack of information on this species population dynamics in the Mid-Cross area, this study aimed to evaluate the age, growth and mortality to support the development of effective management plans. For this, monthly overnight gill net catches (from 6 to 72mm mesh sizes) were developed between March 2005 and February 2007. Growth parameters were determined using the FiSAT II length-frequency distribution. A total of 1 421 fish were collected during the survey. The asymptotic growth (L∞) was 80.24cm, growth rate (K) was 0.49/year while the longevity was 6.12years. The annual instantaneous rate of total mortality (Z) was 2.54/year and the natural mortality (M) was 0.88. Fishing mortality (1.66/year) was higher than the biological reference points (Fopt=0.83 and Flimit=1.11) and the exploitation rate (0.66) was higher than the predicted value (Emax=0.64) indicating that C. gariepinus was over exploited in the Mid-Cross River-Floodplain ecosystem. Some recommended immediate management actions are to strengthen the ban of ichthyocide fishing, closure of the floodplain lakes for most of the year, restricted access to the migratory path of the fish during the flood period and vocational training to the fishers. In order to recover and maintain a sustainable harvest, I suggest that a multi-sector stakeholder group should be formed with governmental agents, community leaders, fishers, fisheries scientists and non-governmental organizations. These short and long term measures, if carefully applied, will facilitate recovery of the fishery. Rev. Biol. Trop. 59 (4): 1707-1716. Epub 2011 December 01.
Key words: Clarias gariepinus, Cross River, age, floodplain, Nigeria, over exploitation.
Resumen
Clarias gariepinus es una especie en peligro de alto valor, usada para ceremonias de la élite de las comunidades locales. Los pescadores artesanales toman ventaja de las migraciones anuales de reproducción de esta especie, que van desde el bajo "Cross River" hasta los lagos de las planicies inundadas en "Mid-Cross River" durante la época lluviosa, y que algunas poblaciones migratorias no son capaces de generar. Debido a que hay una falta de información de la dinámica poblacional de estas especies en el área "Mid-Cross", este estudio está dirigido a evaluar la edad, crecimiento y mortalidad, para ayudar a desarrollar planes de manejo efectivos. Para esto, cada noche mensualmente se hicieron entre Marzo 2005 y Febrero 2007 recolectas con red de enmalle (de 6 a 72mm tamaños de malla). Los parámetros de crecimientos fueron determinados usando distribución FiSAT II longitud-frecuencia. Un total de 1 421 peces fueron recolectados durante el estudio. El crecimiento asintótico (L∞) fue de 80.24cm., la tasa de crecimiento (K) fue 0.49/año, mientras que la longevidad fue de 6.12 años. La tasa instantánea anual de mortalidad (Z) fue de 2.54/ año y la mortalidad natural (M) de 0.88. La mortalidad de pesca (1.66/año) fue más alta que los puntos en la referencia biológica (Fopt=0.83 and Flimit=1.11) y la tasa de explotación (0.66) fue más alta que el valor predicho (Emax=0.64), indicando que C. gariepinus es sobreexplotado en el ecosistema Mid-Cross River-Floodplain. Algunas recomendaciones de acciones inmediatas en el manejo son el endurecimiento en la prohibición de la pesca de ictiocidos, el cierre de los lagos de las planicies inundadas la mayor parte del año, acceso restringido al paso migratorio de los peces durante el periodo de inundación y entrenamiento vocacional a los pescadores. En orden de recuperar y mantener una explotación sostenible, yo sugiero que se debe formar un grupo multi-sector de las partes interesadas, con agentes del gobierno, líderes de la comunidad, pescadores, científicos de la pesca y organizaciones no gubernamentales. Estas medidas de corto y mediano plazo, aplicadas cuidadosamente, facilitaran la recuperación de la pesca.
Palabras clave: Clarias gariepinus, Cross River, edad, planicie inundada, Nigeria, sobreexplotación.
Clarias gariepinus is highly prized by indigenous consumers in Afikpo and nearby communities due to the size, tasty flesh and the absence of intramuscular bones. Recent evidence (Okogwu 2008) shows that it constitutes a significant percentage of the catches of artisanal fishers in the Mid-Cross River who target the migratory stock. C. gariepinus like Chrysichthyes nigrodigitatus and other catfishes of the Cross River migrate seasonally to the floodplain lakes in the Mid-Cross to breed between May and October (Idodo-Umeh 2003). These migrant stocks are highly vulnerable to the gillnets of artisanal fishers and many of them do not make it to the lakes or back to the lower Cross.
Previously, artisanal fishers were believed to have minimal impact on fish abundance and diversity, however, recent studies have shown that they may be contributing significantly to the reduction in fish stock and diversity (King 2007). This is because over 90% of world fishers are artisanal and some of them employ unorthodox methods to catch fish. These methods include, use of ichthyocides and small mesh sized nets. The use of ichthyocides (generic killers that kill both target and non-target common (Moses 1980, Udolisa & Lebo 1986) albeit prohibited. Such practices in addition to the targeting of migratory breeding populations may impair recruitment, leading to continual annual decline in productivity. C. gariepinus along with twenty five other fish species of the Cross River are heavily fished (King 1996), but surprisingly no stock assessment study on any of these species is available. There is an urgent need for the regular stock assessment of these depleted species to provide fisheries managers and government agencies with sufficient information on which to base protection policies. This study which is part of a more comprehensive study on the ecology of Mid-Cross River was undertaken to evaluate the current level of exploitation of the highly prized catfish, C. gariepinus in the Mid-Cross.
Materials and methods
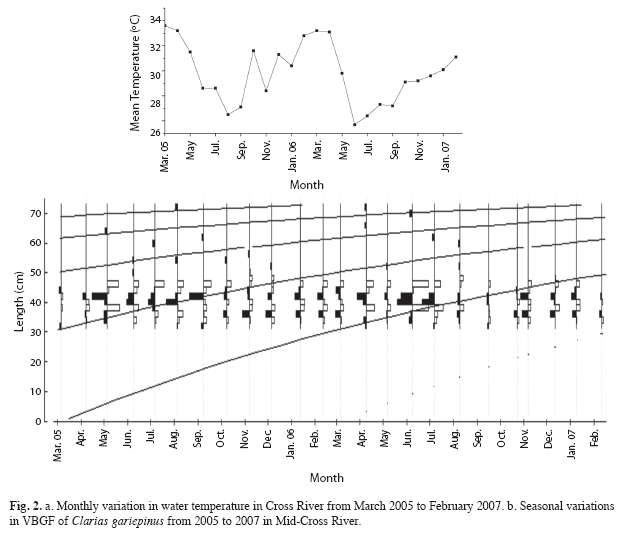
The study area is Mid-Cross River and the entire Cross River system lies approximately between longitude 3°30’ E and 10o00’ E and latitude 4° N and 8° N. The river basin covers an area of 54 000km² with 14 000km² in Cameroon and 39 500km² in Nigeria. In the middle section of the river there are numerous small shallow lakes that include Lakes Ehoma, Iyieke, Bob Erie and Ibini. These lakes are found mainly between Obubra and Ikot Okpora where they are arranged roughly in a straight line West of longitude 8° E and appear to mark the abandoned bed of the Cross River. Detailed information on the limnology, fisheries and geology of the river are available in previous studies (Moses 1979, Lowenberg & Kunzel 1992, King 1996, Okogwu 2008), nevertheless, surface water temperature was taken in the sites during each monthly collection using a Hanna digital thermometer.
Annually, during the onset of the rainy season, some catfishes and tilapia migrate to these lakes to spawn, and fishing activities are undertaken by local people using different methods. This study only considered the fishing activity developed with gillnets, and fishers normally laid their nets from 18.00hr to 4.00hr. Sampling was done monthly from March 2005 to February 2007, and fish samples were collected from catches at the four landing points within the Mid-Cross River: Itigidi (5°52’49.05" N, 8°01’06.45" E, elev. 112ft), Orah (5°52’40.36" N, 7°58’40.87" E, elev. 299ft), Ndibe beach (5°51’10.92" N, 7°57’43.2" E, elev. 1 18ft) and Unwanna (5°47’23.01" N, 7°57’03.75" E, elev. 1 09ft). These sites have been shown to be physico-chemically and biologically similar by earlier limnological surveys (Okogwu 2008), although the composition and the antics of the fishers differ.
Data from all landing points were pooled together by simple addition to form a month’s sample. Prior arrangement with the fishers ensured that they retain their catches untouched until the arrival of the investigator. The fishing was done solely by a fleet of gill nets of different sizes (mesh size 6-72mm). Catches of 4-8 boats were usually sampled per site, and collected fish were transported to the Applied Biology Laboratory, Ebonyi State University, where the fish were identified using the guide of Idodo-Umeh (2003). The length and weight of each individual fish were determined with the aid of a calibrated measuring board, and Orbit digital weighing balance, respectively.
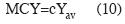
The relationship between length (TL) and weight (W) was estimated using the formula:

where Lt is length at time t, L∞-the asymptotic length, K-the growth coefficient and t0 is the species of all sizes) in the Cross River basin is hypothetical time at which length is equal to zero. The response surface analysis routine from the FISAT program provided estimates of L∞ and K; t0 was estimated by employing the equation of Pauly (1980):

The instantaneous rate of total mortality coefficient Z was estimated using the formula:
where Ni is the (initial) number of fish at time ti, Ni+1 the number of fish remaining at time ti+1 and Z the instantaneous rate of total mortality (Gayanilo & Pauly 1997). The natural mortality coefficient (M) was estimated following Pauly’s empirical formula (Pauly 1980), linking the natural mortality with the von Bertalanffy parameters, K/year, L∞ (cm) and mean annual temperature (T, °C) of water in which fish stock lives (in this case 29.8°C):

Fishing mortality coefficient (F) was calculated from the equation:

where E is the rate of exploitation and the other parameters are as in Eq. (7).
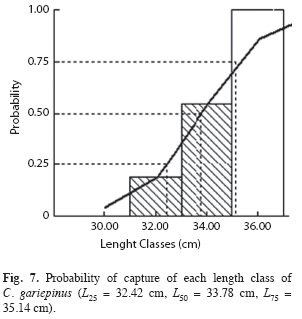
The probability of capture was estimated for gill net selectivity and the mean size at first capture (Lc) was derived by plotting the cumulative probability of capture against midlength. From the resultant curve, Lc was taken as corresponding to the cumulative probability at 50%.
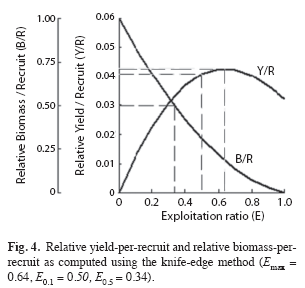
The relative yield-per-recruit model of Beverton & Holt (1964) as modified by Pauly & Soriano (1986) and incorporated in the FiSAT Programme, was used to estimate the relative yield-per-recruit and relative biomassper- recruit, assuming a knife-edge. The computed exploitation rate was compared with the expected values of Emax (the value of exploitation rate giving maximum relative yield-perrecruit), E0.1 (the value of E at which marginal increase in Y/R is10% of its value at E = 0) and E0.5 (the value of E at 50% of the unexploited relative biomass-per-recruit) (Sparre & Venema 1992, Gayanilo & Pauly1997) as reference points. The potential longevity of C. gariepinus was calculated using the formula of Pauly & Munro (1984):
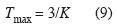
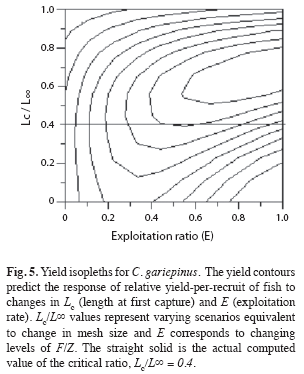
The longevity value provides an additional reference point to compare the current status of the fishery to assess whether the population is overexploited. The yield isopleths diagram was used to assess the impact on yield created by changes of exploitation rate E and the ratio of length at first capture to asymptotic length (Lc/ L∞) in relation to changes in mesh size. Maximum constant yield (MCY) is defined as "the maximum constant catch that is estimated to be sustainable" (New Zealand Ministry of Fisheries 2002). MCY represents the average catch that can be taken from a stock taking into account the natural variability inherent in the particular stock. MCY was calculated by the equation:
where c is the natural variability factor related to natural mortality (when M<0.05, c=1; when M≥0.05≤0.15, c=0.9; when M=0.16, c=0.8; when M≥0.26≤0.35, c=0.7; when M>0.35, c=0.6) and Yav is the average catch across the appropriate time series.
Resource status was evaluated by comparing estimates of the fishing mortality rate with target (Fopt) and limit (Flimit) biological reference points (BRP) which were defined as:

Results
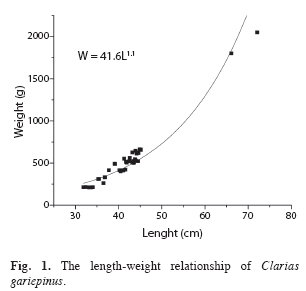
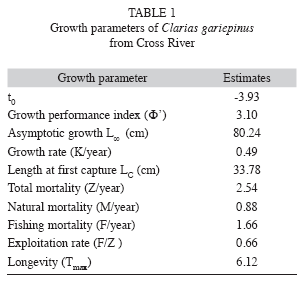
A total of 1 421 fish were collected during the two-year survey, the non-linear regression analysis of length-weight relationship (R2= 0.94, p<0.001) showed that the relationship between length (L) and weight (W) was W=41.6L1.1 (Fig. 1). The b value was significantly lower than 3 (p<0.001), which indicates allometric growth of C. gariepinus in the Cross River. The monthly variation in water temperature is shown in Fig 2a, the mean temperature was computed as 29.8 ±2.3°C and this value was used in calculating natural mortality. The result of the growth curve superimposed on the restructured length-frequency data shows that a majority of the captured fish were within the size of 30 and 45cm in total length and that the annual catch was more between May and September (Fig. 2b). The growth estimates as shown in Table 1, indicates that the value of t0 was given as -3.93 and the growth performance index (Φ) was 3.10. The asymptotic growth was 80.24cm and the growth rate (K) was 0.49/ year. The annual instantaneous rate of total mortality derived from the length converted catch curve was 2.54/year and the natural and fishing mortality estimated using eq. (6) and (7) respectively were 0.88 and 1.66/year (Fig. 3). The annual instantaneous fishing mortality rate was higher than the biological reference points derived from the Patterson (1992) equation (Fopt = 0.83 and Flimit = 1.11), suggesting that C. gariepinus was over exploited in the Cross River. Exploitation rate was calculated as 0.66 from eq. (8) and the life span of C. gariepinus in its natural habitat (potential longevity) was computed as 6.12 years from eq. (9).
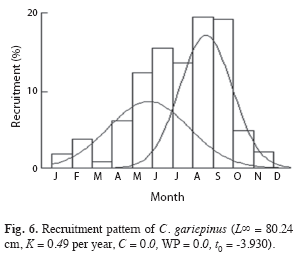
The Beverton-Holt relative yield per recruit estimated using the knife-edge method is given in Fig. 4, the optimum exploitation rates were estimated as; Emax = 0.64, E10 = 0.50 and E50 = 0.34. The yield isopleths are shown in Fig. 5, the yield contours predict the response of relative yield-per-recruit of the fish to changes in Lc (length at first capture) and E (exploitation rate); Lc/L∞ = 0.44. Lc/L∞ values represent different scenarios equivalent to changes in mesh size. E corresponds to changing levels of F/Z. The recruitment pattern (Fig. 6) shows double annual peak recruitment per year, the first peak (June) is probably due to peak recruitment in migrant breeding stock while the August peak may be associated with the recruitment of juveniles bred the previous year into the adult stock. The length at first capture was 33.74cm (Fig. 7) and the MCY was estimated as 2.637t.
Discussion
The estimated b value by the non-linear regression analysis of the length-weight relationship was significantly below three, which shows that the fish exhibits allometric growth pattern. The b value could be an indicator of the physiological condition of the fish and vary seasonally in response to seasonal variations in environmental condition and changes in the fish wellbeing (Biswas 1993). The lengthweight relationship and the b value can also be influenced by fishing pressure that excessively crop the adults, under unstressed condition, the length-weight relationship of this species may differ from that recorded in this study.
The population structure of C. gariepinus in the Cross River indicates that over 80% of the catch was between 39 and 46cm of length. For a fish that grows up to 170cm under ideal conditions (Idodo-Umeh 2003), this is an indication of over exploitation. The paucity of adult fishes may be due to fishers reducing the mesh sizes of their nets in order to maintain the catch of the depleted stock at the commercial level, this situation usually results in the cropping of juvenile fishes. This finding is consistent with what has been reported for highly exploited fish species (Ama-Abasi et al. 2004). The L∞ (80.24cm), K (0.49/year) and Φ’ (3.10) recorded in this study could not be compared with previous studies on C. gariepinus as none was found. However, these values could be invaluable to future researchers that may seek to compare their data to an earlier study. The Φ’ tends to show little variation between stocks of the same species and serves as an indicator of the reliability or otherwise of the estimated growth parameters (Ama-Abasi et al. 2004). On the suitability of the length-frequency data for the estimation of growth in C. gariepinus, there are a number of criteria used to assess this. First, the modal groups should be discernible from raw data (Wolff 1989) with obvious shifts in the modal length over time (Pauly 1984). Secondly, Pauly (1984) proposed that data collected over a period of six months and above is suitable while Gulland & Rosenberg (1992) and Hoeing et al. (1987) suggested that samples of between 1 000 and 1 500 collected between 12 and 14 months are sufficient. The data used in this study meet these criteria as 1 421 individuals were collected during a period of 24 months. The estimated instantaneous rate of mortality and exploitation rate for C. gariepinus was very high. Using the Powell- Wetheral plot, a Z/K ratio≈2 indicates over exploitation (Etim et al. 1999), in this study, the Z/K ratio was 5.1 which attest to the gross over exploitation of the species. The reason for the over exploitation of C. gariepinus is not far from the fact that this species is highly prized as it is used exclusively for some elite ceremonies by the indigenous communities. As the stock declined, the fishers tend to reduce the mesh size of nets as well as double their efforts, and also utilize more efficient gears that are not size selective (eg. purse seine and beach seine), and Njiru et al. (2004) made similar observation in Lake Victoria. Recent evidence (Okogwu 2008) has shown that some fishermen now fish regularly in the floodplain lakes (some of which are reserved lakes), such activities and the targeting of migrant stocks on their way to spawning sites in floodplain lakes will undoubtedly lead to decline in productivity and will imperil recruitment.
Age at zero length (t0) was calculated as -3.93, with negative t0 values, juveniles grow more quickly than the predicted growth curve for adults, and with positive t0 values, juveniles grow more slowly (King 1997). Reports by Okogwu & Ugwumba (2009) and Okogwu (2010) showed that spawning of the C. gariepinus in Ehoma and Iyieke Lakes synchronized with peak phytoplankton and zooplankton biomass. Such high food abundance will ensure accelerated growth rate of the juveniles. As they recruit into adult stock in the river, where food is limited in supply and competition for food intense, there is the tendency that growth may slow down. With a maximum year of 6.12 years, C. gariepinus lives a relatively short life, and this is due to intense fishing pressure. The M/K (1.7) estimated in this study lies within the range 1.5 and 2.5 proposed by Beverton & Holt (1959).
The estimated exploitation rate was 0.66, which is higher than the predicted maximum exploitation rate (Emax) of 0.64 which further lend credence to the fact that C. gariepinus is under sever fishing pressure in the Cross Riverfloodplain. Comparing the yield isopleths diagram in this study with that of Pauly & Soriano (1986), the Lc/L∞ of 0.4 and exploitation rate of 0.66 falls within quadrant D which implies that the smaller fish are caught at higher effort level. The double recruitment peaks per year obtained here conform to the assertion of Pauly (1982) that double recruitment pulses per year are nearly a general feature of tropical fish species, however, in this case it is assumed that the first and second peaks may relate to juveniles and migrant spawners recruitment during the early and late floods, respectively. This implies that flood, which is a prerequisite for adult migration to the floodplains to spawn also cue the juveniles to recruit into adult stock. Meaning that besides fishing impact, factors (such as climate change and dam construction), that could alter the intensity and timing of flooding in Cross River floodplain ecosystem, may inadvertently affect the productivity of C. gariepinus.
Acknowledgment
The assistance of O.A. Ugwumba in editing this manuscript and SIL in funding this study thorough the Tonolli grant is acknowledged. F.I Okogwu’s help in measuring length and weight of the fish is also acknowledged.
References
Ama-Abasi, D., S. Holzloehner & U. Enin. 2004. The dynamics of the exploited population of Ethmalosa fimbriata (Bowdich, 1825, Clupeidae) in the Cross River Estuary and adjacent Gulf of Guinea. Fish. Res. 68: 225-235. [ Links ]
Beverton, R.J.H. & S.J. Holt. 1959. A review of life-spans and maturity rates of fish in nature and their relation to growth and other physiological characteristics, p. 142-180. In G.E.W. Wolstenholme & M. O’Connor. CIBA Foundation Colloquium on Ageing. [ Links ]
Beverton, R.J.H. & S.J. Holt. 1964. Tables of yield functions for fishery assessment. FAO Fish. Tech. Pap. No. 38. Rome, Italy. [ Links ]
BISWAS, S.P. 1993. Manual of methods in fish biology. South Asia, New Delhi, India. [ Links ]
Etim, L., P.E. Lebo & R.P. King. 1999. The dynamics of an exploited population of a Siluroid catfish (Schilbe intermidius, Reupell 1832) in the Cross River, Nigeria. Fish. Res. 40: 295-307. [ Links ]
Gayanilo, F.C. & D. Pauly. 1997. FAO-ICLARM Stock Assessment Tools (FiSAT). FAO, Rome, Italy. [ Links ]
Gulland, J.A. & A.A. Rosenberg. 1992. A review of lengthbased approaches to assessing fish stocks. FAO Fish. Tech. Pap. No. 323. Rome, Italy. [ Links ]
Hoenig, J.M., J. Csirke, M.J. Sanders, A. Abella, M.G. Andreoli, D. Lev, S. Ragonese, M. Al-Shoushani & M.M. El-Musa. 1987. Data acquisition for lengthbased stock assessment report of working group 1, p. 343-352. In D. Pauly & G.R Morgans. ICLARM Conference proceedings on length-based methods in fisheries research. Manila, Philippines. [ Links ]
Idodo-Umeh, G. 2003. Freshwater fishes of Nigeria (Taxonomy, ecology notes, diet and utilization). Idodo Umeh, Benin, Nigeria. [ Links ]
King, M. 2007. Fisheries biology, assessment and management. Blackwell, Australia. [ Links ]
King, R.P.L. 1996. Biodiversity of freshwater fishes of the Cross River in the rainforest belt of Cameroon-Nigeria, p.184-197. In Proceedings of the International Workshop on the Rain Forest of southeastern Nigeria and southeastern Cameroon. Obudu: CRNP (Okwangwo Project)/World Wildlife Fund. Lagos, Nigeria. [ Links ]
King, R.P.L. 1997. The waters and fishes of Okwangwo Division, Cross River National Park, Nigeria. Research Project No. 1. Cross River National Park, Okwangwo Division. Museum for the Republic of Cameroon. WWF Report No. 3206/A8: 1. [ Links ]
Loewenberg, U. & T. Kunzel. 1992. Investigations on the hydrology of the lower Cross River, Nigeria. Ani. Res. Dev. 35: 302- 334. [ Links ]
Moses, B.S. 1979. The Cross River; its ecology and fisheries, p. 355-370. In B.S. Moses. Proceedings of the international conference on Kainji Lake and River Basin Development in Africa New Bussa, Niger, Nigeria. [ Links ]
Moses, B.S. 1980. Fisheries of Cross River State of Nigeria: A preliminary report. Fisheries Division, Ministry of Agriculture and Natural Resources, Calabar, Nigeria. [ Links ]
New Zealand Ministry of Fisheries. 2002. New Zealand. (Downloaded: March 25, 2011, http://www.fish.govt.nz/sustainability/research.stock/1999-2000/guide). [ Links ]
Njiru, M., P. Nzungi, A. Getabu, E. Wakwabi, A. Othina, T. Jembe & S. Wekesa. 2004. Are fisheries management measures in Lake Victoria successful? The case of Nile perch and Nile tilapia fishery. Afr. J. Ecol. 45: 315-323. [ Links ]
Okogwu, O.I. 2010. Seasonal variations of species composition and abundance of zooplankton in Ehoma Lake, a floodplain lake in Nigeria. Rev. Biol. Trop. 58: 171-182. [ Links ]
Okogwu, O.I. & A.O. Ugwumba. 2009. Cyanobacteria abundance and its relationship to water quality in the Mid-Cross River floodplain, Nigeria. Rev. Biol. Trop. 57: 33-43. [ Links ]
Okogwu, O.I., C.D. Nwani & O.A. Ugwumba. 2009. Seasonal variations in the abundance and biomass of microcrustaceans in relation to environmental variables in two shallow tropical lakes within Cross River floodplain, Nigeria. Act. Zool. Lit. 19: 205-215. [ Links ]
Okogwu, O.I. 2008. The physicochemistry, plankton and ichthyofauna of Mid-Cross River-floodplain ecosystem, Southeast, Nigeria. Ph.D. Thesis, University of Ibadan, Nigeria. [ Links ]
Patterson, K. 1992. Fisheries for small pelagic species: an empirical approach to management targets. Rev. Fish Biol. Fish. 2: 321-338. [ Links ]
Pauly, D. 1980. On the interrelationship between natural mortality, growth parameters and mean environmental temperature in 175 fish stocks. J. Cons. Int. Expl. Mer. 39: 175-179. [ Links ]
Pauly, D. 1982. Studying single-species dynamics in tropical multi-species context, p. 33-40. In D. Pauly & G.I Murphy. ICLARM Conference proceedings on theory and management of tropical fisheries. Rome, Italy. [ Links ]
Pauly, D. 1984. Length-converted catch curves: a powerful tool for fisheries research in the tropics. Part 2. Fishbyte 32: 17-19. [ Links ]
Pauly, D. & J.L. Munro. 1984. Once more on the comparison of growth in fish and invertebrates. ICLARM Fishbyte 2: 21. [ Links ]
Pauly, D. & M.L. Soriano. 1986. Some practical extension to the Beverton and Holt’s relative yield-per-recruit model, p. 491-496. In J.L. MacLean, L.B. Dizon & L.V. Hosillo. The First Asian Fisheries Forum. Asian Fisheries Society, Manila, Philippines. [ Links ]
Sparre, P. & S.C. Venema. 1992. Introduction to tropical fish stock assessment. Part 1. Manual. FAO Fish. Tech. Pap. No. 306.1 Rev 1 FAO, Rome, Italy. [ Links ]
Sparre, P. & S.C Venema. 1998. Introduction to tropical fish stock assessment. Part 1 manual, FAO Fish. Tech. Pap. 306. [ Links ]
Udolisa, R.E. & P.E. Lebo. 1986. Chemical narcosing of fish of northern Cross River, p. 105-107. In Proceedings of the 3rd Annual conference of the Fisheries Society of Nigeria (FISON). Niger, Nigeria. [ Links ]
Wolff, M. 1989. A proposed method for standardization of the selection of class intervals for length-frequency analysis. Fishbyte 7: 5. [ Links ]
Correspondencia a: Okechukwu Idumah Okogwu. Applied Biology Department, Ebonyi State University, PMB 53, Abakaliki, Ebonyi State, Nigeria; okeyokogwu@yahoo.com
Received 03-IX-2010. Corrected 26-II-2011. Accepted 31-III-2011.

