


 Inglés (pdf)
 Articulo en XML
 Referencias del artículo
 Enviar articulo por email
 Citado por SciELO
  Similares en
SciELO
Similares en
SciELO  uBio
uBio 
 Permalink
Revista de Biología Tropical
versión On-line ISSN 0034-7744versión impresa ISSN 0034-7744
Rev. biol. trop vol.59 no.3 San José sep. 2011
Population density of Sotalia guianensis (Cetacea: Delphinidae) in the Cananéia region, Southeastern Brazil
Liisa Havukainen1,2, Emygdio Leite de Araujo Monteiro Filho1,3 & Gislaine de Fatima Filla1
1. Instituto de Pesquisas Cananéia, IPeC, R. Tristão Lobo 199, CEP 11990-000, Cananéia, São Paulo, Brazil; www.ipecpesquisas.org.br, gica_filla@yahoo.com.br
2. Universidade de Mogi das Cruzes, UMC, Av. Dr. Cândido Xavier de Almeida Souza 200, CEP 08780-210, Mogi das Cruzes, São Paulo, Brazil; liisabio@yahoo.com.br
3. Departamento de Zoologia, Universidade Federal do Paraná, UFPR, Setor de Ciências Biológicas, Departamento de Zoologia, Caixa Postal 19020, CEP 81531-980, Curitiba, Paraná, Brazil; elamf@ufpr.br
Dirección para correspondencia
Abstract
Population density in cetaceans can be estimated through photo-identification, mark-recapture, land-based observations and visual estimative. We the aim to contribute with conservation strategies, we used line transects (distance method) to estimate the population density of the river dolphin, S. guianensis, in the estuarine region of Cananéia, Southeastern Brazil. The study, developed from May 2003 until April 2004, during dry and rainy seasons and different times of the day, included a sampling area divided into three sectors according to their proximity to the open sea: Sector I (the closest to the open sea); Sector II (with a large flow of fresh water and a salient declivity); and Sector III (with a large flow of fresh water and non salient declivity). Onboard random sampling was carried out in all three sectors, and dolphins seen from the bow to 90° on both port and starboard sides, were registered along with their position and distance from the boat. The total density found was 12.41ind/km² (CV=25.53%) with an average of 2.2 individuals per group for both periods of the day, morning and afternoon. Densities also varied between dry and rainy seasons, being lower in the first with 5.77ind/km² (CV=27.87%) than in the second 20.28ind/km² (CV=31.95%), respectively. Regarding the three sectors, a non-causal heterogeneous distribution was found: Sector I was the most populated (D=33.10ind/km², CV=13.34%), followed by Sector II (D=7.8ind/km², CV=21.07%) and Sector III (D=3.04ind/km², CV=34.04%). The aforementioned area, due to its proximity to the open sea, has the highest salinity level and therefore has the greatest chance of holding most of the marine fish schools which can be cornered by dolphins on high declivity areas during fishing activities. This suggests that food availability may be the most important factor on the river dolphin’s distribution in the estuary. Similar studies will contribute to a better understanding of these populations and are essential for future conservation strategies. Rev. Biol. Trop. 59 (3): 1275-1284. Epub 2011 September 01.
Key words: population density, line transects, dolphins, Cananéia estuary, conservation.
Resumen
El delfín estuarino S. guianensis, habita en aguas tropicales costeras y estuarinas. A pesar de su amplia distribución no se conoce suficiente, por lo tanto, recientemente se han intensificado sus estudios poblacionales. Transectos de línea (Método Distancia) fueron utilizados para estimar la densidad de población de S. guianensis en la Bahía Trapandé, región de estuario de Cananéia, Sudeste de Brasil. El muestreo aleatorio se realizó en tres sectores de la bahía desde mayo 2003 hasta abril 2004. La densidad total fue de 12.41ind/km2. Considerando los tres sectores de forma individual, se observó una distribución heterogénea no ocasional: Sector I (más cerca del mar abierto) D=33.10ind/km2; Sector II (que recibe un gran flujo de agua dulce, con un declive más destacado) D=7.80ind/km2; Sector III (que recibe un gran flujo de agua dulce, sin declives salientes) D=3.04ind/km2. Las condiciones ambientales como la estación de lluvias y la estacionalidad diaria, también se observaron en esta bahía. Los resultados mostraron un uso heterogéneo de la zona por los delfines.
Palabras clave: densidad de población, transectos en línea, delfines, estuario Cananéia, conservación.
The estuarine dolphin, S. guianensis, inhabits tropical coastal and estuarine waters (Carvalho 1963). In the Western Atlantic Ocean the species can be found as far South as off the coast of Florianópolis in Southern Brazil to as far north as Honduras. Despite its large distribution, in 2001 the genus Sotalia, which also includes the species Sotalia fluviatilis, was classified as insufficiently known by the Action Plan for Aquatic Mammals of Brazil (IBAMA 2001) and cetacean population surveys have been intensified recently (Bonin et al. 2008).
Several methods have been used to estimate cetacean population densities. These methods include mark-recapture, land-based observations and quadrat and transect sampling (Odum 1988, Bonin et al. 2008). In order to avoid overestimations, large areas are normally divided into sub-areas and studied with similar sampling efforts and methods (Eberhardt et al. 1979, Gaskin 1982, Bonin et al. 2008). When using a transect method, the sampling is made randomly, and it also considers weather and ocean (fluvial) conditions, as well as the level of experience from the observer and the species behavior (Gaskin 1982, Bonin et al. 2008).
Previous studies on cetacean population densities have given important preliminary information from Brazilian areas: these included the species of Tursiops truncatus, commonly known as the bottlenose dolphin (Leatherwood 1979, Barham et al. 1980, Barco et al. 1999), the river dolphin, S. fluviatilis and the pink river dolphin, Inia geoffrensis (Magnusson et al. 1980, Vidal et al. 1997).
Along with distance methods, aerial surveys have also been carried out to estimate the population density of three different dolphins species (Stenella attenuata, Stenella longirostris and Delphinus delphis) during feeding activities off the Mexican and Central American coasts (Smith 1981). Aerial surveys have also been used in previous studies to analyze the movement of cetaceans off California coast (Forney & Barlow 1998) and population density of humpback whales, Megaptera novaeangliae, off the Brazilian coast between 2002 and 2005 (Andriolo et al. 2010).
For the estuarine dolphin, S. guianensis, four population density estimations are currently known. Edwards & Schnell (2001) studied the species in the Northern limit of its distribution in the Cayos Miskito Reserve, off the Atlantic coast of Nicaragua. By using strips-transects methods they found an average of 0.6ind/km², with an overall abundance of 49 individuals. The remaining three studies were carried out in Brazilian waters. Flatch et al. (2008a) found a population density of 2.79ind/km² in Sepetiba Bay, state of Rio de Janeiro. Geise et al. (1991) found a population density of 5.1ind/km² in the Guanabara Bay, also in the state of Rio de Janeiro. Geise et al. (1999) also conducted a study at the Cananéia region, state of São Paulo, and found a population density of 3.38ind/km².
This study aimed to estimate the current population density of the top predator S. guianensis in the Brazilian Cananéia region, to support and strengthen conservation efforts, since any disturbance may reflect in environmental changes in its distribution area.
Material and Methods
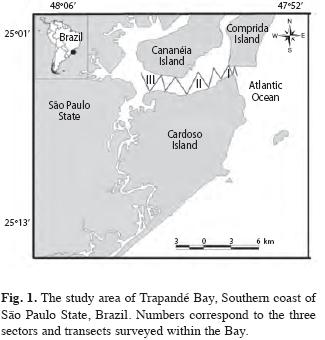
Studied Area: The study area in Cananéia Estuary Complex (Fig. 1) is located in the South São Paulo state (24º59’-25º04’ S and 47º54’-47º56’ W). The region has three islands. Cardoso Island is located within Trapandé Bay plus Cananéia and Comprida Islands which are separated by a River Channel (Schaeffer-Novelli et al. 1990).
The vegetation of all these islands consists of a large mangrove swamp with three species of mangrove: the white mangrove, Laguncularia racemosa, the black mangrove, Avicennia schaueriana and the red mangrove, Rhizophora mangle. According to Schaeffer-Novelli et al. (1990) this lagoon estuary system is one of the best preserved ecosystems in the Brazilian coast, being legally protected as a State and Federal Environmental Protected Area. Lagoon watercourses that make up the coastal Cananéia system tend to be silted, creating shallows or sandbars (Cunha-Lignon 2005).
Sampling methods: Sampling efforts were carried out once a month for ten months from May 2003 to April 2004. The area was divided into three sectors according to their proximity to open sea: Sector I has the greatest influence from the ocean and makes up the area of the Cananéia Estuary mouth, between Cardoso and Cananéia Islands; Sector II is an intermediate region between the three islands and a large flow of fresh water, and a salient declivity; while Sector III was the furthest region upstream, with the largest flow of fresh water and least salinity. Four transects were established in each Sector I and II, while five transects were established in Sector III (Fig. 1).
In each sector, transect lines of approximately the same length were used in order to cover the entire studied area. Transect lines were randomly established and did not take into account previous knowledge of where the animals were most likely to be seen. The total area of each sector and the length of each transect was calculated with a GPS. Transects were disposed in a zig-zag formation (Fig. 1) and all thirteen transects were covered each day during all ten days of sampling, meaning that each transect was covered ten times. The order in which transects were covered was randomly chosen (by lottery methods). Due to the short sighting time and the small body size of the species, training with the researcher in charge of data collection was carried out prior to sampling. The training sought to standardize radial-distances; during the training a telemeter was used to estimate steady objects. In order to calculate the angle of the dolphins to the bow, a 30cm radius protractor with an arrow was used.
During sampling, dolphins were detected with the naked-eye. The Distance method was used and all animals at both sides of the boat within less than 90 degrees to the bow were registered with their distance and angle in relation to the transect (Eberhardt et al. 1979, Buckland et al. 1993, 2001, Bonin et al. 2008). Radial-distances were visually estimated exclusively by the same researcher, a methods previously carried out by Smith (1981), Gaskin et al. (1985) for other species of small cetaceans and Geise et al. (1999) for the estuarine dolphin.
The boat was always driven by the same pilot, and maintained a low, steady speed (five knots) in order to confer a greater reliability to the data (Leatherwood 1979, Gaskin 1982, Bonin et al. 2008). The use of a whaler type boat, 10m long with inboard motors (diesel engine) was important due to its low impact on the dolphins since the noise made by outboard motors (gas engines) can interfere with the communication sounds made by dolphins and may scare them away (Rezende 2008).
During field work, the four premises of the Distance method were followed: (1) all animals on the transect must be observed; (2) all animals must be detected at their initial position, before any movement reaction to the observer; (3) all distances (radial distances and angles) must be measured correctly and (4) detections must be independent events (Buckland et al. 1993, 2001, 2004, Cullen et al. 2004, Bonin et al. 2008).
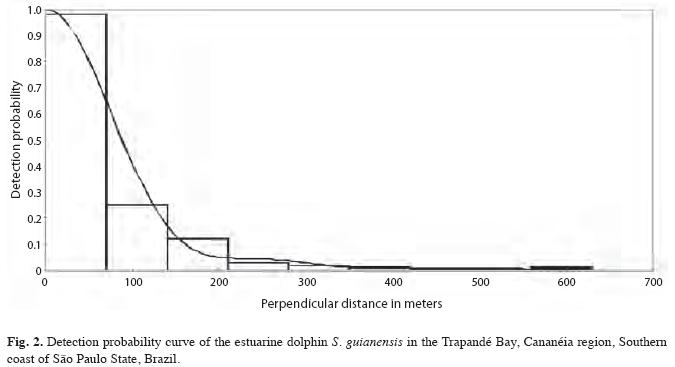
The overall data was analyzed with the software “Distance 3.5 version six” (Thomas et al. 1998). At first, three potential functions of detection were considered: uniform, half-normal and hazard-rate, together with various adjustments. Other variables such as season, methods (with or without binoculars), Beaufort sea scale, observer and models were added to the analysis and compared with the likelihood-ratio tests and Akaike Information Criteria (AIC), and those that adjusted better to each group of data were used (Thomas et al. 1998). Analyses were carried out globally and by sector. Analysis for different seasons and periods of the day were also carried out but, in order to summarize the results, only the probability detection curve for global data is presented in this study.
In order to eliminate outliers we truncated the distributions of perpendicular ranges at 600m (Buckland et al. 2001). This measure resulted in the exclusion of 6% of all observations.
Abundance was calculated with the Horvitz-Thompson estimator, as described in Marques & Buckland (2003).
Being the present study done with aquatic mammals, the probability of seeing them on transect line (g(0)) may not be 100% certain. In order to minimize this potential underestimation it was assumed that (g(0) ) was equal to one, because S. guianensis emerges at short intervals to breathe, which exposes them during sampling periods. Moreover, the area is an estuary, small and protected, which makes it easier to detect the animals.
Seasonality: The present study estimates the dolphin’s population density for the entire year and also the relative density for rainy and dry seasons. The dry season is considered to be from April to September with a pluvial index of 125mm/month in average. The rainy seasons is considered to be from October to March, when the pluvial index rises to 212mm/month (CIIA-GRO 2008).
Periods of the day: The authors also calculated the density related to different periods of the day: the morning (between 06:00h and 11:59h) and afternoon (from 12:00h to 18:30h). All the analyses were done separately for each sector of the bay.
Groups: The present study used the same classification for “groups” as the one adopted by Monteiro-Filho (2000). According to this author, one or two adults in the company of a calf is considered to be a family (whether related or not); this type of group is the most common in the region. Groups of more than four individuals who meet for a certain purpose (displacement, cooperative feeding, among other) are considered to be schools. Isolated individuals can also be observed in the region, but those are likely to soon join others and form one of the social groups described above.
Results
Between May 2003 and April 2004, 540km were sampled at a constant speed of five knots in good sea conditions (Beaufort scale 0-2). On board sampling over transects totaled 54 hours and other 102 hours of field work were carried out. A total of 908 individuals were recorded in 461 different groups.
Population density: The total density of individuals found in the Cananéia region was 12.41ind/km2 (CV=25.53%). Density of groups in the studied area was 5.77groups/km2 (CV=25.31%) while the abundance for the entire study area were 195 individuals (CV=25.53%). The number of individuals per square kilometer varied between sectors: Sec-tor I D=33.1ind/km2 (CV=13.34%); Sector II D=7.8ind/km2 (CV=21.97%) and Sector III D=3.04ind/km2 (CV=34.04%).
The Half Normal model with Cosine adjustments was used as an estimator. According to the premise of the method, the probability of detection becomes lower as perpendicular distance from the track line increases and makes it possible to graphically represent the possibility of detection for the whole sampled region as showed in Fig. 2.
Seasonality: During the dry season 253 groups were registered with a total of 474 individuals. Density of individual was 5.77ind/km2 (CV=27.87%) while the density of groups was 2.94groups/km2 (CV=27.46%). Total abundance found for the dry season was 91 individuals (CV=27.87%). During the rainy season 208 groups were registered with a total of 434 individuals. Density of individuals increased to 20.28ind/km2 (CV=31.95%) as well as the density of groups, which rose to 8.84groups/km2 (CV=31.57%). Total abundance for the rainy season was also greater, totalizing 319 individuals (CV=31.95%). Densities for each season and sectors are shown in Table 1. Again the estimator Half Normal/Cosine was used.
Periods of the day: Density varied between different periods of the day. During the morning 156 groups were registered with a total of 297 individuals. Density of individuals was equal to 7.29ind/km2 (CV=29.63%) while the density of groups was 3.29groups/km2 (CV=28.88%). Total abundance during the morning was 115 individuals (CV=29.63%). During the afternoon 305 groups were registered with a total of 611 individuals. Density of individuals was 13.83ind/km2 (CV=30.19%), density of groups 6.57 groups/km2 (CV=29.92%) and the total abundance was 217 individuals (CV=30.19%).
As shown in Table 2, the dolphins occupation of the studied area was uneven at different times of the day. Density was greater in Sector I during the morning hours while in it was greater in Sector II during the afternoon. The estimator that best suited morning analyses was the Half-normal/Hermite while the Uniform/Cosine was used for analyses of data collected during the afternoon.
Groups: The average size of the groups was 2.2ind/group. The animals were most likely to be seen alone, in pairs or a trio. However, groups composed of more than four individuals were also recorded. The largest group registered was formed by 12 individuals. The average number of individuals per group differed between each sector (Sector I had an average of 2.1ind/group; Sector II 2.4ind/group; and Sector III 2.1ind/group) and between the two seasons (the dry season had 1.9ind/group while the rainy season had 2.4ind/group). The number of individuals per group was equal for different periods of the day (2.2ind/group).
Discussion
Most of the estuarine dolphins sampled in the Cananéia region of Southeastern Brazil were found in small groups, with an average size of 2.2ind/group. Similar group sizes have been reported by other authors in similar studies. Geise et al. (1999) found that in the same area groups were commonly of two and five individuals, specifically. Pairs made up 30% of the total groups. Monteiro-Filho (2000) states that families are the most common group type found. The Cananéia region represents an area of high density of the estuarine dolphin, being one of the places in Brazil where the dolphins are most likely to be seen. In Guanabara Bay (state of Rio de Janeiro) the average group size was 2ind/km² (Geise 1991). Azevedo et al. (2005) reported group sizes varying from one to 40 individuals and commonly found in group sizes ranging from two to 20 individuals. Average group sizes reported in ParatyBay and Sepetiba Bay (state of Rio de Janeiro) were 32.4 individuals (Lodi 2003) and 30.2 individuals (Flach et al. 2008b) respectively. According to Araújo & Azevedo (2001), those bays share the same fish assemblages that form large schools and make them distinct from other estuaries and bays. This may explain the differences regarding group sizes.
In the South of Brazil, Filla & Monteiro-Filho (2009) found an average group size of 2.13ind/km² and 2.9ind/km² in the Guaratuba and Paranaguá Bays (state of Paraná), respectively. Also in the Paranaguá Bay, Santos et al. (2010) registered group sizes ranging from two to 90 individuals. In the Baía Norte (state of Santa Catarina) the average size found was much larger: 29ind/km² (Daura-Jorge et al. 2005).
In Nicaragua, Edwards & Schnell (2001) registered group sizes ranging from two to 15 individuals. According to those authors, the group sizes varied with activity patterns. The average size group documented was 3ind/km².
All these studies were done in protected regions with shallow bays, little current and wave action and a low predation rate.
Lodi & Hetzel (1998) documented exceptional group sizes in the Ilha Grande Bay (state of Rio de Janeiro). The authors registered group sizes that ranged from three to 450 individuals, representing the greatest association ever recorded for the species.
The results found in Cananéia regarding population density can be considered high when compared to other studies carried out with the same species (Geise et al. 1999, Edwards & Schnell 2001, Flach et al. 2008a). This could be a result of the premise adopted in the study that the closer the animals are to transects, the greater the estimated density. On the other hand, this could also prove that the extrapolation of data for an area may lead to overestimations. This second possibility was evident when analyses were done separately for each sampled sector because the results indicated that the animals used the studied area heterogeneously, with a much larger use of certain localities in detriment of other. This uneven use can be explained by heterogeneity found in the environment itself and that the dimension of area and movements within such area are determined by the mosaic distribution of available resources, especially food resources (Defran et al. 1999, Oliveira et al. 2008).
Sector I was the one most used by the dolphins. In this sector, salinity is greater than in the others sectors and is considered to be constant throughout the year. This means that there is the possibility of a higher concentration of marine fish species, one of their main food items (see Oliveira et al. 2008), which would explain the permanence of the dolphins in this area, including during the night (Atem & Monteiro-Filho 2006). Moreover, this region has salient and steep sloping beaches, which are used by the dolphins as part of their fishing strategy. The dolphins corral the fish against the steep walls, reducing their escape route and thus disorganizing the school (Monteiro-Filho 2008). In the study carried out in Nicaragua, estuarine dolphin densities were also more common in coastal areas, followed by areas where the sea meets lagoons and finally by the lagoons with much lower salinity (Edwards & Schnell 2001). Flach et al. (2008a) also observed more sightings and a higher encounter rate with estuarine dolphin at the entrance of Sepetiba Bay, in comparison to its interior. Additionally, Sector I has areas of steep sloping beaches: a topography that facilitates the dolphins feeding strategies as it reduces prey escape routes (Monteiro-Filho 2008), as aforementioned. Heterogeneity found on thebottom of distribution areas has also been considered to be a key determinant in the habitat of delphinids (Hui 1979) as it provides benthic prey habitat and enhances prey aggregation and thus attracts dolphins. Considering that the species carries out feeding activities during the day and night, it is possible that periods of greater density are related to the prey dynamics according to the tide movements. If this is true, there may be a second peak of high density occurring during the night (Atem & Monteiro-Filho 2006). Unfortunately, sampling is still not possible in the absence of light.
The population density of the same region found in the present study was greater during the rainy season, as published by Geise et al. (1999). Similar results were also found in Paraty Bay (Lodi & Hetzel 1998, Lodi 2003). Santos et al. (2010) report that the largest groups of S. guianensis in the protected areas of Paranaguá Estuarine Complex (state of Paraná) occurred due to the local topography, lower predation risk, seasonal distribution and prey abundance. The seasonal variance may be related to changes in the abundance and distribution of the prey, which appears to be strongly influenced by the seasons (Lodi 2003). This is also related to the peak of calf births (Rosas & Monteiro-Filho 2002).
Differences regarding the period of the day were also noted in this study. In general, the dolphins density was much greater during the afternoon, as previously registered by Geise et al. (1999). Sectors also proved density differences. More individuals were found in Sector I and II during the morning, as opposed to what was found in Sector III, which had a greater density during the afternoon. A logical explanation is the dolphins movement between sectors.
Finally, the present study provides evidence that estuarine dolphins use the Cananéia region heterogeneously, having a major use in certain localities within the area. Regardless of this variation, the estuary has the highest dolphin density for this species and highlights the need for conservation strategies to protect this southeastern Brazilian bay.
Acknowledgments
We specially thank the boatman, Clovis Ribeiro Xavier Júnior. Also the Instituto de Pesquisas Cananéia (IPeC) and the Universidade de Mogi das Cruzes (UMC), Roberto Fusco Costa, Luciana Leite; and financial support from the Conselho Nacional de Desenvolvimento Científico e Tecnológico (CNPq).
References
Andriolo, A., P.G. Kinas, M.H. Engel, C.C.A. Martins & A.M. Rufino. 2010. Humpback whales within the brasilian breeding ground: distribuition and population size estimate. Endang. Spec. Res. 11: 233-243. [ Links ]
Araújo, F.G. & M.C.C. De Azevedo. 2001. Assemblages of Southeast-South Brazilian coastal systems based on distribution of fishes. Est. Coast. Shelf Sci. 52: 729-38. [ Links ]
Atem, A.C.G. & E.L.A. Monteiro-Filho. 2006. Nocturnal Activity of the Estuarine Dolphin (Sotalia guianensis) (Cetacea, Delphinidae) in the Region of Cananéia, São Paulo State, Brazil. Aqua. Mamm. 32: 236-241. [ Links ]
Azevedo, A.F., S.C. Viana, A.M. Oliveira & M.V. Sluys. 2005. Group characteristics of marine tucuxis (Sotalia fluviatilis) (Cetacea: Delphinidae) in Guanabara Bay, southeastern Brazil. J. Mar. Biol. Ass. U.K. 85: 209-212. [ Links ]
Barco, S.G., W.M. Swingle, W.A. Mclellan, R.N. Harris & D.A. Pabst. 1999. Local abundance and distribution of bottlenose dolphin (Tursiops truncatus) in the nearshore waters of Virginia Beach, Virginia. Mar. Mamm. Sci. 15: 394-408. [ Links ]
Barham, E.G., C.J. Sweenecy, S. Leatherwood, R.K. Beegs & C.L. Barham. 1980. Aerial census of the bottlenose dolphin, Tursiops truncatus, in a region of the Texas coast. Fish. Bull. 77: 585-595. [ Links ]
Bonin, C.A., G.F. Filla, L.V. De Oliveira & E.L.A. Monteiro-Filho. 2008. Densidade populacional: métodos e implicações, p. 177-192. In E.L.A. Monteiro-Filho & K.D.A. Monteiro. Biologia, ecologia e conservação do boto-cinza. Páginas & Letras, São Paulo, São Paulo, Brasil. [ Links ]
Buckland, S.T., D.R. Anderson, K.P. Burnham & J.L. Laake. 1993. Distance Sampling– Estimating abundance of biological populations. Champman & Hall, London, United Kingdom. [ Links ]
Buckland, S.T., D.R. Anderson, K.P. Burnham, J.L. Laake, D.L. Borchers & L. Thomas. 2001. Introduction to distance sampling. Oxford University, NewYork, New York, USA. [ Links ]
Buckland, S.T., D.R. Anderson, K.P. Burnham, J.L. Laake, D.L. Borchers & L. Thomas. 2004. Advanced distance sampling. Estimating abundance of biological populations. Oxford University, NewYork, New York, USA. [ Links ]
Carvalho, C.T. 1963. Sobre um boto comum no litoral do Brasil (CETACEA, DELPHINIDAE), Rio de Janeiro. Ver. Bras. Biol. 23: 263-276. [ Links ]
CIIAGRO. 2008. Centro Integrado de Informações Agrometeorológicas. São Paulo, São Paulo, Brasil. (Downloaded: February 2008, www.ciiagro.sp.gov.br). [ Links ]
Cullen, L.J.R., R. Rudran & C. Valladares-Padua. 2004. Transectos lineares na estimativa de densidade de mamíferos e aves de médio e grande porte, p. 169-179. In L. Cullen & R. Rudran. Métodos de estudos em biologia da conservação & manejo da vida silvestre. Editora da Universidade do Paraná, Curitiba, Paraná, Brasil. [ Links ]
Cunha-Lignon, M. 2005. Ecologia de manguezais: desenvolvimento espaço temporal no sistema costeiro Cananéia-Iguape, São Paulo, Brasil. Ph.D. Thesis, Universidade de São Paulo– Instituto Oceanográfico, São Paulo, Brasil. [ Links ]
Daura-Jorge, F.G., L.L. Wedekin, V.Q. Piacentini & P.C. Simões-Lopes. 2005. Seasonal and daily patterns of group size, cohesion and activity of the estuarine dolphin, Sotalia guianensis (P.J. Van Bénéden, 1864) (Cetacea, Delphinidae) in southern Brazil. Rev. Bras. Zoo. 22: 1014-1021. [ Links ]
Defran, R.H., D.W. Weller, D.L. Kelly & M.A. Espinosa. 1999. Range characteristics of pacific bottlenose dolphins (Tursiops truncatus) in the Southern California Bight. Mar. Mamm. Sci. 15: 381-393. [ Links ]
Eberhardt, L.L., D.G. Chapman & J.R. Gilbert. 1979. A review of marine census methods. Wildl. Monogr. 63: 6-46. [ Links ]
Edwards, H.H. & G.D. Schnell. 2001. Status and ecology of Sotalia fluviatilis in the Cayos Miskito Reserve, Nicaragua. Mar. Mamm. Sci. 17: 445-472. [ Links ]
Filla, G.F & E.L.A. Monteiro-Filho. 2009. Group structure of Sotalia guianensis in the bays on the coast of Paraná State, south of Brazil. J. Mar. Biol. Ass. 89: 985-993. [ Links ]
Flach, L., P.A. Flach & A.G. Chiarello. 2008a. Density, abundance and distribution of the guiana dolphin, (Sotalia guianensis van Benéden, 1864) in Sepetiba Bay, Southeast Brazil. J. Cetacean Res. Manage. 10: 31-36. [ Links ]
Flach, L., P.A. Flach & A.G. Chiarello. 2008b. Aspects of behavioural ecology of the estuarine dolphin (Sotalia guianensis) in Sepetiba Bay, southeast Brazil. Mar. Mamm. Sci. 24: 503-15. [ Links ]
Forney, K.A. & J. Barlow. 1998. Seasonal patterns in the abundance and distribution of California cetaceans. Mar. Mamm. Sci. 14: 460-489. [ Links ]
Gaskin, D.E. 1982. The Ecology of whales and dolphins. Heinemann, London, United Kingdom. [ Links ]
Gaskin, D.E , A.J. Read, P.F. Watts & G.J.D. Smith. 1985. Population dispersal, size, and interactions of harbour porpoises in the Bay of Fundy and Gulf of Maine. Can. Tech. Rep. Fish. Aquat. Sci. 1291: l-28. [ Links ]
Geise, L. 1991. Sotalia guianensis (Cetacea, Delphinidae) population in the Guanabara Bay, Rio de Janeiro, Brazil. Mammalia 55: 371-379. [ Links ]
Geise, L., N. Gomes & R. Cerqueira. 1999. Behaviour, habitat use and population size of Sotalia fluviatilis (Gervais, 1853) (Cetacea, Delphinidae) in the Cananéia Estuary region, São Paulo, Brazil. Rev. Bras. Biol. 59: 183-194. [ Links ]
Hui, C. 1979. Undersea topography and distribution of dolphins of the genus Delphinus in the Southern California Bight. J. Mamm. 60: 521-527. [ Links ]
IBAMA (Instituto Brasileiro de Meio Ambiente e dos Recursos Naturais Renováveis). 2001. Mamíferos Aquáticos do Brasil: Plano de Ação. Brasília-DF, Goiás, Brasil. [ Links ]
Leatherwood, S. 1979. Aerial survey of the Bottlenose Dolphin, Tursiops truncatus and West Indian Manatee, Trichechus manatus, in the Indian and Banana rivers, Florida. Fish. Bull. 77: 48-59. [ Links ]
Lodi, L. 2003. Tamanho e composição de grupo dos botos-cinza, Sotalia guianensis (van Bénéden, 1864) (CETACEA, DELPHINIDAE), na Baía de Paraty, Rio de Janeiro, Brasil. Atlântica 25: 135-146. [ Links ]
Lodi, L. & B. Hetzel. 1998. Grandes agregações do botocinza (Sotalia fluviatilis) na Baía da Ilha Grande, Rio de Janeiro. Rev. Bioik. 12: 26-30. [ Links ]
Magnusson, W.E., R.C. Best & V.M.F. Da Silva. 1980. Numbers and behaviour of Amazonian dolphins, Inia geoffrensis and Sotalia fluviatilis fluviatilis, in the Rio Solimões, Brazil. Aqua. Mamm. 8: 27-31. [ Links ]
Marques, F.F. & S.T. Buckland. 2003. Incorporating covariates into standard line transect xanalyses. Biometrics 59: 924-35. [ Links ]
Monteiro-Filho, E.L.A. 2000. Group organization of the dolphin Sotalia fluviatilis guianensis in an estuary of southeastern Brazil. Ciênc. Cult. J. Braz. Ass. Adv. Sci. 52: 97-101. [ Links ]
Monteiro-Filho, E.L.A. 2008. Comportamento de pesca, p. 78-89. In E.L.A. Monteiro-Filho & K.D.A. Monteiro. Biologia, ecologia e conservação do botocinza. Páginas & Letras, São Paulo, São Paulo, Brasil. [ Links ]
Odum, E.P. 1988. Ecologia. Editora Guanabara, Rio de Janeiro, Rio de Janeiro, Brasil. [ Links ]
Oliveira, M.R., F.C.W. Rosas, P.C. Pinheiro & R.A. Santos 2008. Alimentação, p. 92-101. In E.L.A. Monteiro-Filho & K.D.A. Monteiro. Biologia, ecologia e conservação do boto-cinza. Páginas & Letras, São Paulo, São Paulo, Brasil. [ Links ]
Rezende, F. 2008. Alterações acústico-comportamentais, p. 165-176. In E.L.A. Monteiro-Filho & K.D.A. Monteiro. Biologia, ecologia e conservação do boto-cinza. Páginas & Letras, São Paulo, São Paulo, Brasil. [ Links ]
Rosas, F.C.W. & E.L.A. Monteiro-Filho. 2002. Reproduction of the estuarine dolphin (Sotalia guianensis) on the coast of Paraná, southern Brazil. J. Mamm. 83: 507-515. [ Links ]
Santos, M.C.O., J.E.F. Oshima, E.S. Pacífico & E. Silva. 2010. Group size and composition of Guiana dolphins (Sotalia guianensis) (Van Bénéden, 1864) in the Paranaguá Estuarine Complex, Brazil. Braz. J. Biol. 70: 11-120. [ Links ]
Schaeffer-Novelli, Y., H.S.L. Mesquita & G. Cintrón-Molero. 1990. Cananéia lagoon estuarine system, São Paulo, Brazil. Estuaries 13: 193-203. [ Links ]
Smith, T.D. 1981. Line transect for estimating density of porpoise schools. J. Wildt. Mngt. 45: 650-657. [ Links ]
Thomas, L., J.L. Laake, J.F. Derry, S.T. Buckland, D.L. Borchers, D.R. Anderson, K.P. Burham, S. Strindberg, S.L. Hedley, M.L. Burt, F. Marques, J.H. Pollard & R.M. Fewster. 1998. Distance 3.5 release 6. Research Unit for Wildlife Population Assessment University of St. Andrews, U.K. St. Andrews, United Kingdom. (Downloaded: January 2004, www.ruwpa.st-and.uk/distance/). [ Links ]
Vidal, O., J. Barlow, L. Hurtago, J. Torre, P. Cedón & Z. Jeda. 1997. Distribution and abundance of the Amazon River dolphin (Inia geoffrensis) and tucuxi (Sotalia fluviatilis) in the upper Amazon River. Mar. Mamm. Sci. 13: 427-445. [ Links ]
Correspondencia a: Liisa Havukainen. Instituto de Pesquisas Cananéia, IPeC, R. Tristão Lobo 199, CEP 11990-000, Cananéia, São Paulo, Brazil; www.ipecpesquisas.org.br / Universidade de Mogi das Cruzes, UMC, Av. Dr. Cândido Xavier de Almeida Souza 200, CEP 08780-210, Mogi das Cruzes, São Paulo, Brazil; liisabio@yahoo.com.br
Emygdio Leite de Araujo Monteiro Filho. Instituto de Pesquisas Cananéia, IPeC, R. Tristão Lobo 199, CEP 11990-000, Cananéia, São Paulo, Brazil; www.ipecpesquisas.org.br / Departamento de Zoologia, Universidade Federal do Paraná, UFPR, Setor de Ciências Biológicas, Departamento de Zoologia, Caixa Postal 19020, CEP 81531-980, Curitiba, Paraná, Brazil; elamf@ufpr.br
Gislaine de Fatima Filla. Instituto de Pesquisas Cananéia, IPeC, R. Tristão Lobo 199, CEP 11990-000, Cananéia, São Paulo, Brazil; www.ipecpesquisas.org.br, gica_filla@yahoo.com.br
Received 12-X-2010. Corrected 18-I-2011. Accepted 17-II-2011.

