


 Inglés (pdf)
 Articulo en XML
 Referencias del artículo
 Enviar articulo por email
 Citado por SciELO
  Similares en
SciELO
Similares en
SciELO  uBio
uBio 
 Permalink
Revista de Biología Tropical
versión On-line ISSN 0034-7744versión impresa ISSN 0034-7744
Rev. biol. trop vol.56 no.3 San José sep. 2008
Mortality rate estimation for eelgrass Zostera marina (Potamogetonaceae) using projections from Leslie matrices
Olga Flores Uzeta, Elena Solana Arellano & Héctor Echavarría Heras
Departamento de Ecología Marina, Centro de Investigación Científica y Educación Superior de Ensenada, Ensenada, Baja California México, P.O. Box 430222, San Diego, CA. 92143-0222, USA.Fax: (646) 175 05 00; oflores@cicese.mx; esolana@cicese.mx; hechavar@cicese.mx
Abstract: The main goal of this study is to provide estimations of mean mortality rate of vegetative shoots of the seagrass Zostera marina in a meadow near
Key words: matrix models, demography, Zostera marina, mortality rates.
Seagrass meadows are very important in the ecology of coastal waters (Mann 1982), but are very susceptible to both anthropogenic and climatic perturbations. This means that mortality and recruitment are going to be responsible for changes in density and shoot coverage (Olesen and Sand-Jensen 1994) and therefore the study of these processes is crucial to understand the demography of seagrasses. Since these plants are modular, with continuous branching and expansion of rhizomes (Gallegos 1995), it is reasonable to assume that recruitment is constant over time. Moreover Solana-Arellano (2004) showed through an analysis of variance, that recruitment rates for Zostera marina is constant (F=1.4, p=0.48) at our study site.
Even though seagrasses are widely distributed in temperate waters throughout the northern hemisphere (den Hartog 1970), shoots demography has not been studied is for ter restrial plants for which the general patterns of shoot density regulation via shoot natality or shoot mortality are known (Lovett 1981, Schmid and Harper 1985). Moreover demographic techniques to explore population have been applied to seagrasses only to evaluate the potential of a population in terms of den sity increments or decrements at the level of the whole meadow dynamics (Patriquin 1973, Durako and Moffler 1987, Cox and Tomlinson 1988, Duarte and Sand-Jensen 1990, Duarte et al. 1994). In addition, the use of these techniques has been restricted to only three seagrass species; Posidonia oceanica (Pergent and Pergent-Martini 1990), Thalassia testudinum (Patriquin 1973, Gallegos et al. 1993, Durako 1994) Cymodocea nodosa (Duarte and Sand-Jensen 1990, Pérez et al. 1994, Vidondo et al. 1997).
Specifically for C. nodosa, Pérez et al. (1994) gave an estimate of mean mortality rates (in logarithmic units) from the exponential reduction of shoots density grouped in consecutive annual cohorts structured by age. This relatively easy method, besides being destructive, gives no details of the mathematical assumptions necessary to obtain mortality rates for C. nodosa. On the other hand, the powerful reconstructive methods proposed by Pergent and Pergent-Martini (1990) and Duarte et al. (1994), which are non-destructive, are only suitable for long-lived seagrasses. For Z. marina, the study of Olesen and Sand-Jensen (1994) is the first work based on cohorts structured by age. They describe the relationship between growth and age of a shoot in terms of plastochrones, seasonal production, above ground biomass, and shoot density regulation through recruitment and mortality. Solana-Arellano (2004) used cohorts and the Pérez et al. (1994) method to describe the demography of a Mexican Z. marina meadow.
To study shoot demography, it is necessary to construct life history tables, defined by Ebert (1999), as the schedule of probabilities of things that may happen to individuals with particular attributes. The most general choice for attribute is age. We then projected these life tables to visualize trends in population demography, given parameters of birth and death. The projection of a life table matrix for a population was defined by Keyfitz (1972) as an assay that describes what is going to happen with the population density given certain parameters. According with Chapman (1986), life tables can be applied to plants and even marine algae if individuals can be differentiated.
The purpose of this work is to compare a series of observed mortality rates with projected rates based on only one or a few field samples. These rate estimations were obtained through the projection of the Leslie matrix life table with entries given in terms of survival and fecundity rates. A reasonable correspondence of observed and predicted rates would allow us calculate some characteristic of the population without the use of destructive samplings. Besides contributing to the knowledge of demographic strategies, our findings would justify drastically reduce the number of field samplings needed per year.
Materials and methods
Field, laboratory and statistical methods: data were generated biweekly from February 1999 to April
Data management: the mean annual Plastochrone Interval (PI) was calculated using the criteria Jacobs (1979). The PI is defined as the time interval between the initiation of two successive leaves on one shoot. For Z. marina, Jacobs (1979) introduced a formula for the calculation of the PI which consists of multiplying the total number of marked shoots by times days of exposure and dividing by the number of new leaves on marked shoots. The age of each shoot, in Plastochrone Intervals, was calculated adding the number of standing leaves plus leaf scars from shed leaves (Duarte and Sand-Jensen 1990). Monthly cohorts and the life tables were constructed using 1999 data as a preliminary analysis. Based on the result of this analysis, (see result section), we constructed three life tables: Life table I, with data gathered on April 1999 and projecting the interval of May-August 1999, Life table II, with data based on August 1999 and projecting the interval September-December 1999 and Life table III, with data of December 1999 that projected the time interval of January-April 2000. With each projection, mean monthly mortality rates were calculated and compared statistically with observed values.
Theoretical methods: we define a cohort as a collection of individuals that share some trait or a group of traits for purposes of study. Then, our collection of shoots from a particular sampling date classified by age can be considered as a cohort (Harper 1994, Ebert 1999). The groups of statistics that conform the life tables were defined as in Ebert (1999) so that nx denotes is the number of individuals of age x. By means of mx we represent the number of offspring produced by an individual that enters the age x and survives the entire period x to x+
lx = nx
n0 (1)
px = lx + lx+1
lx-1 + lx (2)
p0 = l0 + l1
2 (3)
2 (4)
The recruitment rate was calculated as:
b = number of new born at time t
number of survivors from t - l to t (5)
Similarly, survival rate is:
s= number of survivors from t - l to t (6)
number individuals at time t - l
Then we can obtain mortality rate defined as
q =1-s (7)
Now, let A be the life table matrix for our population, so A will contain information about the above statistics and will be projected in time to produce the number of individuals of age x at time t+1. That is,
nx (t +1) = Anx (t ) (8)
Or, in matrix form, we have.
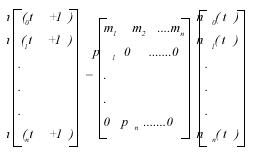
Matrix A on the right side of equation (8) is known as a Leslie matrix (Caswell 2001). With information on the above equation we can obtain the projected number of individuals and with equation (6) and (7) the mean monthly mortality rates.
Results
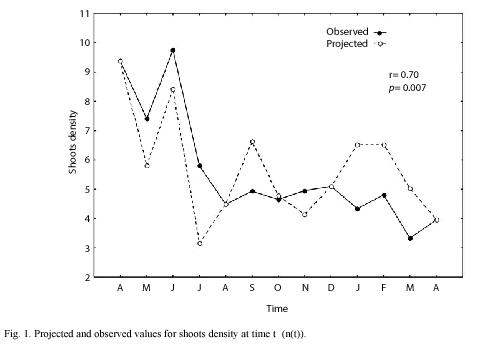
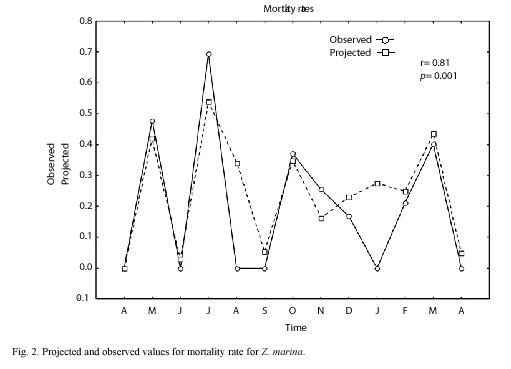
We sampled 820 rhizomes with a total of 4 014 shoots. The mean annual PI was 8.2 with an standard error of ±0.26. Using the 1999 data, we made monthly projections and compared all projected densities, finding that projections of April and August were statistically different from the rest of the projected months (ANOVA, p=0.02). Based on these results and taking into account an assumed seasonal growth pattern for Z. marina, (McRoy 1970, Jacobs 1979, Solana-Arellano et al. 1997) we defined three seasons, winter-spring (January-April); Summer-Autumn (May-August) and Autumn-Winter (September-December). These three seasons were projected using life tables I, II and III as described in the data management section and we found a good correspondence between projected and observed values for the total number of individuals at time t (nt) (Fig. 1). Moreover we found no statistical differences between projected and observed values for n(t) (t=-0.11, p=0.92). Using this information and equation (6), we estimated the mean monthly rates of mortality and (Fig. 2) shows the projected and observed rates for the sampled period. We performed a Students t test, and found no statistical differences between mean projected and mean observed values for mortality rate (t=0.69, p=0.5). The correlation between projected and observed rates was 0.81 (p=0.001). This along with Fig. 2 showed that the projections of life tables gave a reliable prediction of the aforementioned rates for Z. marina.
Discussion
Competitive species regulate their population sizes through shoot recruitment (Schmid and Harper 1985). Furthermore, some authors (Miyanishi et al. 1979, Duarte and Kalf 1987, Hutchings and Mogie 1990) argue that sea-grasses and in general clonal plants have a vigorous vegetative growth that results in vegetative expansion of clones. This is considered density-independent mortality which is a consequence of their growth strategy and not competition for substratum. On the other hand, plants with an opportunistic growth strategy tend to control nx(t) through mortality rate (Lovett 1981, Schmid and Harper 1985). Therefore, the study of mortality rates in these ecosystems is very important.
Seagrass meadows are very vulnerable to sudden climatic changes and anthropogenic perturbation (Short and Neckless 1999, Echavarria-Heras et al. 2006). In fact, Olesen and Sand-Jensen (1994) stated that shoot density is influenced by environmental factors and/or internal growth rhythms in seagrasses. This and the expensive and tedious marking techniques and lengthy laboratory procedures make necessary the development of rapid and non-destructive sampling techniques. The projection of a few seasonal life tables proved to be an effective tool for demographic analysis.
Within reasonable limits, whenever a population is ecologically stable, any sudden perturbation would induce a response allowing the population to prevail. Parameter identification and statistical contrastation of predictions versus observed dynamics are basic steps of a model selection procedure. Once suitability has been found to be satisfactory, the assumptions that sustain the model are expected to be reasonably close to the phenomenological properties of the real system. Particularly a matrix population model as the one invoked in the present work is able to predict the persistence of the population after a sequence of adaptative steps characterized by delayed responses induced by environmental perturbations. Moreover the demographic parameters are defined in such a way that their values at a given time depend recursively on former values. For instance, lx can be defined as the product of pi values which stand for the probability that an individual of age i survives one period of time, for 0 ≤ i ≤ x – 1. Hence lthe probability that a given individual is alive at age x will take a value different from zero if and only if none of the pi values vanishes. If at a certain time t a sudden environmental change occurs, then as long as the perturbation does not provoke the killing of all the individuals of a given age i for 0 ≤ i ≤ x – 1, then at a time t+1 there will be a prevailing number of individuals of age or stage x. That is, a sample taken in a given interval is demographically determined by the past history of the population up to that time. Hence the identification of the addressed model permitted to obtain reasonable values for the invoked demographic parameters. In other words, population stability and model suitability explain why our projection method produces consistent predictions.
Clonal plants respond to perturbations or environmental variability by modifying the morphological arrangement of their modules (Franco 1986). Furthermore, the utilization of plant resources depends on their ability to make physiological adjustments (Kays and Harper 1974). Other authors argued that both perturbations and environmental changes determine the expansion and growth patterns of modular populations but that the degree of adjustment is a characteristic of each species. Nevertheless, the adjustments are not instantaneous, in fact they depend on the different growth strategies with morphological extremes denoted by Lovett-Doust (1981) as guerilla and flange. The plasticity of the plant to adopt each of these strategies requires an amount of time. Solana-Arellano 2004 found that Z. marina adjusted its growth pattern from guerilla to flange and vise versa depending on the environment but this adjustment is not instantaneous. Therefore, even on sudden environmental changes the meadow will adjust after period of time. Hence the surviving individual will determine the demographic parameters; this implies that just two or three sampling visits per year on a stable population will provide a good basis for projection. On the other hand, suppose we have a projection based on data unaffected by sudden changes; assume that this has been proved to produce reasonable estimations. If a sudden non-catastrophic event occurs, then a sample taken after that event will give us estimations of the effect of such event on the meadow. This will be a crucial output for monitoring and management of the ecosystem.
The high correlation coefficient (0.81) between observed and projected mortality rates values through time showed that there is a good correspondence between observed ad projected rates Therefore we conclude that the contribution of a non-destructive technique for demographic analysis of a Z. marina population reduces number of field visits and quantity of samples and therefore the disturbances by researches to the ecosystem and is then an important practical contribution.
Acknowlegments
This paper is part of the research on eelgrass production partially funded by CONACYT by grant 26665-B and by CICESE. We greatly acknowledge José Ma. Domiguez and Francisco Javier Ponce for the fine work in the figures. We deeply thank Stephen Bullock and Ernesto Franco for the revision of this manuscript.
Resumen
El propósito principal de este estudio es el de proveer estimaciones de tasas promedio de mortalidad de tallos vegetativos de Zostera marina en una pradera cercana a Ensenada Baja California, utilizando una técnica que minimiza los muestreos destructivos para estos pastos marinos. Mediante la utilización de cohortes y matrices de Leslie, se construyeron tres tablas de vida, cada una representando a una estación dentro de período anual de muestreos mensuales (Abril
Palabras clave: modelos de matrices, demografía, Zostera marina, tasa de mortalidad.
Received 28-VIII-2006. Corrected 30-VI-2008. Accepted 31-VII-2008.
References
Caswell, H. 2001. Matrix population models: Construction, analysis and interpretation. Sinauer Associates, Sunderland,
Chapman, P. 1986. Nutrient cycling in marine ecosystems. J. Limnol. Soc. S. Afr. 12:22-24. [ Links ]
Cox, P.A. & P.B. Tomlinson. 1988. Pollination ecology of seagrass, Thalassia testudinum (Hydrocharitaceae), in
den Hartog, C. 1970. The seagrasses of the world. North Holland Publishing Company,
Duarte, C.M. & J. Kalf. 1987. Weigth-density relationships in submerged macrophytes. Oecologia 72: 612-617. [ Links ]
Duarte, C.M., N. Marbà & N. Agawin. 1994. Reconstruction of seagrass dynamics: age determinations and associated tools for the seagrass ecologist. Mar. Ecol. Prog. Ser. 107: 195-209. [ Links ]
Durako, M.J. & M.D. Moffler. 1987. Factors affecting the reproductive ecology of Thalassia testudinum (Hydrocharitaceae). Aquat. Bot. 27: 79-85. [ Links ]
Durako, M.J. 1994. Seagrass die-off in Florida Bay (USA): changes in shoot demography characteristics and population dynamics in Thalassia testudinum. Mar. Ecol. Prog. Ser. 110: 59-66. [ Links ]
Ebert, T.A. 1999. Plant and animal populations: methods in demography. Academic, New York, New York, USA. [ Links ]
Echavarría-Heras, H., E. Solana-Arellano & E. Francoviscaíno. 2006. The role of increase sea surface temperatura on eelgrass leaf dynamics: Onset of El Niño as a proxy for global climatic change in San Quintin, Bay Baja California. Bull. South.
Franco, M. 1986. The influence of neighbors on growth of modular organisms with an example from trees. Philos. T. Roy. Soc. 313: 209-255. [ Links ]
Gallegos, M., M. Merino, N. Marbà & C.M. Duarte. 1993. Biomass and dynamics of Thalassia testudinum in the Mexican Caribbean: eludanting rhizome growth. Mar. Ecol. Prog. Ser. 95: 185-192. [ Links ]
Gallegos, M. 1995. Dinámica de poblaciones y crecimiento de los pastos marinos caribeños Thalassia testudinum Bank ex Köning, Syringodium filiforme Kütz, y Halodule wrightii Ascherson. Tesis de doctorado, UNAM, México. [ Links ]
Harper, J.L. 1994. The Population Biology of Plants. Academic,
Hutchings, M.J. & M. Mogie. 1990. The spacial structure of clonal plants: control and consequences, p 57-
Jacobs, R.P.W.M. 1979. Distribution and aspects of the production and biomass of eelgrass, Zostera marina L., at
Kays, S. & J.L. Harper. 1974. The regulation of plant tiller in grass sward. J. Ecol. 62:97-105. [ Links ]
Keyfitz, N. 1972. On future population. J. Ame. Stat. Assoc. 67: 347-363. [ Links ]
Lovett, D. 1981. Population dynamics and local specialization in a clonal perennial (Ranunculus repens). I. The dynamics of ramets in contrasting habitats. J. Ecol. 69: 743-755. [ Links ]
Mann, K.H. 1982. The ecology of coastal waters. A system approach. Blackwell Scientific,
Mc Roy, C.P. 1970. Standing stocks and other features of eelgrass (Zostera marina) populations on the coast of
Miyanishi, K., A.R. Hot & P.B. Cavers.
Olesen, B. & K. Sand-Jensen. 1994. Demography of shallow eelgrass (Zostera marina) populations-shoot dynamics and biomasa developtment. J. Ecol. 82: 379-390. [ Links ]
Patriquin, D.G. 1973. Estimation of growth rate, production and age of the marine angiosperm, Thalassia testudinum, Konig. Caribb. J. Sci. 13: 111-123. [ Links ]
Pergent, G. & C. Pergent-Martini. 1990. Some applications of lepidochronological abalysis in the seagrass Posidonia oceanica. Bot. Mar. 33: 299-310. [ Links ]
Pérez, M., C.M. Duarte, J. Romero, K. Sand-Jensen & T. Alcoverro. 1994. Growth plasticity in Cymodocea nodosa stands: the importance of nutrient supply. Aquat. Bot. 47: 249-264. [ Links ]
Schmid, B. & J.L. Harper. 1985. Clonal growth in grassland perennials. I. Density and pattern-dependent competition between plans with different growth forms. J. Ecol. 73: 793-808. [ Links ]
Short, F.T. & H.A. Neckles. 1999. The effects of global climate change on seagrasses. Aquat. Bot. 63: 169-196. [ Links ]
Short, F.T. & H.A. Neckles. 1999. The effects of global climate change on seagrasses. Aquat. Bot. 63: 169-196. [ Links ]
Solana-Arellano, E., H. Echavarria-Heras & S.E. Ibarra-Obando. 1997. Leaf size dynamics for Zostera marina L. In San
Solana-Arellano, E. 2004. Métodos Analíticos para la caracterización de la dinámica foliar en Zostera marina L. tesis de doctorado. Universidad Autónoma Metropolitana, México D.F., México. [ Links ]
Vidondo, B., C.M. Duarte, A.L. Middelboe, K. Stefansen, T. Lützen & S.L. Nielsen. 1997. Dynamics of a landscape, mosaic: size and age distributions, growth and demography of seagrass Cymodocea nodosa. Mar. Ecol. Prog. Ser. 158: 131-138. [ Links ]

