


 Inglés (pdf)
 Articulo en XML
 Referencias del artículo
 Enviar articulo por email
 Citado por SciELO
  Similares en
SciELO
Similares en
SciELO  uBio
uBio 
 Permalink
Revista de Biología Tropical
versión On-line ISSN 0034-7744versión impresa ISSN 0034-7744
Rev. biol. trop vol.56 no.2 San José jun. 2008
Spatial distribution and species composition of small pelagic fishes in the Gulf of California
Edgar Lanz1, 3, Manuel O. Nevárez-Martínez2, Juana López-Martínez3 & Juan A. Dworak1
1 Instituto Tecnológico de Guaymas, Sector Las Playitas, 85480 Guaymas, Sonora, México; elanz@cibnor.mx; jdworakr@gmail.com
2 Centro Regional de Investigación Pesquera, Instituto Nacional de la Pesca, Calle 20 No. 605 Sur, Centro, 85400 Guaymas, Sonora, México; manuel.nevarez@prodigy.net.mx
3 Centro de Investigaciones Biológicas del Noroeste, S.C. PO Box 128, 2300 La Paz, Baja California Sur, México; jlopez04@cibnor.mx
Abstract: Traditional regionalization methods in fisheries based on provinces or major fishing areas, includes large and arbitrary grids in which basic statistics or inferences on distribution or abundance are made. We describe a method for regionalization and analysis of fishing activities for small pelagic fisheries in the Gulf of California based on spatial patterns of landing and catch data in a Geographic Information System (GIS) environment. A fisheries database from logbooks with spatial attributes from October 2002 to June 2007 was analyzed. Landings and catching data were transformed to a Weighted Region Index (WRI) by using fuzzy logic operators. The WRI revealed fishing action centers characterized by areas with the highest WRI values, and a hierarchy for the relative importance of the regions was established. Guaymas, Desemboque de Caborca, Isla Patos, and Bahía San Rafael they were the most prominent ones. An analysis of the relative frequency of species composition showed that the Pacific sardine had an over 80 % abundance in the midriff islands, and remained as the most important in the upper gulf regions, while in the central part of the gulf, relative abundances of Pacific sardine and Northern anchovy were more balanced. Relative abundance of mackerel was significantly larger around Isla Patos than in any other place. Guaymas had the largest relative composition of Northern anchovy and the lowest values for Pacific sardine. Desemboque de Caborca showed the largest homogeneity in species relative composition. It is important to highlight that this results come from in situ data, while the results previously reported come from landing statistics by port. Therefore, the present method acknowledges the spatial differences of species by regions, additional to the traditional time series analysis. Rev. Biol. Trop. 56 (2): 575-590. Epub 2008 June 30.
Key words: spatial distribution, Gulf of California, GIS, fishing regions, small pelagic fishes.
The spatial distribution of small pelagic fishes within and among regions of the globe has been of interest to fisheries scientist and fisherman. These species are the target of the most productive fisheries in the world (Lluch-Belda et al. 1992, Bertrand et al. 2004). Small pelagic fishes have undergone considerable variations in both, their distributions and abundance over time (Kawasaki 1984, Lluch-Belda et al. 1989, Nevárez-Martínez et al. 2001); influenced by seasonal, interannual and decadal climate variations (Lluch-Belda et al. 1989, Bakun and Broad 2003, deYoung et al. 2004). Historically, these variations have been analyzed based on time series analysis (Watson and Pauly 2001, Jennings and Blanchard 2004). However, fisheries depend also on the spatial features (Watson and Pauly 2001), and that information is scarce or is not included in the traditional analysis. Samb and Pauly (2000) argue that there is an antagonism between the emphasis on the temporal and spatial analysis of fisheries. Thus, management of this fishery demands new approaches to improve understanding of the mechanism of such variations, additional to basic time series analysis.
Recent studies on the distribution and abundance of pelagic fishes include the use of spatial information (Nevárez-Martínez et al. 2001, Páramo and Roa 2003) and mapping tools such as Geographic Information Systems (GIS) (Watson and Pauly 2001, Pauly and Zeller 2003, Watson et al. 2004). Particularly, Watson and Pauly (2001) suggested the use of spatial information in form of maps as an important part to manage fisheries on ecosystem basis. Consequently, this implies the existence of standardized areas delimited by boundaries or regions, which defines a system, diverging from the others on species composition and particular physical and biological features. According to Pauly and Zeller (2003), regionalization will serve as baselines for assessing the health of ecosystems, and to evaluate the effects of fishing and management scenarios.
The definition of the major fishing regions of the world is mainly based on physical structures (presence of shelves, coastal currents, fronts, etc.) and biological features. The first classification type is well represented by the broadly Large Marine Ecosystems (LME), defined by Sherman (1993), which is capable of identify entities with boundaries and internally homogenous (Pauly 1998). Similar approach was performed by Longhurst (1995), who provided a framework for comparative studies of ocean processes in the form of 57 Biogeochemical Provinces (BGCP), with boundaries defined by oceanographic structures. The second classification is based on species composition and variability obtained from landings statistics. One example of this one, it is the global fisheries statistics assembled and maintained by the Food and Agriculture Organization of the United Nations (FAO), which consist of 18 large, arbitrary fishing areas for statistical purposes, and which are not verified against spatial variations of the local data sets (Pauly and Zeller 2003). Such observations led Pauly et al. (1998) and Watson et al. (2004), to re-sample the statistical data into a half degree latitude and longitude grid of cells to study the fishing down marine food webs in a global scale, for all reported taxa and countries from 1950 to 2001. A further approach, has been implemented by Watson and Pauly (2001), whose utilized GIS tools to re-allocate this statistical data into a buffer representing the Economic Exclusive Zone (EEZ), because most of the catches (around 75 % of the total landings), in a global scale, fall in this fringe (Anonymous 2002), while maintaining the same spatial grid size.
As a consequence of the broad extension of the predefined global classification such as the LME, the BGCP, and the FAO fishing areas, they encompass very different ecosystems and faunas (Watson and Pauly 2001). In particular, FAO regionalization assemblages the fisheries catch data in a worldwide basis, reflecting the globalization of fisheries issues. Many criticisms have been written for this dataset around the reliability of this information (Chua 1986, Mariott 1984, Watson and Pauly 2001). Although, proposals for improving this database set has been mentioned by Pauly and Zeller (2003), in order to represent the FAO catch statistics into ecological context and to set the catches statistical to local scale, the fisheries catch data classification still has relevant problems and is not sufficient to understand the variability of catches data due to: A) The spatial pattern distribution of fisheries catch data has not been taken into account. The grid of cells and the buffer representing the EEZ around the world in which spatial and temporal variability of catches are analyzed (Pauly et al. 1998, Watson and Pauly 2001, Pauly and Zeller 2003, Watson et al. 2004) is still large, but it just constitutes a first approach to local regionalization of fisheries data; B) due to global nature of catch data, small pelagic fishes constitutes only a small part of large list of genders of fishes in the database and it needs to update to include additional information such as fleet characteristics and spatial distribution and abundance of catches data, among others; and, C) The huge areas of FAO regions make a difficult task to relate further abundances of catch with environmental factors with smaller scales of variability, such as, temperature and primary productivity.
Due to spatial-temporal nature of fisheries landing data, the uses of spatial analysis tools such as GIS, is an essential factor in the regionalization issue. GIS combined with other analytical tools such as clustering techniques and spatial filtering, can be perform this task more efficiently. This has been shown in other fields where spatially related problems occur (Curtis 1999). Many applications in the use of GIS tools such as spatial filtering to relate fisheries and environmental features in the ocean (for instance to detect fronts as indirect indicator of fishing ground regions) has been performed (e.g. Simpson 1994, Fernández and Pingree 1996, Polovina 1997). The spatial filter is an easy-to-use method of identifying point patterns, such as clusters or holes, at various geographic scales, by using the traditional circle as an area of analysis or a GIS to incorporate a defined shape (boundary), or noise removal of isolated points (ITC 1997).
The Gulf of California (GC) constitutes a unique ecosystem that is characterized by a high primary productivity (e.g. Santamaría-del-Angel et al. 1994, Valdez-Holguín et al. 1999). In particular, the gulf supports an important small pelagic fishing industry (Cisneros-Mata et al. 1995). This fishery is multispecific and includes eight species, although, the Pacific sardine (Sardinops sagax) is the dominant species (about 80 % of the total landings) (Nevárez-Martínez et al. 2001).
Many studies on abundance, size composition, and variability of small pelagic fishes have been conducted in the GC focused mainly on the Pacific sardine (Lluch-Belda et al. 1986, Hammann et al. 1988, Cisneros-Mata et al. 1996, Lluch-Cota et al. 1999, Nevárez-Martínez et al. 2001). Most of them have been focused on the spatial distribution and changes in abundance of fish larvae and eggs (Cisneros-Mata et al. 1996, Lluch-Cota et al. 2001). The spatial distribution of catches for different species is well documented in the annual fisheries bulletin emitted by the governmental monitoring agency (Instituto Nacional de la Pesca -INAPESCA). This includes information of landing statistics and species composition in the principal ports in the gulf (Cisneros-Mata et al. 1995, Nevárez-Martínez et al. 2001).
Main landing ports in the gulf are Guaymas and Yavaros. The species composition varies among landing port: Guaymas and Yavaros: Pacific sardine (Sardinops sagax caeruleus), northern anchovy (Engraulis mordax), thread herring (Opisthonema libertate), mackerel (Scomber japonicus), bigmouth sardine (Cetengraulis mysticetus) round herring (Etremeus teres) and Piña sardine (Oligoplites spp.) (Cisneros-Mata et al. 1995, Nevárez-Martínez et al. 2001).
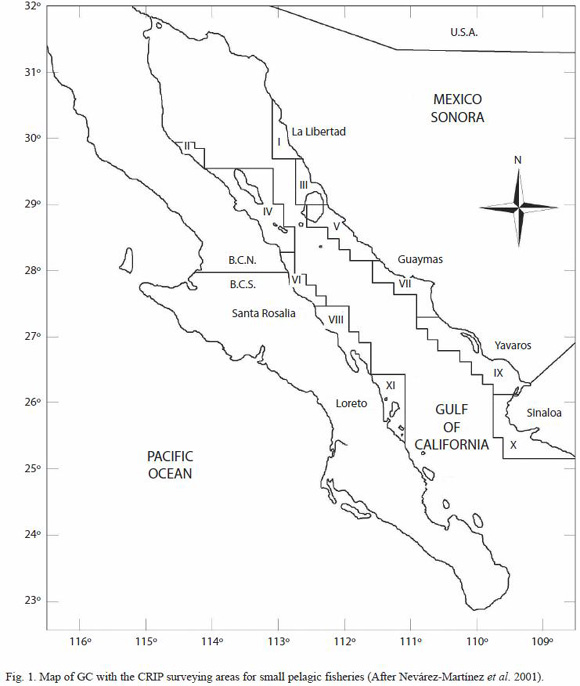
Early intents for regionalization of fishing activities in Mexico begun in the GC, which includes the statistical fishing areas for small pelagic fishery for both, the commercial fleet and surveys (Fig. 1) (Nevárez-Martínez et al. 2001). This arbitrary and pre-defined classification is based on the "empirical known regions" in which the commercial fleet operates, and it is still used. Commercial small pelagic fisheries activity in the gulf is a well-target fishery (e.g. there are selected areas in which the commercial fleet operates), however, during the journey to the traditional fishing grounds, some landings can be carry out.
A growing body of evidence suggests that environmental factors play a dominant role in the seasonality and species succession of these species, in particular, it has been observed that in the presence of El Niño Southern Oscillation (ENSO), catches of tread herring and Pacific sardine varies inversely in the Gulf of California (Lluch-Belda et al. 1986).
In spite that the Pacific sardine and others small pelagic fishes in the Gulf of California have been well documented, none of the previous studies, however, specifically addressed spatial distribution of catch data for regionalization and management in a data-driven basis. This paper perform a method which focuses on the regionalization of the commercial fishing activity in the GC from 2002 to 2007 using GIS, based on the spatial distribution of fisheries data to get a reliable vision of the fishing grounds location, especially in a small scale, and to analyze the variability of species composition in the resulting regions toward it sustainable management. Although the number of fishing landing records in the area came only from one fishery company, it attempts to provide new insight on the spatial distribution behavior of small pelagic fishes in the GC and must be improved by addition of future spatial fisheries databases.
Materials and methods
The study site: the Gulf of California (22°30-32°00 N, 106°00-116°00 W) (Fig. 1) is a subtropical sea with a complex hydrodynamics and productivity, particularly in its northern portion (Alvarez-Borrego 1983). It geomorphology consist of a series of basins, separated each by a sill and midriff islands (Pegau et al. 2002). The mountains on both sides of the gulf tend to polarize the winds so that they flow along the axis of the gulf. The winds then cause important physical and biological process in both coasts, such as upwelling, particularly in the midriff islands region (Alvarez-Borrego 1983, Pegau et al. 2002). Ocean circulation in the GC is determined mainly by the tidal and winds, among others. Residual currents in the gulf are responsible of the net transport of substances (Lavin et al. 1997). Satellite measurements of sea surface temperature and ocean color have been used to study the circulation in the Gulf of California (Badan-Dangon et al. 1985, Navarro-Olache 1989, Paden et al. 1991, Lavin et al. 1997) and to provide an understanding of the biological production in the gulf (Gaxiola-Castro et al. 1999). Recent studies in the GC arises the existence of small areas where biological activity is particularly high, which has been used to regionalize the gulf based on several levels of primary productivity (Santamaría-del-Ángel et al. 1994, Lluch-Cota and Arias-Aréchiga 2000), which are named as "Biological Action Centers" or BAC, and it appear to be fixed in space, tied to coastal features, and tend to show little seasonal variation in their level of productivity. These areas are the preferences of small pelagic fishes and are related to aggregation of commercial species (Lluch-Cota and Arias-Aréchiga 2000, Lluch-Belda et al. 2003). Similar productivity patterns in the GC has been observed by Pegau et al. (2002), based on SST and Chl-a images inferred from satellites, detecting the presence of series of eddies that have an alternating sense of rotation, and suggested that the eddies are topographically locked. Due of it is high productivity and its geographic location, the GC supports and important commercial fisheries, mainly small pelagic fish. Small pelagic fisheries in the GC are exploited by a specialized fleet of purseseiners, with hold capacities mostly between 125 and 180 tons. We used small-pelagicfishery catch data the commercial fleet of Guaymas
Fisheries data: available fishery data of commercial fishing logbook from 2002 to 2007 in the study area with date, geographic position, total catch, and species composition was converted to a spatial database. A georeference within a coordinate system, which contain projection information, was created and applied to all the fishing data to create point maps in a GIS environment. These point maps were further re-sampled into a regular grid of 4 km spatial resolution to produce raster maps. Then, the frequency of landing, total catches, and species composition were computed per cell for the whole time series by using point to area conversion tools in a GIS.
Landing density map, in the form of number of landings per cell, and catching density map in the form of total catches per cell, were computed by superimposing the grid and counting the number of point per cell and total catches per cell, respectively. Cells that contain no points a null attribute were assigned. In order to compare both density maps, they were scaled to fuzzy membership values, reflecting the relative importance of each individual cell value in the definition of fishing regions. Membership of a fuzzy set is expressed in a continuous scale from 1 (full membership) to 0 (full non-membership) (Bonham-Carter 1996). Thus individual measurements of landing and catches per cell in the map might be defined according to their degree of membership, which, can be interpreted as a suitability function (Bonham-Carter 1996). In the present work, such function is stated as suitability indicator for fishing region. Such membership function might be expressed analytically as:
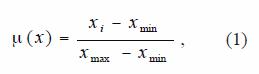
where: x is the landing density or catching density values, and µ(x) is the fuzzy membership function. Every value of landing or catching is associated with a value of µ(x) , and the ordered pairs [x, µ(x)] are known collectively as a fuzzy set. The fuzzy values are comparatively similar to normalized landing or normalized catching. The membership functions of these two set, reflect the importance of number of landing as a pathfinder element for fishing regions, the other one reflects the success degree of catching in a particular cell.
Fuzzy operators (Zimmermann 1985) were used to combining the fuzzy membership function values together. Three operators that were found to be useful for combining the fisheries dataset, namely the fuzzy algebraic product (FAP), fuzzy algebraic sum (FAS), and fuzzy gamma operator (FGO). These operators are defined as:
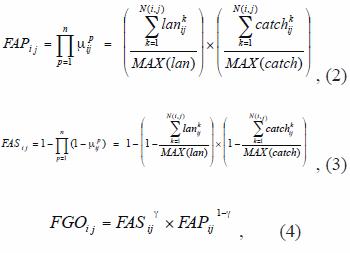
where: FAPij , FASij and FGOij are the fuzzy operators per cell, that denotes the suitability of each cell, based on the number of points (landing) with a value located in the output pixel (point density) and the sum of the values of point attributes (catches) in each cell, µpij is the fuzzy membership function for the p-th map, p=1,2.., n maps are to be combined, and i,j are the cell indexes in the grid, k is the k-th event (landing or catch) that occurs in the ij cell, MAX(lan) and MAX(catch) are the maximum values of landings per cell and catches per cell for the whole grid, respectively; and g is a parameter chosen in the range [0,1] (Zimmermann and Zysno 1980). When g is 1, the FGO is the same as the fuzzy algebraic sum; and when g is 0, the FGO equals the fuzzy algebraic product. FGO produces output values that ensures a flexible compromise between the "increasive" tendencies of the fuzzy algebraic sum and the "decreasive" effects of the fuzzy algebraic product. Fuzzy maps based on FGO, with g values of 0.2, 0.4, 0.6, and 0.8 were generated to search for the best fuzzy combination set.
In order to reduce spiky data, median spatial filtering was used to smooth FGO data, and to enhance the fisheries regions boundaries in a final map. The output pixel in each cell was replaced with a median value of the nineranked values in the 3x3 kernel of the median filter. Among the resulting patches, the most important were selected according to the following criteria: A) largest areas, defined by the number of grouped pixels in the final map, and B) the average of FGO values falling into each region. A Weighed Region Index (WRI), which compromises both, the relative extension of each region and the relative average of FGO per region, was calculated as follow:
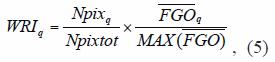
where: WRIq is the Weighed Region Index, that denotes the suitability for fishing of the q-th region, based on the extension of normalized region and the relative average of FGO per region, Npixq and Npixtot are the number of pixels of the q-th region, and the total number of pixels of all the regions revealed, respectively,  and MAX are the average of of the q-th region, and the maximum value of the per region, respectively. The regions were selected with the highest values of WRI, which included both coasts of the Gulf of California, for further comparison.
Species composition in the form of relative frequency of abundance by species was obtained in each selected region in the form of:
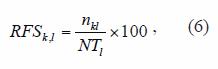
where: RFSk,l is the relative frequency (in percentage) of abundance, that denotes contribution to the total catching of the k-th species falling within a l-th region, nkl is the catching of the k-th species in a certain region, NTl is the total catching (which includes all the species) falling within a l-th region. The relative frequency of abundance of species within and among regions, were further compared in order to analyze its spatial variability.
Results
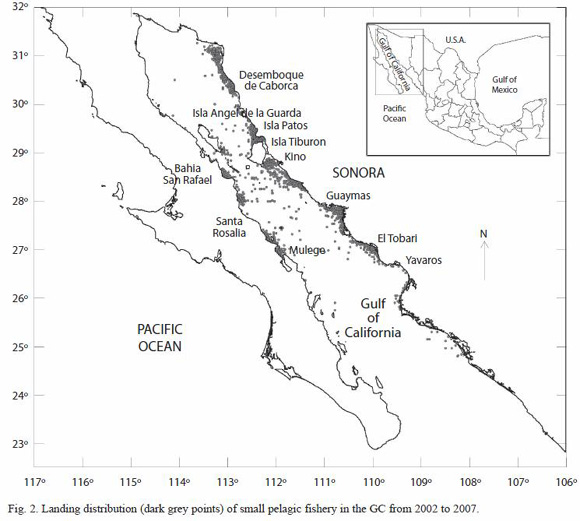
A total of 3 756 landings from the database were found to be useful since they matched in the study area. The spatial scatter plots (Fig. 2) and the derived point density (not shown) maps of landing, suggested the existence of high activity fisheries regions, close to the principal ports and islands in the northern, and central part of the gulf. Furthermore, Fig. 2 also shows a wide range of distribution of small pelagic fishes landing.
Landing density map (not shown) exhibited a range of cell values from 1 to 81, while catching density map showed a range from 5 to 4 255. Linear correlation of normalized values of landing density and normalized catching density values where highly correlated (r2=0.91; ncell=664), which support the evidence of the catching values might be used as indicator of abundance of small pelagic fishes, under the conditions encountered.
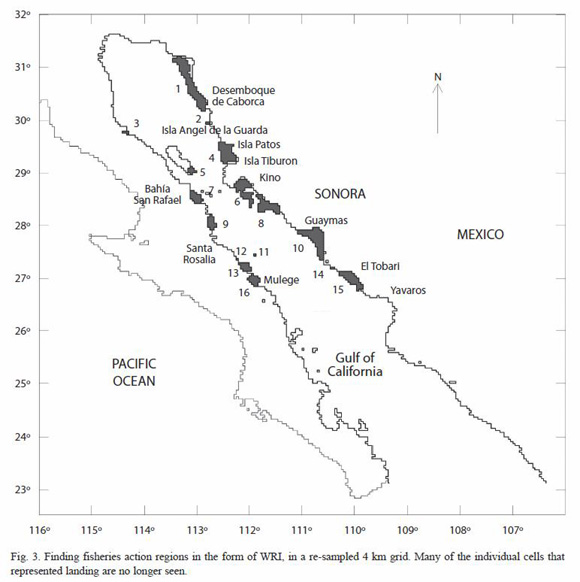
A FGO with a  value of 0.8 was used to create a suitability map for fishing region, since this value showed to be representative as an equalized operator, which compromised both, the combined relative frequency of landing and the relative abundance of catching in each cell in the form of FAS and FAP. The smoothed map after using the spatial filter showed wellshaped regions close to the coast (Fig. 3). Many of the isolated cells were no longer seen. Due the nature of the spatial filter used, new values of FGO that represented the median of nine ranked values were replaced in the output cells in each region revealed. This new values represented the long-scale variability per region (>12 km). After that, WRI values were calculated for each region (Table 1). Regions with WRI values of the order to 101 were selected to be representatives of fisheries activities for further comparison. These ranked-regions were 10, 1, 4, 8, 7, 6, 15, and 9 (Table 1). Among them, Guaymas (region 10), Desemboque de Caborca (region 1), and Isla Patos (region 4) had the highest WRI values, respectively. In contrast, Bahía San Rafael (region 7) was the most representative in the west coast of the GC.
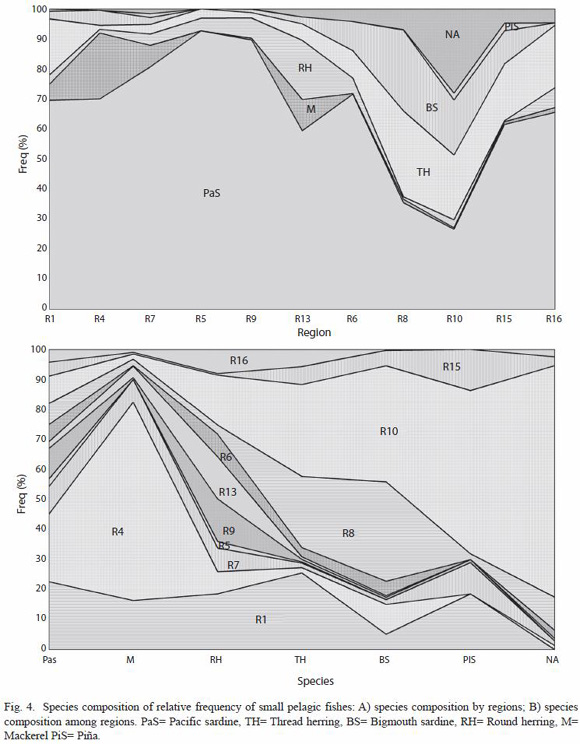
A total of seven species were observed in the selected regions. These species were, in order of commercial importance: Pacific sardine, thread herring, mackerel, round herring, northern anchovy, bigmouth sardine and Piña sardine. The relative frequencies of abundance of species composition expressed on an individual species basis by region and by species among them are shown in Fig. 4. Species spatial composition seems to be different in the selected regions. Pacific sardine was the most representative species, particularly in the regions located at the north part of GC (greater than 60 % of relative abundance), and decreased towards the central regions, with lower relative contribution (lower than 40 %) in the regions 8 and 10 (Fig. 4A). It also shows that mackerel was the predominant species in the northern regions (1 and 4), and arises again in the region 13. Northern anchovy, bigmouth sardine, and thread herring covariate increasing its relative contribution in abundance, toward the central regions (8, 10, and 15). Northern anchovy seems to be scarce in the rest of the regions. A similar relation was found in regions 7 and 9 with these species and among regions 9 and 13 with the presence of round herring. However, in spite of regions 6 and 8 are spatially closer, they shows to be different in the relative species composition among them. Species spatial variability (Fig. 4B) shows that mackerel was the most predominant species in the region 4, and northern anchovy in the region 10. Also Fig. 4B shows an inverse relation in the spatial variability among these northern region and southern region, also with the species of bigmouth sardine, round herring, and Piña sardine, which, are also appreciated among regions 8, 15, and 16. Particularly, it seems that northern anchovy occurs mainly in southern regions and it is scarce in the northern regions (1, 4, 5, and 7), where Pacific sardine covariates inversely. Round herring shows that, in spite it was well located at regions 1 and 10, its presence remains in most of the regions, similar to the spatial variability of Pacific sardine.
Discussion
Combination of fuzzy operators such as FAS and FAP showed to be useful to reveal fishing action centers. Although landing density values and catching density values are not statistically independent, they were used so at this stage and they proved to be useful for the fishing regionalization task. FAP value map was rather conservative while FAS operator produced values with an "increasive" effect. In particular, the fuzzy operator FGO with a subjective g value of 0.8 showed to serve as compromise between the "increasive" sum and "decreasive" product of both, the combined relative frequency of landing and the relative abundance of catch in each cell in the form of FAS and FAP. Actually, it may be desirable to use a variety of different fuzzy operators in the same problem, as show for fishing regionalization in this work. In particular, FGO is used to link both variables, as raw evidence in a set of combinations, in which the uncertainty of evidence is important (Bonham-Carter 1996). Median spatial filtering applied to landing spatial data showed to perform well for regionalization. This process supposes that these landings were sparse and no grouped with few or no neighborhood and maybe due to error in the positioning of landing in the fishing logbook. WRI, based on area extension, and the average FGO values by region showed to be useful to select the most representatives fishing action centers in the GC.
Spatial distribution of fisheries data aims to give us a comprehensive analysis about the fishery action centers, and the variability in the distribution and abundance of the fisheries resources; hence it is an essential tool that complements the traditional time series analysis. In the GC, small pelagic fishes distribution responds to a combination of biotic and abiotic factors. In the case of Pacific sardine, Lluch-Belda et al. (1995), proposed the existence of two distribution centers A) In the Gulf of California surrounding the Great Islands, and B) Punta Eugenia west of Baja California. From these centers, the populations of sardine geographically expands and contracts for feeding or spawning, following unknown environmental factors. Landing scatter plots in Fig. 2 reinforce the evidence that small pelagic fishes are distributed mainly around Isla Tiburon, and the west coast of the Gulf of California. Generally, Pacific sardine is concentrated in the center-north of GC (Isla Patos and south of Isla Angel de la Guarda), and the thread herring in the coast of center-south of Sonora and north of Sinaloa (Nevárez-Martínez et al. 2003). Map in the Fig. 2 shows a wide spatial distribution of small pelagic fishes in the Gulf of California, and concentrate also in the Great Islands in accordance with Lluch-Belda et al. (1995). Furthermore, large regions are observed in Desemboque de Caborca, Isla Patos, Guaymas, El Tóbari, and Mulegé-Santa Rosalía. The spatial differences between stations at the Upper GC, and the Central GC might be in concordance with the circulation pattern of the upper layer of the GC thermodynamically driven, which shows unconnected eddies separated by the midriff islands (Beier 1997).
Among the small pelagic fishes, the relative abundance of a single species signifies its dominance in the ecosystem and its ability to use resources. In some cases, different species may be in competition for the same biological niche, so that a rise in the population of one may be associated with a decline in the population of another, as in the case of anchovy and South American pilchard (Christy 1997). Sardine population changes are seemingly related to environmental variability (Nevárez-Martínez et al. 2003), whereas the spatial pattern of abundance for another competitor (e.g. northern anchovy) appears to be inversely related to sardine population abundance (Rodríguez-Sánchez et al. 2002). According to literature, thread herring is relatively more frequent in southern part of GC, particularly in the ports of Guaymas and Yavaros, when Pacific sardine scarce such as occurred in the period 1990 to 1993 and the fishing season 1997-1998, both periods with the presence of "El Niño" (Anonymous 2001).
A cross correlation analysis (not shown) among species, for this work, showed a positive correlation among Pacific sardine and mackerel (r=0.77), in accordance with the reported by the literature (e.g. Christy 1997, Cury et al. 2000). However, in spite of inverse correlation among Pacific sardine and northern anchovy was found as reported in previous studies (e.g. Christy 1997, Cury et al. 2000), this was not statistically significant; due perhaps to the short length of the time series of fisheries data available. Additionally, correlations among others species were obtained to be positively correlated: northern anchovy and Piña sardine (r=0.96), thread herring and bigmouth sardine (r=0.88), Northern anchovy and bigmouth sardine (r=0.81), thread herring and Piña sardine (r=0.79), and northern anchovy and bigmouth sardine (r=0.76). Although the time series is short, it can be useful for comparison purposes. In the regions selected, this behavior seems to be similar; presence of Pacific sardine seems to be related to the presence of mackerel, and to the absence or low presence of northern anchovy, in agreement with the results previously reported (Christy 1997, Cury et al. 2000).
Comparing the seven numerically topranking species between regions, the Pacific sardine had the highest abundance, followed by thread herring (Fig. 4). Such species were located in areas with traditional success fisheries. Furthermore, the species composition within regions showed to be similar to the reported in landing statistics in the GC (Cisneros-Mata et al. 1995). In contrast, the species spatial variability in the selected regions was different to the reported in the traditional time series of catching by port (e.g. Cisneros-Mata et al. 1995, Nevárez-Martínez et al. 2001). In spite of that the present regionalization is embedded in the Nevárez-Martínez et al. (2001) grid, it revealed a shorter-scale pattern. It also showed a difference in species composition among regions within a single cell of the larger grid (e.g. regions 6 and 8 within region V). Therefore, the present method acknowledges the spatial differences of species by regions, additional to the traditional time series analysis.
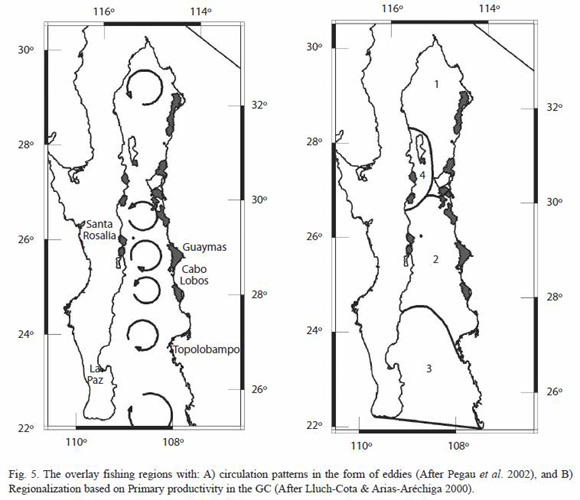
Since the fishing activity in the regions founded seems to be a permanent pattern in time, the environmental conditions that trigger them should also have to be a semi-permanent feature. In consequence, a visual comparison by overlaying the selected fishing action centers in the form of WRI with the long-term eddies patterns in the gulf documented by Pegau et al. (2002) (Fig. 5A), and the primary productivity regions proposed by Lluch-Cota and Arias-Aréchiga (2000) (Fig. 5B), suggest the hypothesis that the spatial distribution of revealed fishing action centers, the species spatial composition, and species spatial variability might be driven by these quasi-stationary and topographically-locked patterns in the GC. We hypothesize that eddies streamlines create filaments of high concentration of chlorophyll that get trapped in large open embayments along the coast of the GC, aside from the wellknown, and transient upwelling events.
In this study, we show a method for spatial data analysis in GIS to create fishing regions according to the spatial pattern of fishing activities. In the regionalization process, the combined use of fuzzy logic operators in the form of FAP, FAS, and FGO, which used landing density and catching density showed to be effective in the reduction of the dimensionality of the problem to just one dimension, represented by the WRI values. These WRI values showed significant regions that corresponded with the traditional fishing zones. We suggest that in the next decades fisheries management will have to emphasize the studies on the spatial features of these fishing regions in order to preserve the commercial fisheries activities on the sustainable basis. These revealed regions can be used as indicator of the fisheries health in the gulf and further relationship with environmental variables (e.g. SST and Chl-a), which can be useful to explain this spatial variability of the small pelagic fishes in the GC.
We also found that the present method is able to detect the spatial variability in the relative composition of species of small pelagic fishes among regions, which were not previously reported in the GC. The selected regions located at the upper part of the GC seem to be grouped, based on these species composition; and analogous grouping it is shown to those regions located at the central part of the GC. Although, the number of fishing landing records in the area came only from one fishing company, it attempts to provide new insight on the spatial distribution pattern of small pelagic fishes in the GC and must be improved by addition of future spatial fisheries database.
Acknowledgments
We appreciate fishing company PROPEGUAY S.A. DE C.V. for supplying us with valuable fisheries data. This research is supported by INAPESCA-CRIP and CIBNOR Guaymas. The corresponding author thanks to CONACYT (85931) and CIBNOR for the support in this research work.
Resumen
Los métodos tradicionales de regionalización en pesquerías, basados en provincias o grandes regiones, incluyen áreas arbitrarias y homogéneas sobre las cuales se realiza estadística básica o inferencias relacionadas con la distribución y la abundancia de estos recursos. El presente trabajo describe una metodología para la regionalización y el análisis de la actividad pesquera de pelágicos menores en el Golfo de California basado en los patrones espaciales de la información de lances y capturas utilizando herramientas de Sistemas de Información Geográfica (SIG). La información pesquera, con atributos espaciales, provino de bitácoras de pesca para el periodo comprendido de octubre 2002 a junio 2007. Los datos de lances y capturas fueron transformados a un Índice de Región Ponderada (WRI) utilizando operadores de lógica difusa. El WRI reveló centros de actividad pesquera caracterizados por áreas con los valores más altos de WRI y se obtuvo un orden jerárquico para denotar la importancia relativa de cada región, siendo las regiones de Guaymas, el Desemboque de Caborca, Isla Patos y Bahía San Rafael, los más prominentes. El análisis de la frecuencia relativa de la composición de especies mostró que la sardina Monterrey tuvo una abundancia relativa mayor al 80% en la región de las Grandes Islas y permaneció como la especie más importante en las regiones del alto golfo, mientras que en la parte central del golfo las abundancias de la sardina Monterrey y la ancho-veta norteña estuvieron más equilibradas. La abundancia relativa de la macarela fue significativamente mayor en la región de la Isla Patos, respecto a cualquier otra región. La región de Guaymas mostró la mayor composición relativa de anchoveta norteña, en contraste con los más bajos valores de sardina Monterrey. El Desemboque de Caborca mostró la mayor homogeneidad en la composición relativa de especies. Estos resultados provienen de datos in situ, mientras que los resultados previamente reportados provienen de estadísticas de lances por puerto. En consecuencia, el presente método reconoce las diferencias espaciales en la composición de especies por regiones (adicionales a los tradicionales análisis de series de tiempo).
Palabras clave: distribución espacial, Golfo de California, SIG, regiones pesqueras, pelágicos menores.
Received 17-VIII-2006. Corrected 25-X-2007. Accepted 26-XI-2007.
References
Alvarez-Borrego, S. 1983. Gulf of California, p. 427-449. In B.H. Ketchurn (ed.). Estuaries and enclosed seas. Elsevier, Amsterdam, Nederland. [ Links ]
Anon. 2001. Pelágicos menores. Sustentabilidad y Pesca responsable en México. Evaluación y Manejo, 1997-1998 INP, SEMARNAP, México DF, México. [ Links ]
Anon. 2002. Report of the First Session of the Advisory Committee on Fishery Research. FAO Fish. Rep. 571: 2-34. [ Links ]
Badan-Dangon, A., C.J. Koblinsky & T. Baumgartner. 1985. Spring and summer in the Gulf of California, observations of surface thermal patterns. Oceanol. Acta 8: 13– 22. [ Links ]
Bakun, A. & K. Broad. 2003. Environmental loopholes and fish population dynamics: comparative pattern recognition with focus on El Nino effects in the Pacific. Fish. Oceanogr. 12: 458-473. [ Links ]
Beier, E. 1997. A numerical investigation of the annual variability in the Gulf of California. J. Phys. Ocean 27: 615-632. [ Links ]
Bertrand, A., M. Segura, M. Gutiérrez & L. Vásquez. 2004. From small-scale habitat loopholes to decadal cycles: a habitat-based hypothesis explaining fluctuation in pelagic fish populations off Peru. Fish Fisheries 5: 296-316. [ Links ]
Bonham-Carter, G.F. 1996. Geographic Information Systems for geoscientists. Modelling with GIS. Pergamon, Elsevier Science Ltd., Computer Methods in the Geosciences, Tarrytown, New York, USA. [ Links ]
Christy, F.T. 1997. The Development and Management of Marine Fisheries in Latin America and the Caribbean. Inter-American Development Bank, Social Programs and Sustainable Development Department, Enviroment Division, Policy Research Paper, Washington D.C., USA. [ Links ]
Chua, T.E. 1986. Aquaculture production in Asia: a reassessment. NAGA the ICLARM Quarterly 9: 13-15. [ Links ]
Cisneros-Mata, M.A., M.O. Nevárez-Martínez & M.G. Hammann. 1995. The rise and fall of the Pacific sardine, Sardinops sagax caeruleus (Girard), in the Gulf of California, Mexico. CalCOFI Rep. 36: 136-143. [ Links ]
Cisneros-Mata, M.A., G. Montemayor-López & M.O. Nevárez-Martínez. 1996. Modeling deterministic effects of age structure, density dependence, environmental forcing and fishing on the population dynamics of Sardinops sagax caeruleus in the Gulf of California. CalCOFI Rep. 37: 201-208. [ Links ]
Curtis, A. 1999. Using a Spatial Filter and a Geographic Information System to Improve Rabies Surveillance Data. Emerg. Infect. Dis. 5: 603-606. [ Links ]
Cury, P., A. Bakun, R.J.M. Crawford, A. Jarre, R.A. Quinones, Shannon & H.M. Verheye. 2000. Small pelagics in upwelling systems: patterns of interaction and structural changes in wasp-waist ecosystems. ICES Journal of Marine Science 57: 603–618. [ Links ]
de Young, B., R. Harris, J. Alheit, G. Beaugrand, N. Mantua & L. Shannon. 2004. Detecting regime shifts in the ocean: data considerations. Prog. Oceanogr. 60: 143-164. [ Links ]
Fernández, E. & R.D. Pingree. 1996. Coupling between physical and biological fields in the North Atlantic subtropical front southeast of the Azores. Deep-Sea Res. 43: 1369-1393. [ Links ]
Gaxiola-Castro, G., S. Álvarez-Borrego, M. F. Lavín, A. Zirino, & S. Nájera-Martínez. 1999. Spatial variability of the photosynthetic parameters and biomass of the Gulf of California phytoplankton, J. Plankt. Res. 2: 231– 245. [ Links ]
Hammann, G., T.R. Baumgartner & A. Badan-Dangon. 1988. Coupling of the Pacific Sardine (Sardinopx sagax caeruleus) life cycle with the Gulf of California pelagic environment. CalCOFI Rep. 22: 102-109. [ Links ]
ITC. 1997. The Integrated Land and Water Information System ILWIS. User´s guide. International Institute for Geo-Information Science and Earth Observation, Enschede, The Netherlands. [ Links ]
Jennings, S. & J.L. Blanchard. 2004. Fish abundance with no fishing: predictions based on macroecological theory. J. Anim. Ecol. 73: 632-642. [ Links ]
Kawasaki, T. 1984. Why do some pelagic fishes have wide fluctuations in their numbers? A biological basis of fluctuation from the viewpoint of evolutionary ecology, p. 1065-1080. In G.D. Sharp & J. Csirke (eds.). Reports of the Expert Consultation to Examine Changes in Abundance and Species Composition of Neritic Fish Resources. FAO Fish. Rep. 291 (3) [ Links ]
Lavín, M.F., E. Beier & A. Badan. 1997. Estructura hidrográfica y circulación del Golfo de California: Escalas estacional e interanual, p. 141-171. In Contribuciones a la Oceanografía Física en México. Monografía No. 3, M.F. ed. M.F. Lavín. Unión Geofísica Mexicana, México DF. [ Links ]
Lluch-Belda, D., B.F.J. Magallón & R.A. Schwartzlose. 1986. Large fluctuations in the sardine fishery in the Gulf of California: possible causes. CalCOFI Rep. 27: 136-140. [ Links ]
Lluch-Belda, D., R.J.M. Crawford, T. Kawasaki, A.D. MacCall, R.H. Parrish, R.A. Schwartzlose & P.E. Smith. 1989. World wide fluctuations of sardine and anchovy stocks: the regime problem. S. Afr. J. Mar. Sci. 8: 195-205. [ Links ]
Lluch-Belda, D., R.A. Schwartzlose, R. Serra, R. Parrish, T. Kawasaki, D. Hedgecock & J.M. Crawford. 1992. Sardine and anchovy regime fluctuations of abundance in four regions of the world oceans: a workshop report. Fish. Oceanogr. 1: 339-347. [ Links ]
Lluch-Belda, D., M.J. Arvizu, S. Hernández-Vázquez, D. Lluch-Cota, A.C.Z. Salinas, T. Baugartner, G. Hammann, V.A. Cota, C.E. Cotero, F.W. García, O. Pedrín, S.M. Lizárraga, M.A. Martínez, R. Morales, M.O. Nevárez M., J.P. Santos M., R. Ochoa B., S.R. Rodríguez, J.R. Torres V. & F. Páez B. 1995. Atlas Pesquero de México. Pesquerías Relevantes. Secretaría de Pesca/ Instituto Nacional de la Pesca/ Universidad de Colima (Cenedic), Colima, México. [ Links ]
Lluch-Belda, D., D.B. Lluch-Cota & S.E. Lluch-Cota. 2003. Baja Californias biological transition zones: Refuges for the California Sardine. J. Oceanog. 59: 503-513. [ Links ]
Lluch-Cota, S.E. & J.P. Arias-Aréchiga. 2000. Sobre la importancia de considerar Centros de Actividad Biológica para la regionalización del océano: El caso del Golfo de California, p. 255-263. In D. Lluch-Belda, S.E. Lluch-Cota, J. Elourduy-Garay & G. Ponce-Díaz (ed.). BACs: Centros de Actividad Biológica del Pacifico Mexicano Centro de Investigaciones Biológicas del Noroeste, SC. Centro Interdisciplinario de Ciencias Marinas del IPN y Consejo Nacional de Ciencia y Tecnología, La Paz, B.C.S., Bolivia. [ Links ]
Lluch-Cota, S.E., D.B. Lluch-Cota, D. Lluch-Belda, M.O. Nevárez-Martínez, A. Parés-Sierra & S. Hernández-Vázquez. 1999. Variability of sardine catch as related to enrichment, concentration, and retention processes in the central Gulf of California. CalCOFI 40: 184-190 [ Links ]
Lluch-Cota, S.E., D. Kiefer, A. Parés-Sierra, D.B. Lluch-Cota, J. Berwald & D. Lluch-Belda. 2001. Toward and Environmental Analysis System to Forecast Spawning Probability in the Gulf of California Sardine, p. 147-159. In Spatial Processes and Management of Marine Populations. Alaska Sea Grant College Program, AK-SG-01-02, Alaska, USA. [ Links ]
Longhurst, A. 1995. Seasonal cycles of pelagic production and consumption. Prog. Oceanogr. 36: 77-167. [ Links ]
Marriott, S.P. 1984. Notes on the completion of FAO form NS1 (National Summary). Fishbyte 2: 7-8. [ Links ]
Nevárez-Martínez, M.O., D. Lluch-Belda, M.A. Cisneros-Mata, J.P. Santos-Molina, M.A. Martínez-Zavala & S.E. Lluch-Cota. 2001. Distribution and abundance of the Pacific sardine (Sardinops sagax) in the Gulf of California and their relation with the environment. Prog. Oceanogr. 49: 565-580. [ Links ]
Nevárez-Martínez, M.O., E. Cotero, M.A. Martínez-Zavala & R. Félix-Uraga. 2003. Recruitment of the Pacific sardine (Sardinops sagax) in Baja California, México. Program and Abstracts, CaLCOFIAnnual Conference 2004 , 15-18 nov. 2004. p. 20, Mexico. [ Links ]
Paden, C.A., M.R. Abbott & C.D. Winant. 1991. Tidal and atmospheric forcing of the upper ocean in the Gulf of California 1. Sea surface temperature variability, J. Geophys. Res. 96, 18: 337– 359. [ Links ]
Páramo, J. & R. Roa. 2003. Acoustic-geostatistical assessment and habitat-abundance relations of small pelagic fish from the Colombian Caribbean. Fish. Res. 60: 309-319. [ Links ]
Pauly, D. 1998. Large Marine Ecosystems: Analysis and Management. In S.C. Pillar, C.L. Moloney, A.I.L. Payne & F.A. Shillington (eds). Benguela Dynamics. S. Afr. J. Mar. Sci. 19: 487-499. [ Links ]
Pauly, D., V. Christensen, J. Dalsgaard, R. Froese & F.C. Torres Jr. 1998. Fishing down marine food webs. Science 279: 860-863. [ Links ]
Pauly, D. & D. Zeller. 2003. The Global Fisheries Crisis as a Rationale for Improving the FAOs Database of Fisheries Statistics. Part 1. Fisheries Centre Research Reports, Vol. 11. [ Links ]
Pegau, W.S., E. Boss & A. Martínez. 2002. Ocean color observations of eddies during the summer in the Gulf of California, Geophys. Res. Lett. 29, 9: 1295-1298 [ Links ]
Polovina, J.J. 1997. Local-scale swordfish fisheries oceanography. Second international Pacific Swordfish symposium, Hawaii, USA. [ Links ]
Rodríguez-Sánchez, R., D. Lluch-Belda, H. Villalobos & S. Ortega-García. 2002. Dynamic geography of small pelagic fish populations in the California Current System on the regime time scale. Can. J. Fish. Aquat. Sci. 59: 1980-1988. [ Links ]
Samb, B. & D. Pauly. 2000. On variability as a sampling artefact: the case of Sardinella in North-western Africa. Fish and Fisheries 1: 206-210. [ Links ]
Santamaría-del-Ángel, E., S. Álvarez-Borrego & F.E. Müller-Karger. 1994. Gulf of California biogeographic regions based on coastal zone color scanner imagery. J. Geophys. Res. 99: 7411-7421. [ Links ]
Sherman, K. 1993. Large Marine Ecosystems as Global Units for Marine Resources Management. An Ecological Perspective, p 3-14. In K.A. Sherman, L.M. Alexander & B.D. Gold (eds.). Large Marine Ecosystems: Stress, Mitigation, and Sustainability. AAAS Selected Symposium, Westview, Boulder, Colorado, USA [ Links ]
Simpson, J.J. 1994. Remote Sensing in Fisheries: A tool for better management in the utilization of a renewable resource. Can. J. Fish. Aquat. Sci. 51: 743-771. [ Links ]
Valdez-Holguín, J.E., S. Álvarez-Borrego & C.C. Trees. 1999. Seasonal and spatial characterization of the Gulf of California phytoplankton photosynthetic parameters. Ciencias Marinas 25: 445-467. [ Links ]
Watson, R. & D. Pauly. 2001. Systematic distortions in world fisheries catch trends. Nature 414: 534-536 [ Links ]
Watson, R., E. Hoshino, J. Beblow, C. Revenga, Y. Kura & A. Kitchingman. 2004. Fishing gear associated with global marine catches. Fisheries Centre Research Reports Vol. 12 (6). [ Links ]
Zimmermann, H.J. & P. Zysno. 1980. Latent connectives in human decision making: Fuzzy sets and Systems, v. 4 (n.d.). [ Links ]
Zimmermann, H.J. 1985. Fuzzy set theory –and its Applications. Kluwer-Niijhoff, Boston, Massachussetts, USA. [ Links ]

