


Services on Demand
Journal
Article
 English (pdf)
 Article in xml format
 Article references
 Send this article by e-mail
Indicators
-
 Cited by SciELO
 -
 Access statistics
Related links
-
 Similars in
SciELO
Similars in
SciELO  uBio
uBio
Share

 Permalink
Revista de Biología Tropical
On-line version ISSN 0034-7744Print version ISSN 0034-7744
Rev. biol. trop vol.54 n.2 San José Jun. 2006
The influence of vegetation on bird distribution in dry forests and oak woodlands of western Mexico
Pablo Corcuera1, 2 & J. Alejandro Zavala-Hurtado2
1 Departamento de Biología, UAM-Iztapalapa, A.P. 55-535, C.P. 09340, México D.F.
2 Address for correspondence: P. Corcuera; tel: (525)804 46 96; fax: (525)804 46 87; pcmr@xanum.uam.mx
Received 09-X-2001. Corrected 04-II-2003. Accepted 16-X-2003.
Abstract. The bird species distribution along a dry forest-oak woodland vegetation gradient was studied in autumn and spring in two consecutive years. Intra-seasonal comparisons showed that bird species had similar distributions in each of the two years. Inter-seasonal changes were mainly due to compositional differences even though resident species generally used similar habitats in both seasons. Ordination analyses, based on the first year bird species abundances, showed a clearly segregated distribution between forest and woodland birds. Within these two vegetation types, the distribution tended to be more individualistic. Nevertheless further habitats could be identified according to groups of birds having similar distributions. These habitats did not correspond to the plant associations which resulted from a previous classification of the vegetation. Observations of the plant use by the birds during the study period showed that, in most cases, the plant variables associated with ordination analyses are unlikely to be very important for the bird species life cycles. Rev. Biol. Trop. 54(2): 657-672. Epub 2005 Jun 01.
Key words: bird communities, dry forests, oak woodland, Canonical Correspondence Analysis, Generalized Linear Models, response curves.
The relationship between bird species distribution and vegetation was first investigated by Bond (1957). He found that the bird species distribution followed an individualistic pattern in a vegetation gradient in North American woodland. Nevertheless, the arrangement of his study units, based on plant species similarities, coincided with an arrangement based on the bird species.
Subsequent studies have confirmed the important role that the flora has on the distribution of bird species (James and Wamer 1982, Rotenberry 1985, Peck 1989, Bibby et al. 1985). This relationship becomes more evident when vegetation changes are pronounced; in altitudinal gradients in Peru (Terborgh 1977), the United States of America (Noon 1981) and Mexico (Navarro 1992) a high bird species turnover between physiognomical vegetation types has been reported.
Due to changes in resource availability and migratory patterns, distributional changes are also expected between seasons. For example, Bilcke (1984) found that during the breeding season, bird species tended to be more restricted in their habitat choice.
Raitt and Pimm (1976) obtained bird densities during a three year study and found that richness, the proportion of guilds and abundance varied among habitats and seasons in the Chihuahuan desert of North America. Furthermore, these variations did not occur only between seasons, but also during the same season among different years.
Other authors have also found that bird community patterns change between seasons (Bilcke 1984, Morrison et al. 1986, Poulin et al. 1993, López and Moro 1997).
The predictability and eventual management of bird communities depends on their temporary fluctuations in richness, composition and diversity. The magnitude of these changes is little known and, with the exception of few studies (including the ones mentioned above) has not been studied in most vegetation types.
In order to assess both the temporal and the spatial response of bird species distribution to the vegetation, this study compares the bird species communities in autumn 1990 and spring 1991 along a vegetation gradient. This gradient includes different plant associations typical of dry forest and oak woodland in western Mexico. A subset of the original study samples was visited in autumn 1991 and spring 1992 in order to assess intra-seasonal changes between different years.
Material and methods
The study sites are located in the state of Jalisco, Mexico (20°20 N and 103°35 W), and consist of four large patches of relatively intact dry forest and oak woodland. These patches range from 865 to1920 ha in size and are situated within 15 km of each other (Corcuera and Butterfield 1999). A total of 107 plots or sampling units (SUS) were positioned through the vegetation gradient from dry forest to oak woodland. Each one of this was used to count the birds in the first year and a subset of 67 plots in the second.
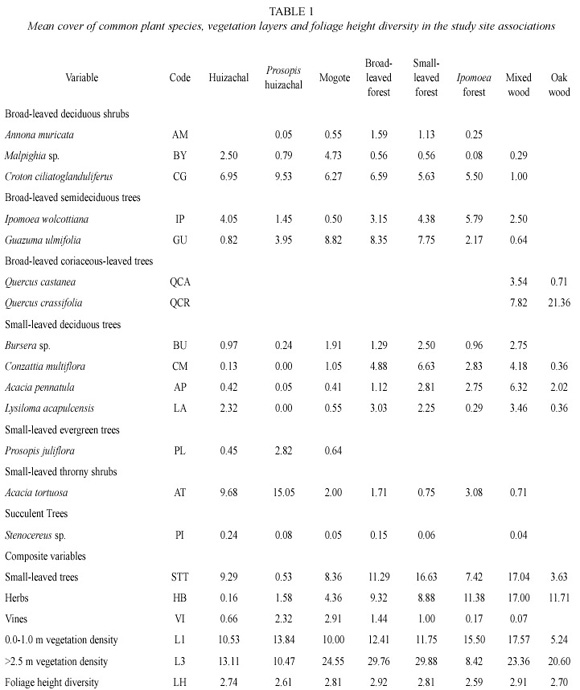
The plant composition and abundance was obtained for each sample unit (the method used is described below). A plant species classification of the 107 SUS based on previous results (Corcuera and Butterfield 1999) subdivided the vegetation in the following groups: 1. thorn forest (in which the small-leaved thorny shrub Acacia tortuosa (L.)Willd. or huizache, is the dominant plant species), 2. Prosopis huizachal (which is a thorn forest in which the smallleaved evergreen tree Prosopis juliflora (SW) D.C. is abundant), 3. mogote (represented by patches of broad-leaved forest surrounded by thorn forest), 4. broad-leaved forest (where broad-leaved trees such as Guazuma ulmifolia Lam. and Heliocarpus appendiculatus Turcz. are dominant), 5. small-leaved forest (dominated by small-leaved trees such as Acacia pennatula (Schdl. & Cham.)Benth. and Conzattia sericea (Standl.) 6. Ipomoea forest (in which the broad-leaved deciduous tree Ipomoea wolcottiana Rose is visually conspicuous), 7. mixed woodland (which may be regarded as an ecotone between dry forest and oak woodland since it has floristic components of both vegetation types) and, 8. Oak woodland (composed mainly by the oak Quercus crassifolia Humb. & Bonpl.). Annual precipitation was 761 mm with most of the rain falling between mid-June and mid- September. The second year of the project was anomalous as, due to El Niño effect, 300 mm of rain fell in January, the highest winter precipitation in at last the past 18 years.
Plant composition, stratification and structure were estimated for each of the 107 plots during November and December 1990. A 2m x 2mm diameter lead rod was used to estimate covers of plants less than 2.0 m tall. The rod was positioned perpendicular to the ground and all the plant species touching it were recorded. This procedure was repeated 40 times for each of the plots. For higher vegetation an optical square marked with two perpendicular axes was used (adapted from Montaña and Ezcurra 1980). Every plant species present in the intersection was recorded. Species-area (or number of touches in this case) curve were drawn (Grieg-Smith 1983) and they all tended to stabilize (i.e. very few new species kept appearing when reaching the 40 replicates) indicating that 40 replicates per stations were sufficient.
The same procedure as for plant composition was used to measure the density of the vegetation but this time, regardless of the species, the height of any plant touching the rod or present in the intersection of the lines drawn on the optical square was recorded. Total cover was determined by the number of times a plant was recorded. The vegetation density corresponding to the 0-1.0 m, 1.0-2.5 m and <2.5 m layers was also recorded.
Stratification was determined by recording vegetation in each of the following vegetation layers: half meter intervals to 3.0 m and then, 3.0-4.5 m, 4.5-6.0 m and >6.0 m. The Shannon- Wiener diversity index was then used to obtain the foliage height diversity. Table 1 includes the values of each variable in each of the vegetation types obtained by the plant classification of the 107 SUS.
Several techniques were considered to estimate the number of birds in the study area. The large amount of time needed for some quantitative methods (i.e. spot mapping) and their inadequacy outside the breeding season, made them inappropriate for the present research purposes. On the other hand, the rugged terrain and the high density of the vegetation in the area impeded or even made impossible the use of transect methods, therefore a circular-plot technique (DeSante 1981) was considered to be the most suitable method and was implemented.
Since detectabilities in different plot sizes vary from one vegetation type to another (and from one observer to another), a particular radius was subjectively chosen. A 25 m radius has been used in a similar but denser vegetation by Hutto (1986). In the present study, a 30 m radius was considered appropriate and Hutto agreed with this choice (pers. comm.). The duration of counts should be long enough so that all the birds present are recorded but short enough so that the probability of counting the same bird more than once is minimized (Reynolds et al. 1980). A 10 minute period seemed adequate as new species were seldom detected after this length of time.
Between September-December 1990 and March-April 1991 the birds heard and seen in the 107 SUS were recorded. In September- December 1991 and March-April 1992, 67 of the original 107 SUS were used to estimate the second year bird abundances.
Ideally, a number of replicates in homogeneous vegetation would have been used as the sampling unit of the study. This approach was not possible because no sites with relatively large areas (sufficiently large to include at least 10 plots with a 100 m distance between them for example) of homogeneous vegetation could be found.
If the vegetation types (obtained by the plant classification) were used, some noise could be included in the sense that birds observed in one plot could be there by chance, particularly if their favored habitat is located near the area being sampled (which could in itself be a suboptimal habitat). These problems were avoided by using each plot as a sampling unit.
Bibby et al. (1985) used individual plots for an ordination of the birds in British plantations and the same approach was used here. Individual plots are not completely independent and pseudo-replication difficulties arise because the sample units on each site are likely to share more species between them than with those located in other site (Hurlbert 1984). This problem can be partially avoided by keeping a reasonable distance between plots (Reynolds et al. 1980). After a trial period, in which each site was visited at least one time, each plot was visited three times. The mean number of birds seen or heard in the three visits was used for the analysis.
Canonical correspondence analysis (CCA), derived from reciprocal averaging (Ter Braak 1988) was used to analyse bird species distribution in relation to vegetation parameters. This technique includes a regression model which relates the species axes to the environmental variables. The relationship between the ordination axes and the vegetation variables were tested from 99 Monte Carlo permutations, as suggested by Ter Braak (1988).
The performance of the bird species along the main ordination gradient was analysed with Generalised Linear Models (GLIM=s, Crawley 1993). This approach is useful to predict the probability of any bird species being present (in a sampling unit, in this case) at a given point along the gradient. We assumed a binomial distribution for presence/absence data and used a logit transformation to link this distribution with the linear predictor (Austin et al. 1984). The independent variables were the first ordination axis and its quadratic form to allow a non- monotonic response. The probability of presence was defined by the model:
P=elp/(1+elp)
where,
P=probability of presence, lp=linear predictor (a+bx+cx2), e=2.7183, the base of natural logarithms, x=score values of axis 1.
The goodness of fit for the model was assessed by the analysis of the change in the residual deviance which approximates a Chisquare distribution.
Results
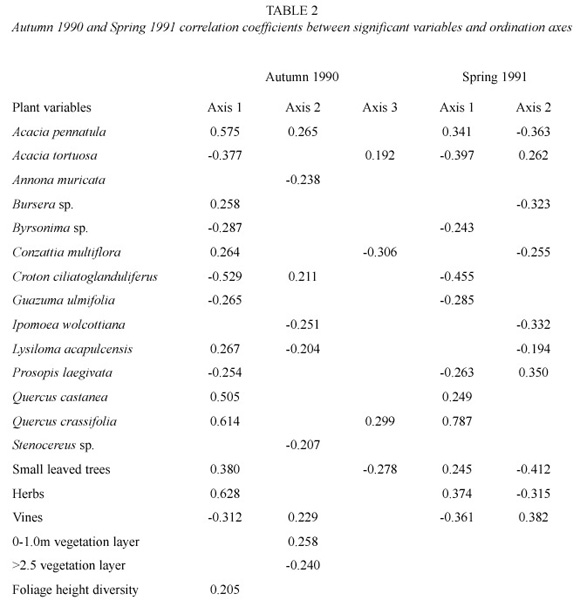
The relationship between the first three bird species ordination axes and the vegetation variables in autumn 1990 was significant according to Monte Carlo permutations (99 permutations, p<0.05).
The first ordination axes (eigenvalue= 0.240) separated forest from woodland birds. The second axis (eigenvalue=0.141) reflected the distribution of the Yellow-rumped Warbler Dendroica coronata. This species had a very high relative abundance in unique SUS during this season and can be considered an outlier according to the definition by Gauch (1982). Its distribution was associated with thorn forests in which Ipomoea wolcottiana and >2.5m trees were present (Table 2). We will consider the possible reasons of the unique distribution of this species in the discussion and here will only emphasize the fact that when this species was removed from the analysis, the second axis became very similar to the third one (eigenvalue=0.083), confirming the influence of this bird in the ordination. The correlation coefficients between the significant variables and the ordination axes are shown in Table 2.
Because of the strong influence of a single bird species on the second axis, the third axis was considered more relevant to analyse the distributional tendencies of the bird community as a whole. The first and third axes ordination of the SUS is shown in Fig. 1. The SUS are represented by numbers corresponding to the vegetation group to which they belong and it was possible to identify five habitats according to the ordination values of the SUS and to the variables with which each group was correlated.
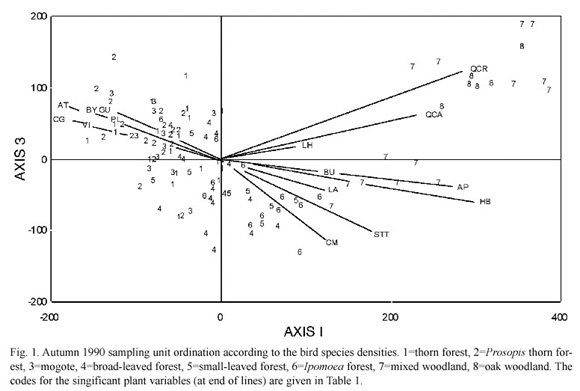
The first habitat defined by the bird species ordination included most dry forests (vegetation associations 1, 2, 3 and 4) and was associated with Croton ciliatoglanduliferus Ortega, Acacia tortuosa, the vines, Guazuma ulmifolia and Byrsonima sp. (Fig. 1). A second habitat (which we named Ipomoea/smallleaved- tree forest), which was associated with the small-leaved trees and Conzattia multiflora (Robinson)Standley, included most of the Ipomoea forest (6) and most small-leaved forest SUS (5). Some of the mixed woodland SUS (7) represent a third habitat (mixed woodland) which forms a bridge between Ipomoea forests and oak woodlands (8) and was associated with the herbs, Bursera spp. and Acacia pennatula. The mixed woodland SUS which are geographically closer to the oak woodlands were somehow separated from those closer to forests and were related to Quercus crassifolia and Q. castanea Née (Fig. 1).
The forest SUS could be further subdivided according to the third axis ordination values. The SUS with positive values were those correlated with the Acacia forest variables (Acacia forest), while those with negative scores (other Acacia forests) were correlated with C. mutliflora and the small-leaved tree forests (Fig. 1).
Due to the large number of species and variables in the ordination bi-plots and in order to facilitate the comparison of the two years, the bird species distribution is presented in tabular form. Nevertheless, it has to be remembered that the vegetation units are not discreet entities; the changes in the distribution of the birds are continuous throughout the vegetation gradient. The comparison was based on the first year ordination. This was done by obtaining the mean abundance of the birds found in each of the five previously defined habitats. The bird species were then arranged according to their first axis ordination scores and their relative abundance (proportion of the total count) was estimated for each habitat (Table 3).
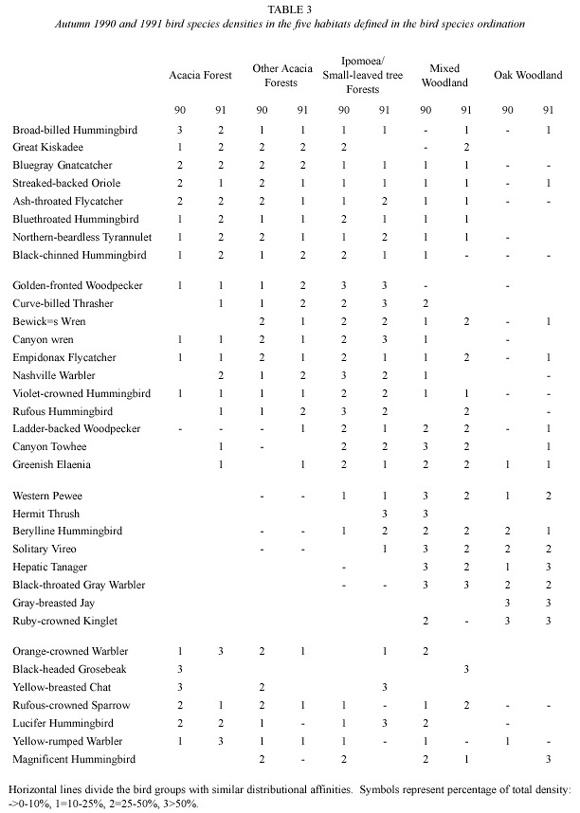
Most bird species had a unique distributional pattern but at the same time it is clear that certain groups had similar distributional ranges in the two years. More particular, a gradient from birds occuring in Acacia forests to those observed in oak woodland can be recognized (Table 3).
In one extreme, bird species such as the Broad-billed Hummingbird Cynanthus latirostris, the Great Kiskadee Pitangus sulphuratus, the Blue-grey Gnatcatcher Polioptila caerulea and the Streaked-backed Oriole Icterus pustulatus were mainly found in Acacia forests (Table 3). The Ash-throated Flycatcher Myiarchus cinerascens, the Blue-throated Hummingbird Lampornis clemenciae, the Northern-beardless Tyrannulet Camptostoma imberbe and the Black-chinned Hummingbird Archilocus alexandri were also forest birds but equally common in Ipomoea/small-leaved tree forests and other Acacia forests.
The Golden-fronted Woodpecker Melanerpes aurifrons, the Curve-billed Thrasher Toxostoma curvirostrae, the Bewicks Wren Tryomanes bewickii, the Canyon Wren Catherpes mexicanus, the Empidonax flycather, the Nasvhville Warbler Vermivora ruficapilla, the Violetcrowned Hummingbird Amazilia violiceps and the Rufous Hummingbird Selasphoros rufus were commonest in Ipomoea/small-leaved forests (Table 3), while the Ladder-backed Woodpecker Picoides scalaris, the Canyon Towhee Pipilo fuscus, the Greenish Elaenia Myiopagis viridicata also common in smallleaved tree forest) were equally or more abundant in mixed woodlands (Table 3).
Finally, the Western Pewee Contopus sordidulus, the Berylline Hummingbird Amazilia berillyna, the Solitary Vireo Vireo solitarius, the Hepatic Tanager Piranga flava, the Blackthroated Grey Warbler Dendroica nigrescens, the Gray-breasted Jay Aphelocoma ultramarina and the Ruby- crowned Kinglet Regulus calendula which were mixed and oak woodland birds (Table 3). the Hermit Thrush Catharus guttatus was found in woodlands in 1990 but was commonest in small- leaved tree forests in the second year.
There were five bird species which were either ubiquitous or seemed to have a random distribution (the Orange-crowned Warbler Vermivora celata, the Rufous-crowned Sparrow Aimophila ruficeps, the Lucifer Hummingbird Calothorax ruficeps, the Magnificent Hummingbird Eugenes fulgens and the Yellowrumped Warbler). In addition, The Black-headed Grosbeak Pheuticus melanocephalus was present in thorn forests in 1990 but was only found in mixed woodland in 1991 while the Yellowbreasted Chat Icteria virens was commonest in thorn forests in 1990 but was only present in small-leaved tree forests in 1991.
In spring 1991 the first two axes were significant (99 Monte Carlo permutations, p<0.05). The SUS ordination (Fig. 2) shows that Prosopis thorn forests (2) and mogotes (3) were segregated from other forests which included SUS from thorn forests (1), small-leaved forests (5) and Ipomoea forests (6). As in autumn, mixed woodland (7) again formed a link between dry forests and oak woodlands (8). The ordination bi-plot of the SUS also shows the significantly correlated variables (Fig. 2).
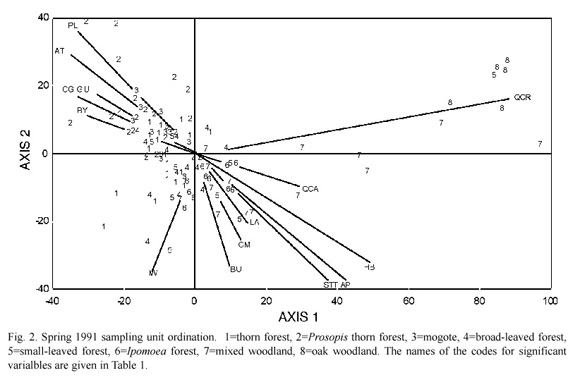
As in autumn 1990, Quercus crassifolia and Croton ciliatoglanduliferus were significantly correlated with the first ordination axis (eigenvalue=0.326) and had the highest correlation coefficients (Table 2). As in the autumn ordination, the first axis again separated woodlands from forests.
The second axis ordination (eigenvalue= 0.127) emphasized on the separation of Ipomoea forests from other forests associated with Ipomoea wolcottiana, the small-leaved trees and the vines (Table 2).
Three groups of bird species could be recognized according to the spring ordination. The first group includes 14 species which were particularly abundant in the Acacia/Prosopis and the Acacia/Ipomoea forests. The Broad-billed Hummingbird, the Rusty-crowned Groundsparrow Melozone kieneri, the Canyon Wren and the Sinaloa Wren Thryothorus sinaloa were commonest in the first habitat in the first year but birds such as the Streaked-backed Oriole, the Ladder-backed Woodpecker, the Blue Grosbeak Guiraca caerulea, the Godenfronted Woodpecker and the Empidonax Flycatcher favoured the two habitats in the two springs (Table 4).
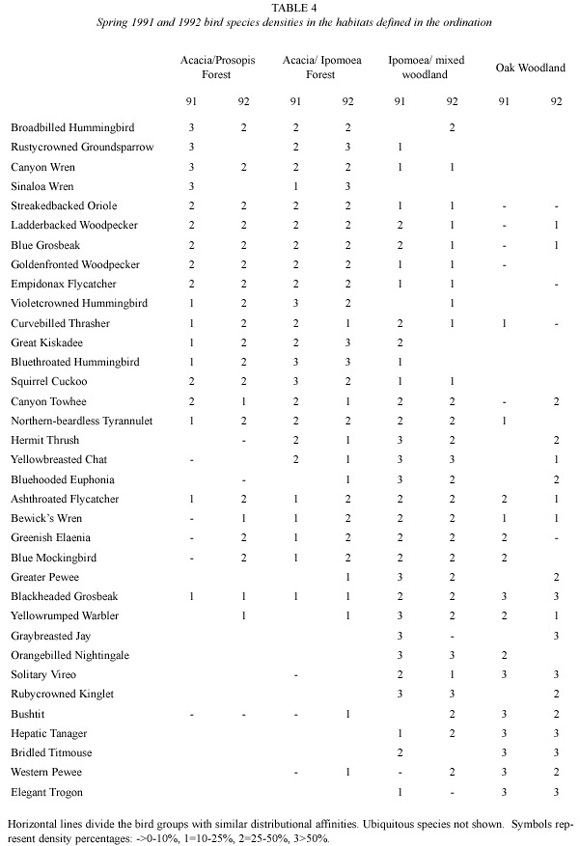
A second group of birds had a broader distribution but were consistently found in the Ipomoea/mixed woodland habitat. This group of birds includes the Hermit thrush, the Yellow- breasted Chat, the Blue-hooded Euphonia Euphonia elegantissima and the Ashthroated Flycatcher (Table 4).
The woodland species includes 11 species of which the first six (such as the Black-headed Grosbeak, the Yellow-rumped Warbler and the Gray-breasted Jay) shared the Ipomoea/mixed woodland with the Oak woodland while Bushtit Psaltriparus minimus, the Hepatic Tanager, the Bridled Titmouse Parus wollweberi, the Western Pewee and the Elegant Trogon Trogon elegans were commonest in Oak woodlands.
In order to predict the distribution of the bird species we used the GLIM model with 14 residents which were present during the four study seasons. The results show probability of these species being present at a given point along the first ordination axis.
The ordinate in the GLIM plots (Figs. 3-4) represents the probability values while the values in the abscissa are the ordination scores for the first axis. For example, the negative values correspond to Acacia forests in the two seasons, while the Ipomoea forests range between the scores of 0-200 in autumn and slightly <0-20 in spring. Ordination scores of more than 200 in autumn and more than 40 in spring correspond to mixed and oak woodlands.
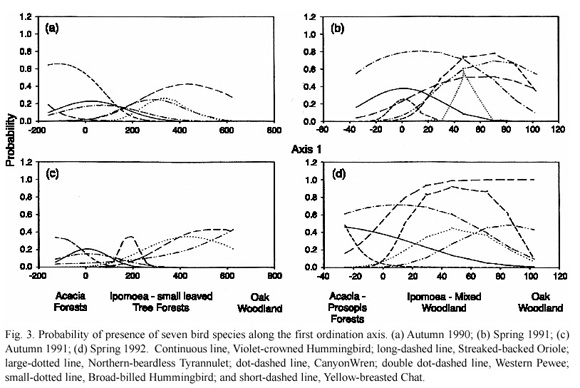
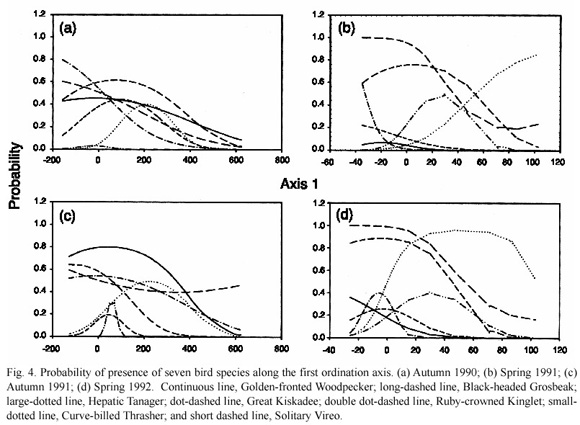
The two species with higher probabilities for Acacia forests were the Broad-billed Hummingbird and the Great Kiskadee, particularly in autumn (Fig. 3). The Goldenfronted Woodpecker and the Violet-crowned Hummingbird (and less so the Canyon Wren) were predictably commoner in mixed woodlands in autumn and in Acacia forests in spring (Fig. 3). The Streaked-backed Oriole was typical of Acacia forests in spring while the Curvebilled Thrasher was typical of Ipomoea/mixed woodlands in spring but had either different or low probabilities curves in autumn (Fig. 4).
The probability model also shows that the Northern-beardless Tyrannulet favoured Ipomoea forests and the Yellow-breasted Chat, particularly in spring (Fig. 3), while the Hepatic Tanager, the Western Pewee, the Solitary Vireo and the Ruby-crowned Kinglet favoured mixed and/or oak woodlands in the four seasons (Fig. 4). The Black-headed Grosbeak had an unpredictable distribution in autumn but had high probability values in the woodland portion of the plots in the springs (Fig. 4).
In addition, the Gray-breasted Jay and the Hermit Thrush are woodland species but their probability curves changed from mixed to oak woodland between seasons.
The remaining species were either ubiquitous (the Ash-throated Flycatcher, the Greenish Elaenia, the Empidonax Flycatcher and the Bewick=s Wren) or less predictable in their distribution due to between-year differences in the same season (the Rufous-crowned Sparrow and the Ladder-backed Woodpecker). The probability curves for the Canyon Towhee, the Blue- throated Hummingbird and the Yellowrumped Warbler also differed but showed some distributional tendencies. The Canyon Towhee was mainly present in Ipomoea and mixed woodlands in autumn (it was ubiquitous in spring), the Blue-throated Hummingbird favoured Acacia/Ipomoea forests in spring but was ubiquitous in autumn, and the Yellowrumped Warbler was ubiquitous in autumn but favoured woodlands in spring.
Discussion
The main difference between autumn and spring was evident in the SUS ordination by the bird species. In autumn the sample units were widespread in the ordination plots and each of the recognized habitats was replaced by another gradually (Fig. 1). In spring, the first axis separated forests from woodlands more abruptly (Fig. 2). Nevertheless, many of the plant variables related with the ordination axes were the same in the two seasons. Furthermore, the first axis essentially represented a vegetation gradient which traverses from Acacia forests, Ipomoea-small/leaved forest and mixed and oak woodlands in the two seasons.
The intra-seasonal comparison of the bird species distribution showed that eight bird species favoured Acacia forests in autumn, 11 favoured Ipomoea/small-leaved tree forests and eight were mixed and oak woodland species. Nevertheless, the forest species were also present in Ipomoea forests and mixed woodlands. The Ipomoea/small-leaved tree forest species were present in other habitats as well but their relative abundances tended to be highest in this habitat. Woodland species were more restricted and only the Western Pewee, the Berylline Hummingbird and the Hepatic Tanager were seen in Acacia forests.
Since conditions in dry forests fluctuate greatly and resources are somehow unreliable, the birds from these communities tend to be generalists and opportunistic (Poulin et al. 1993). The fact that they have to be more opportunistic could explain their wider habitat spread in dry forests with respect to woodlands.
In addition, six species differed in their habitat use between the two autumns and therefore were considered to have unpredictable distributions (the Orange-crowned Warbler, the Black-headed Grosbeak, the Yellow-breasted Chat, the Rufous-crowned Sparrow, the Lucifer Hummingbird, the Magnificent Hummingbird and the Yellow-rumped Warbler).
In spring 14 species were commonest in Acacia and Acacia/Ipomoea forests while 10 species favoured Ipomoea/mixed woodland and 12 were woodland species. The Yellow Warbler, the Rufous-crowned Sparrow and the Brown-headed Cowbird had unpredictable distributions.
The segregation between forest and woodland birds in the bird species ordination was not unexpected since similar tendencies have been documented in other studies in which marked vegetation changes coincide with abrupt changes in the bird species distribution (Terborgh 1977, Noon 1981, Navarro 1992).
Avifaunal differences between geographically close but physiognomically different vegetation types has been explained by Hutto (1985) who suggests that birds may have a species specific template (innate or learned) which represents a suitable habitat. The habitats that fit this template may then provide certain "cues" (i.e. other bird species, food and microclimate), which makes individuals settle in a particular area of the chosen habitat (or microhabitat).
At a more local scale, there have been contradictory findings regarding the segregation of birds in plant associations belonging to a general vegetation type (the Acacia forests, Ipomoea/small- leaved forests and mixed woodlands in this study may be regarded as different dry forest habitats). Roth (1977) for example, studied four brush-grasslands in North America and found substantial differences in bird species composition and relative abundance between four associations. Naranjo and Raitt (1993) found that the breeding bird assemblage differed significantly among three physiognomically different vegetation types in the Chihuahuan desert in North America.
In this study, the bird species distribution changed gradually between the habitats which were identified in each season. Nevertheless, there were groups of birds either in the four seasons or in each season of the two years which may be regarded as indicator species (i.e. the broad- billed hummingbird favoured Acacia forests while the Curve-billed Thrasher favoured Acacia and Ipomoea forests in the four seasons, while the Streaked-backed Oriole and the Yellow- breasted Chat were either ubiquitous or unpredictable in autumn but favoured Acacia and Ipomoea forests in spring).
Furthermore, the importance of Ipomoea/ small-leaved-tree forests in autumn and Ipomoea/mixed woodlands in spring was unexpected. Partly, the Ipomoea SUS were located between forests and woodlands and therefore can be regarded as an ecotone in which both forest and woodland species coincide but the fact that Ipomoea forests had higher abundances of many bird species in the two seasons makes this a unique habitat. Ipomoea wolcottiana is a widely used foraging plant used by many hummingbirds and warblers (in press) but wrens, flycatchers and other birds favoured this habitat in the two seasons and therefore its uniqueness might be related to physiognomic factors which should be further explored.
The probability model corroborated the distributional patterns found in the ordination and helped to identify indicators among some species found in the four study seasons. Only the Broad- billed Hummingbird and the Great Kiskadee (in three seasons) were typical of Acacia forests. Two other species, the Curve-billed Thrasher and the Golden-fronted Woodpecker tended to favour Ipomoea forests in at least three of the four seasons, while the Canyon Wren and the Violet-crowned Hummingbird were somehow ubiquitous in autumn but favoured Acacia and Ipomoea forests in the two spring. On the other hand there were six species which were characteristic of woodlands in the four seasons (the Ruby-crowned Kinglet, the Western Pewee, the Hepatic Tanager, the Solitary Vireo).
Finally, the Ash-throated Flycatcher was ubiquitous (with a certain preference for Acacia forests in autumn) and the Rufous-crowned Sparrow had an unpredictable distribution in the four seasons.
The Yellow-rumped Warbler was a special case. It was very abundant in the first autumn and its distribution influenced the second axis of the autumn ordination. In autumn it was rather ubiquitous but was related to Ipomoea wolcottiana and other species typical of forests with relatively tall trees. During both springs, its distribution was associated with woodlands. In autumn, the Yellow-rumped Warbler is composed of three sub-species; the Myrtle Warbler (Dendroica coronata coronata), the Goldmans Warbler (D. coronata goldmani) and the Myrtle Warbler (D. coronate auduboni). Some populations of the Myrtle Warbler may breed in the oak woodlands present in the study area. Transients and winter visitors of the Myrtle Warbler are typical of deciduous forests (Howell and Webb 1995), which might explain the drastic changes in habitat use of this species.
Due to the influence of the work by MacArthur and MacArthur (1961), during two decades, most bird community ecologists thought structure was a decisive influence controlling bird species diversity (Pearson 1975, Recher 1969).
Fuller and Henderson (1992) sustain that since the paradigm was so widely accepted, many ecologists tried to explain bird species distribution in terms of simple measures of the vegetation structure. These authors believe that floristic relations might even be obscured by loss of information resulting from condensing vegetation structure and composition into one of two indices. In fact, the important role floristics may have on the bird species distribution has been confirmed in many studies (James and Wamer 1982, Rotenberry 1985, Peck 1989, Bibby et al. 1985).
This study suggests that particular plant species were more significant than the vegetation structure in the determination of the bird species distribution in a dry forest; the structural variables that were measured -as opposed to the compositional variables- were not significant in the ordination analyses. Nevertheless the significant plant variables were unlikely to be very important since, in most cases, birds did not use them for nesting or any foraging activity. Byrsonima sp., Guazuma ulmifolia and Croton ciliatoglanduliferus for example, were significantly correlated with the first axis in all seasons, but foraging observations showed that neither was important as food provider. Other plants, such as Acacia pennatula and Lysiloma acapulcense, were significantly correlated in the two seasons but the first was not seem to be used by birds, while the second was used by frugivore-insectivores and insectivores only in spring (personal observation). The apparent unimportance of the significant plant variables in food supply agrees with Poulin et al. (1993), who found that food availability in Venezuelan dry forests was not directly linked with the bird densities. At least some significant species seem to be typical or some plant associations regardless of their use by the bird species. Other plant species, particularly those which are conspicuous (Quercus crassifolia, Prosopis laegivata) might serve as visual cues for the birds to chose an habitat.
Acknowledgments
We appreciate the useful comments of B. Pérez-García, M. A. Pérez, F. Vite and M. A. Armella. We are particularly grateful to J.C. Coulson, J.E.L Butterfield and L. Eguiarte for their helpful criticism.
Resumen
Se estudió la distribución de especies de aves a lo largo de un gradiente de vegetación bosque seco – bosque de encino en el otoño y primavera de dos años consecutivos. Las comparaciones intra-estacionales mostraron distribuciones similares de las especies de aves en ambos años. Los cambios inter-estacionales se debieron principalmente a diferencias en la composición, aunque las especies residentes normalmente usan hábitats similares en ambas estaciones. Los análisis de ordenación, basados en las abundancias de las aves en el primer año de muestreo, mostraron una distribución claramente segregada entre aves del bosque seco y del bosque de encino. Aunque la distribución de las especies fue más azarosa dentro de cada tipo de vegetación, se pudieron identificar ciertos hábitats en base a grupos de aves con distribuciones similares. Estos hábitats no correspondieron con las asociaciones vegetales identificadas. Las observaciones del uso de las plantas durante el período de estudio sugieren, en la mayoría de los casos, que las variables vegetales asociadas con los ejes de ordenación no serían muy importantes para el ciclo de vida de las especies de aves. Sin embargo, se requiere investigación adicional para comprender su verdadera función.
Palabras clave: comunidades de aves, bosque seco, bosque de encino, análisis de correspondencia canónica, modelos lineales generalizados.
References
Austin, M.P., R.B. Cunningham. & P.M. Fleming. 1984. New approaches to direct gradient analysis using environmental scalars and statistical curve-fitting procedures. Vegetatio 55: 11-27. [ Links ]
Bibby, C.J., B.N. Phillips & A.J.E. Seddon. 1985. Birds of restocked conifer plantations in Wales. J. Appl. Ecol. 22: 619-633. [ Links ]
Bilcke, G. 1984. Seasonal changes in habitat use of resident passerines. Ardea 72: 95-99. [ Links ]
Bond, R.R. 1957. Ecological distribution of breeding birds in upland forests in southern Wisconsin. Ecol. Monogr. 27: 351-384. [ Links ]
Corcuera M. del R, P. & J.E.L. Butterfield. 1999. Bird communities of dry forests and oak woodland of western Mexico. Ibis 141: 240-255. [ Links ]
Crawley, M.J. 1993. Glim for Ecologists. Blackwell Science. Oxford, England. 354 p. [ Links ]
DeSante, D.F. 1981. A field test of the variable circularplot censusing technique in a California coastal scrub breeding bird community. Studi. Avian Biol. 6: 177-185. [ Links ]
Fuller, R.H. & A.C.B. Henderson. 1992. Distribution of breeding songbirds in Bradfield Woods, Suffolk, in relation to vegetation and coppice management. Bird Stud. 39: 73-88. [ Links ]
Gauch Jr., H.G. 1982. Multivariate Analysis in Community Ecology. Cambridge University, Cambridge, England. 298 p. [ Links ]
Greig-Smith, P. 1982. Quantitative Plant Ecology. Blackwell, Oxford, England. 359 p. [ Links ]
Howell, S.N.G. & S. Webb. 1995. A Guide to the Birds of Mexico and Northern Central America. Oxford University, Oxford, England. 797 p. [ Links ]
Hulbert, S.H. 1984. Pseudopreplication and the design of ecological field experiments. Ecol. Monogr. 54: 187-211. [ Links ]
Hutto, R.L., S.M. Pleteschet & P. Hendricks. 1986. A fixed-radius point count method for nonbreeding and breeding season use. Auk 103: 593-602. [ Links ]
Hutto, R.L. 1985. Habitat selection by nonbreeding, migratory land birds. p. 455-476. In L.C. Cody (ed.). Habitat Selection in Birds. Academic, New York. 538 p. [ Links ]
James, F.C. & N.O. Wamer. 1982. Relationship between temperate forest bird communities and vegetation structure. Ecology 63: 159-171. [ Links ]
López, G. & M.J. Moro. 1997. Birds of Aleppo pine plantations in south-east Spain in relation to vegetation composition and structure. J. Appl. Ecol. 34: 1257-1272. [ Links ]
MacArthur, R.H. & J.W. MacArthur. 1961. On bird species diversity. Ecology 42: 594-598. [ Links ]
Montaña C. & E. Ezcurra. 1980. Simple instrument for quick measurement of crown projections. J. For. 78: 699. [ Links ]
Morrison, M.L., K.A. With & I.C. Timossi. 1986. The structure of a forest bird community during winter and summer. Wilson Bull. 98: 214-230. [ Links ]
Naranjo, L.G. & R.J. Raitt. 1993. Breeding bird distribution in Chihuahuan desert habitats. Southwest. Nat. 38: 43-51. [ Links ]
Navarro, A.G. 1992. Altitudinal distribution of birds in the Sierra Madre del Sur, Guerrero, Mexico. Condor 94: 29-39. [ Links ]
Noon, B.R. 1981. The distribution of an avian guild along a temperate elevational gradient: the importance and expression of competition. Ecol. Monogr. 51: 105-124. [ Links ]
Pearson, D.L. 1975. The relation of foliage complexity to ecological diverstiy of three amazonian bird communities. Condor 77: 453-466. [ Links ]
Peck, D.M. 1989. Tree species preferences shown by foraging birds in forest plantations in Northern England. Biol. Conserv. 48: 41-57. [ Links ]
Poulin, B., G. Lefebvre & R. McNeil. 1993. Variations in bird abundance in tropical arid and semi-arid habitats. Ibis 135: 432-441. [ Links ]
Raitt, R.J. & S.L. Pimm. 1976. Dynamics of bird communities in the chihuahuan desert, New Mexico. Condor 78: 427-442. [ Links ]
Recher, H.F. 1969. Bird species diversity and habitat diversity in Australia and North America. Am. Nat. 103: 75-80. [ Links ]
Reynolds, R.T., J.M. Scott & R.A. Nusbaum. 1980. A variable circular-plot method for estimating bird numbers. Condor 82: 209-313. [ Links ]
Rotenberry, J.T. 1985. The role of habitat in avian community composition: physiognomy or floristics? Oecologia 67: 213-217. [ Links ]
Roth, R.R. 1977. The composition of four bird communities in South Texas brush-grasslands. Condor 79: 417-425. [ Links ]
Ter Braak, C.J.F. 1988. CANOCO - a FORTRAN program for canonical community ordination by (partial) (detrended) (canonical) correspondence analysis, principal components analysis and redundancy analysis (version 2.1). Agricultural Mathematics Group. Technical report: LWA-88-02. The Netherlands. [ Links ]
Terborgh, J. 1977. Bird species diversity on an Andean elevational gradient. Ecology 58: 1007-1019. [ Links ]

