


 Articulo en XML
 Referencias del artículo
 Enviar articulo por email
 Citado por SciELO
  Similares en
SciELO
Similares en
SciELO  uBio
uBio 
 Permalink
Revista de Biología Tropical
versión On-line ISSN 0034-7744versión impresa ISSN 0034-7744
Rev. biol. trop vol.53 supl.1 San José may. 2005
Biomass,litterfall and decomposition rates for the fringed Rhizophora mangle forest lining the Bon Accord Lagoon,Tobago
Rahanna A.Juman
Institute of Marine Affairs,Hilltop Lane,Chaguaramas,Trinidad and Tobago;Rjuman@trinidad.net
Received 15-I-2004. Corrected 13-VII-2004. Accepted 29-III-2005.
Abstract:The mangrove forest that fringes the Bon Accord Lagoon measures 0.8 km2 and is dominated by red mangrove (Rhizophora mangle ).This forest forms the landward boundary of the Buccoo Reef Marine Park in Southwest Tobago,and is part of a mangrove-seagrass-coral reef continuum.Biomass and productivity,as indicated by litterfall rates,were measured in seven 0.01 ha monospecific plots from February 1998 to February 1999,and decomposition rates were determined. Red mangrove above-ground biomass ranged between 2.0 and 25.9 kg (dry wt.)m-2 .Mean biomass was 14.1 ±8.1 kg (dry wt.)m-2 yielding a standing crop of 11 318 ±6 488 t. Litterfall rate varied spatially and seasonally.It peaked from May to August (4.2-4.3 g dry wt.m-2 d-1 )and was lowest from October to December (2.3-2.8 g dry wt.m-2 d-1 ).Mean annual litterfall rate was 3.4 ±0.9 g dry wt.m-2 d-1 .Leaf degradation rates ranged from 0.3%loss d-1 in the upper intertidal zone to 1%loss d-1 at a lower intertidal site flooded by sewage effluent.Mean degradation rate was 0.4 ±1%loss d-1 .The swamp produces 2.8 t dry wt.of litterfall and 12 kg dry wt.of decomposed leaf material daily.Biomass and litterfall rates in Bon Accord Lagoon were compared to five similar sites that also participate in the Caribbean Coastal Marine Productivity Programme (CARICOMP).The Bon Accord Lagoon mangrove swamp is a highly productive fringed-forest that contributes to the overall productivity of the mangrove-seagrass-reef complex.
Key words :Rhizophora mangle ,biomass,litterfall rates,CARICOMP,Bon Accord Lagoon.
Mangrove swamps are one of the most productive aquatic ecosystems,covering 170 600 km2 (Lacerda et al.2001)of tropical and subtropical coastlines worldwide.These halophytic plants are of great energetic importance because they provide detrital material to both lagoon and ocean consumers (Robertson and Daniel 1989, Twilley et al.1992,Ewel et al.1998),and they serve as habitats for larvae,juveniles and adults of estuarine and marine organisms (Parrish 1989, Robertson and Blaber 1992,Tobias 2001) making these areas critical for coastal fisheries (Flores-Verdugo et al.1992).
The Bon Accord Lagoon (BAL)mangrove forest is the largest remaining mangrove system in southwest Tobago,and is part of a mangrove-seagrass-coral reef continuum. This forest has been increasingly subjected to human impacts,such as pollution and encroachment for housing.The present study quantifies the amount of standing crop and primary productivity this forest contributes to the lagoon and adjacent ecosystems,by analysing the litter dynamics,which is currently seen as a prerequisite for understanding the high productivity of mangrove systems (Wafar et al.1997). Productivity data will be compared to existing monitoring datasets from CARICOMP.
Materials and methods
Site description
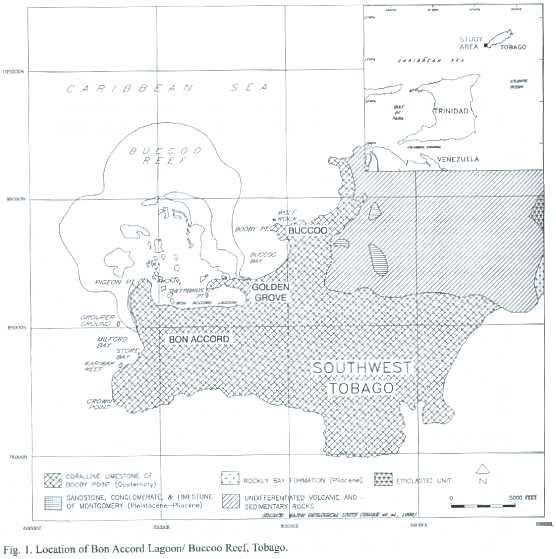
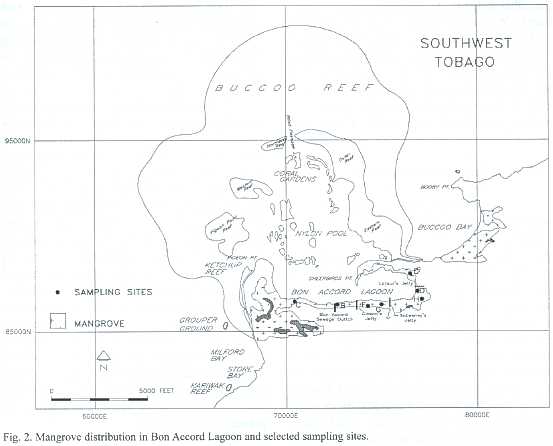
The mangrove-fringed BAL and adjacent Buccoo Reef (BR)are located on the leeward coast of south Tobago between 11 °08 ' to 11 °12 'N and 60 °40 ' to 60 °51 'W (Fig.1). BAL has a surface area of 1.2 km2, and forms the southern boundary of the Buccoo Reef Marine Park,a reef-seagrass-mangrove ecosystem complex (Fig.2).This complex covers an area of 7 km2 ,and receives land-based run-off from a watershed of 7.7 km2 in a built-up part of southwestern Tobago.
Tobago experiences a tropical climate with pronounced dry (January-April)and wet seasons (June-November)and a mean annual ambient temperature of 25.7 °C (Berridge 1981).May and December are transitional months between seasons. Southwest Tobago receives a mean total rainfall of 1415 mm yr-1, 84%of which occurs during the wet season, based on rainfall statistics for Crown Point from 1969 to 1978 (Anonymous 1982).
The mangrove forest in the BAL is a fringed-forest type,dominated by red mangrove,Rhizophora mangle L.;white mangrove Laguncularia racemosa Gaertn.,black mangrove Avicennia germinans L.,and buttonwood mangrove Conocarpus erectus L.trees are interspersed along the landward zone of this system.The fringe covers 0.9 km2 of which 0.1 km2 are open ponds,and varies in width from 20-70 m.The lower intertidal zone of the forest is subjected to tidal flushing twice a day.
BAL tide is mixed,mainly semidiurnal with a significant diurnal inequality (Kjerfve 1981), i.e.a large difference in high and low water level peaks within any one day.The average spring tidal range equals 0.78 m,and the average neap tidal range equals 0.4 m.The lagoon is on average 2 m deep and is well-flushed,with a reasonably high rate of tidal exchange between the lagoon and the adjacent coral reef (Juman 2004). The 50%turnover time is mostly affected by the 0.7 m tides and is short,only somewhat longer than one day (Juman 2004).Tidal circulation is mainly responsible for instantaneous currents, transport and exchange in the lagoon.There is no riverine inflow,merely ephemeral steams and surface drains,and the average annual fresh-water discharge rate from surface runoff only measures 0.1 m3 s-1 (Juman 2004).Two drains: Latour s and Bon Accord Sewage outfall carry land-based runoff from a cattle farm,housing development,and sewage treatment plant into the lagoon via the mangrove forest.
Sampling methods
Field sampling was conducted monthly from February 1998-February 1999.Aerial photographs (taken by Survair International Limited in 1994,at elevation 1800 m.a.s.l.,at scale 1:12 500;FS160,f/4.0)were used to map and measure the extent of the ecosystems as well as geographical and man-made features. This was then corroborated by ground truthing. The resultant maps were also used to select sampling sites (Fig.2).
Climate
The Trinidad and Tobago Meteorological Unit,located at Piarco Airport,Trinidad provided daily rainfall and minimum and maximum air temperature data from March 1998 to February 1999.These measurements were made at the weather station located at Crown Point Airport,Tobago;3.5 km south of the Bon Accord Lagoon ecosystem.Rainfall data was collected every 6 hr,starting at 0800 local time, while temperature data was collected hourly at 10 m elevation.
Mangrove forest structure
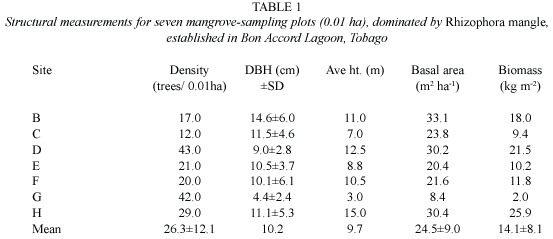
Seven 10 x 10 m (0.01 ha)plots were randomly selected throughout the fringe red mangrove forest (Plots B –H, Fig.2). Forest structure measurements,such as height (using a clinometer)and diameter at breast height (dbh)were taken at each site,once during the sampling year.These measurements were used to determine density,basal area and aboveg-round biomass.Density was reported as the number of trees within 0.01 ha plots.Basal area was calculated using the equation:0.00007854 d2 ,where d =dbh (cm)(Cíntron and Novelli 1984).Basal areas for individual trees were summed together for each plot.Total above ground biomass (B)of red mangroves was calculated using published allometric equation from Cíntron and Novelli (1984):
B (g)=b [(d )2 (h )m]
Where b=125.9571,d=dbh (cm),h=height (m),and m=0.8557.Total biomass for each plot was calculated by summing individual tree measurements and expressing the result as kg m-2. Structural measurements were compared with that of other red mangrove forests in the region.
Mangrove primary productivity
The most common method for measuring litter production in mangrove systems is the use of litter traps.Ten litter traps were deployed at regular intervals,five parallel and five perpendicular to a transect line,in each of the seven sampling plots (Fig.2) (Anonymous 1994).Each trap was 50 x 50 cm (0.25 m2 )in dimension,consisting of a wooden frame onto which 1 m2 of nylon mesh (mesh size 1.5 mm) was attached.These traps were tied to the prop roots of the mangrove tree, approximately 1m above ground so that they would not be inundated by high tides.
The litterfall in each trap was collected at the end of each month from March 1998-February 1999.The collection interval was chosen for logistic reasons,and losses by decomposition were assumed to be minimal.The leaf litter was dried to constant weight at 70 °C (Fisher Isotemp Oven 300 Series)and then sorted into species and divided into leaves, bracts, fruits, flowers,propagules,wood and frass (faeces and miscellaneous debris from herbivore grazers) (Anonymous 1994). Each fraction was weighed and the weight recorded.Litter fall was calculated as rate of fall in g m-2 d-1 and was compared to other similar forests in the Caribbean.Analysis of variance was used to examine spatial and temporal differences and Pearson s Correlation Matrix was applied to determine if there were correlations between litterfall,rainfall and temperature,as well as between the different components of the litterfall.
Decomposition rate of red mangrove leaves
Decomposition rates of red mangrove leaves were measured to determine the rateat which nutrients are released by the mangrove system (Snedaker and Snedaker 1984). Measurements were made using decomposition bags fabricated from synthetic mesh (1.5 mm). Each bag was 10 x 15 cm in dimension and contained one leaf.Initial dry weights of the freshly picked leaves were taken and the leaves were placed in bags and tied to the forest floor. Thirty-six leaves were placed at each of the seven sampling plots (Fig.2).Three bags from each site were collected every month from March 1998-February 1999 or until decomposition was completed and all bags were empty.
After collection,the bags were taken to the laboratory and the film of decomposers on the leaves was removed by gently washing the bags in freshwater.The bags were then opened and the leaves were washed in a sieve; forceps were used to recover leaf fragments from the sieve.The leaf fragments were dried at 70 °C and dry weights were recorded.Rate of decomposition (R)was calculated for each leaf by subtracting the final weight (FW)from the initial weight (IW)and dividing by the number of days (D).
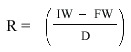
Rate of decomposition was calculated for each site by averaging the individual rates.
Results
Forest Structure
Structural measurements for trees at seven monospecific (Rhizophora mangle )sampling plots (Fig.2)are presented in Table 1. Site D was the densest plot with 43 trees/0.01 ha.Plot G had similar density to plot D,but had the smallest trees.Plot C had the fewest trees (12 trees/0.01 ha).Plot B had the largest trees in terms of girth (dbh 14.6 ±6.0)while plot H had the tallest trees (15 m).Plot H had the highest basal 34.3 m2 ha-1 and the largest biomass 25.9 kg m-2 .The ranges of values between sampling sites varied widely,indicating a forest canopy that is not uniform.Aboveground biomass was 14.1 ±8.1 kg dry wt.m-2 ,giving a total standing crop of 11 318.1 ±6488.1 t dry wt. for red mangrove trees in the lagoon.
Primary Productivity
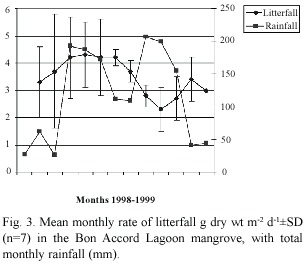
Litterfall rate varied monthly (Fig.3),and was significant at the 95%level (F=2.57,p< 0.05).Rate of litterfall peaked from May to August (4.2-4.3 g dry wt.m-2 d-1 )and was lowest from October to December (2.3-2.8 g dry wt.m-2 d-1 ).The increase in litterfall rate in May coincided with increase in monthly rainfall.In August and September rainfall decreased substantially,while mean daily temperature peaked (29.1 ºC).In October and November monthly rainfall peaked (199-207mm),but mean daily temperature had fallen to 27.6 ºC.Pore water salinity decreased in all plots after May;mean pore water salinity ranged from 43 in the dry season to 14 in the wet season.
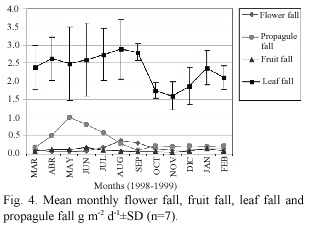
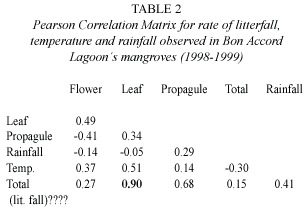
The phenology of the mangrove trees in the Bon Accord Lagoon was also assessed.Flower fall peaked between August and September, while propagule fall peaked between May and July at all sampling plots (Fig.4).Fruit and bract fall fluctuated during the year without a well-defined peak (Fig.4).There was a strong correlation between peaks in litterfall and peaks in leaf fall (Table 2).Leaf fall contributed 67% of total litterfall.
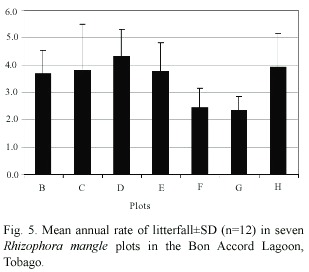
Rate of litter fall varied significantly between sampling plots (F=2.48,p<0.05)(Fig. 5).It ranged from 4.3 g dry wt.m-2 d-1 in plot D to 2.3 g dry wt.m-2 d-1 in plot G.Sampling plots that were located in the lower intertidal zone had higher rates of litterfall than plots in the upper intertidal zone (Sites G and F).Plot H had a higher rate of litterfall than plots B,C and E,although these plots were located seaward of H. Mean annual rate of litterfall for BAL mangrove forest in 1998 was estimated at 3.4 ±0.9 g dry wt.m-2 d-1, and the mangrove swamp covers an area of 0.8 km2 .Therefore total litterfall for Bon Accord Lagoon mangrove system is 2786 kg dry wt.d-1 with annual litterfall of 1017 t dry wt yr-1 .Leaf fall contributes 681 t dry wt. yr-1 ,that is 67%of the total litterfall.Using the mean dry weight –nutrient concentration of 43.23%C,0.72%N,and 0.07%P for mangrove litter (Wafer et al.1997),the total contribution by BAL mangrove forest is 440 t C,7 t N and 0.7 t P.
Decomposition rates
Decomposition rates for red mangrove leaves at all mangrove-sampling plots are presented in Table 3.While decomposition rates in the lower intertidal zone plots (C,D, and E),and at the upper intertidal plots (F,G, and H)were almost the same,the decomposition rate at plot B was four times faster.This plot was located just east of the Bon Accord Sewage outfall.Leaf degradation rate ranged from ~0.3%loss d-1 in the upper intertidal zone (F,G,H)to ~1% loss d-1 in Plot B,with a mean of 0.4 ±1%loss d-1.Decomposition rates in plots in the lower intertidal zone (C, D,E)was 50%faster than in plots in the upper intertidal zone (F,G,H).
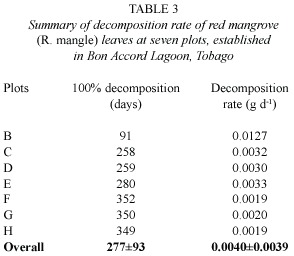
In Bon Accord Lagoon total leaf fall was 1867 kg dry wt.d-1,while the average dry weight of a single leaf was 0.63 g.The calculated number of leaves falling per day exceeded 2 900 000.If mean decomposition rate for red mangrove leaf was 0.004 g d-1 per leaf,then the total weight of decomposed leaf material per day was 12 kg dry wt.Using the dry weight-nutrient concentration of Wafer et al. (1997),this 12 kg dry weight represents 5 kg of carbon,0.08 kg of nitrogen and 0.008 kg of phosphorus.
Discussion
The canopy in Bon Accord Lagoon mangrove forest is not uniform.The structure of this forest is mostly influenced by freshwater inflow (Plot H),tidal amplitude and flushing. For instance Plot H,which was in the upper intertidal zone but flooded by a drain in the wet season had the highest biomass,while plot F which was in the upper intertidal zone and was flooded occasionally by spring high tide, had the largest number of small trees and lowest biomass.
In well-developed mangrove communities,tree size and tree density often tend to vary inversely,with consequent variations in canopy structure (Clough and Attiwill 1982). Large differences can occur in rate of accumulation of mangrove biomass as a consequence of relatively small differences in gross photosynthesis,respiration and the amount of carbon incorporated into woody material and expendable organs.These processes are particularly responsive to localized environmental conditions such as climate,tidal amplitude and flushing,freshwater-seawater interaction, nutrient inputs and surficial geology (Clough and Attiwill 1982,Kjerfve 1990).
Mangrove litterfall rate is mainly dependent on temperature,rainfall,salinity and wind (Clough 1992,Twilley et al.1997, Wafer et al.1997),and mangrove trees are an order of magnitude more productive in areas with input rom terrestrial runoff than in areas lacking external nutrient sources (Birkeland 1985). Red mangrove productivity in the Bon Accord Lagoon varied seasonally.It was highest in the rainy season (May-September)when there was increased runoff from the land resulting in lower salinities (Fig.3),and when temperatures were higher.Pool et al.(1975)suggested that mangrove litter production rates are a function of water turnover in the forest.Fewer tides result in higher soil salinity (Cíntron et al. 1978, Santos et al.1997)and/or the accumulation of toxic substances such as hydrogen sulphide (Nickerson and Thibodeau 1985),which result in increased stress. Mangrove sample plots that were located in the lower intertidal zone had higher rates of litterfall than plots in the upper intertidal zone (Sites G and F)(Fig. 5).The lower intertidal zone is flushed twice daily by tides,so that porewater salinity is close to the salinity of the flooded water,and there is no hypersaline build up. Plots in the upper intertidal zone are flooded only occasionally by mean high water spring,and when there is little upland run-off,porewater salinity builds up. Plot H,located more landward than plots B,C and E,had a higher rate of litterfall.This plot is frequently flooding by a small stream carrying runoff from a cattle farm.The stream brings nutrients as well as fresh water that lowered porewater salinity.
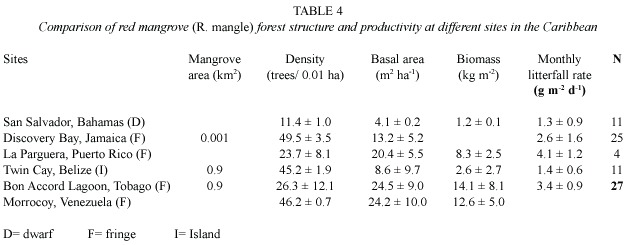
Fresh water entering the mangrove from drains was enriched with nutrients from a cattle farm and a sewage outfall,and nutrient enrichment has been shown to be beneficial to mangrove forest (Onuf et al.1977,Clough et al. 1983)leading to increased growth of the trees and corresponding increase in productivity. Mean litterfall rate for Bon Accord Lagoon mangrove forest was estimated at 3.4 ±0.9 g dry wt.m-2 d-1 .This value is within the range estimated by Brown and Lugo (1982)for riverine system (3.2 ±0.5 g m-2 d-1 ),and much higher than the value estimated for fringe systems (2.5 g m-2 d-1). Riverine systems are more productive that fringe,basin and dwarf systems (Brown and Lugo 1982),as the production of forested wetlands is dependent on water movement,not only as a source of silt and clays,but also a supply of nutrient and aeration for optimal growth (Wharton and Brinson 1979).The Bon Accord Lagoon mangrove swamp has one of the higher litterfall rate and biomass (Table 4),when compared to other CARICOMP sites.Twilley et al.(1992)suggest that there is some latitudinal variation in productivity on a global basis when all mangrove species are considered.Saenger and Snedaker (1993)found significant relationship with height of the vegetation and latitude using regression analysis of biomass and litterfall data.They suggest that height and latitude are causally related to biomass,while the relationship with litterfall reflects the specific growing conditions at the respective study sites.Biomass was higher at lower latitudes (Tobago and Venezuela)(Table 4).
Leaf degradation rate for red mangroves in Bon Accord Lagoon ranged from ~0.3%loss d-1 to ~1%loss d-1 with a mean of 0.4 ±1%loss d-1.Decomposition rates in plots in the lower intertidal zone (C,D,E)was 50%faster than in plots in the upper intertidal zone (F,G,H),and this was probably related to the high levels of mechanical litter fragmentation,and transport by tidal forces on the flooded plots,and the development of sub-surface anaerobic conditions at the less flooded plots.The unusually high decomposition rate at plot B,which was flooded by sewage effluent,was probably due to microbial populations in that area.
Frequent submergence of litter promote both leaching of tannins,and maintained moisture and temperature conditions that are conducive to saprophytic decay in the lower intertidal zone (Reice et al.1984).This is compared with limited moisture availability in the upper intertidal zone (Webster and Benfield 1986). Differences in decomposition rate along a gradient from areas less frequently flooded to areas regularly flooded were also reported by Sessegolo and Lana (1991)in Paranaguá Bay, Southeastern Brazil,and by Middleton and McKee (2001)in Belize island forests. Middleton and McKee (2001)reported mangrove leaf degradation rates of 0.2-0.43%loss d-1 ,while Robertson (1988),and Twilley et al. (1997)reported ranges of 0.2-0.55%loss d-1.
Conclusion
The red mangrove forest that lines BAL is a highly productive fringe mangrove system.Mean aboveground biomass measured 14.1 ±8.1 kg (dry wt.)m-2 yielding a standing crop of 11 318 ±6488.Productivity,as indicated by litterfall rate,varied seasonally,and averaged 3.4 ±0.9 g dry wt.m-2 d-1 .The rate of litterfall of this forest is comparable to riverine-type systems,and is among the highest for CARICOMP sites.The nutrient-rich freshwater that flows into the swamp from the cattle farm and sewage plant have no doubt enhanced the productivity.The swamp produces 2.8 t dry wt.of litterfall (1017 t wt annually),and 12 kg dry wt.of decomposed leaf material daily.Most of the litterfall in the lower intertidal zone of the forest is washed into the lagoon twice a day by ebb tides and subsequently carried across the reef.
Acknowledgments
I thank the Institute of Marine Affairs for providing funding and Peter Bacon (deceased) of the University of the West Indies who supervised and guided my work.I thank David Shim and Gerard Alleng for their valuable advice. I am also grateful to the staff of the Tobago House of Assembly who provided logistical support while conducting field surveys,and the staff of the Institute of Marine Affairs, who assisted with data analysis.I also like to acknowledge the CARICOMP network for information provided.
Resumen
El manglar que bordea la laguna de Bon Accord mide 0.8 km2 y predomina el mangle rojo (Rhizophora mangle ).Este manglar es el límite terrestre del Parque Nacional Buccoo Reef en el suroeste de Tobago,y es parte de un continuo de mangles-pastos-arrecifes.En este trabajo se midió la biomasa y productividad,mediante la caída de hojas,y las tasas de descomposición en siete parcelas monoespecíficas de 0.01 ha,de febrero 1998 a febrero 1999.La biomasa sobre el suelo del mangle rojo se registró entre 2.0 y 25.9 kg (peso seco)m-2 .La biomasa promedio fue de 14.1 ±8.1 kg (peso seco)m-2 resultando en un recurso existente de 11 318 ±6488 t.La tasa de caída de hojas varió espacial y temporalmente.El máximo fue entre mayo y agosto (4.2-4.3 g peso seco m-2 d-1 )y el mínimo entre octubre y diciembre (2.3-2.8 g peso seco m-2 d-1 ).La tasa promedio de caída de hojas fue de 3.4 ±0.9 g peso seco m-2 d-1 .La tasa de degradación tuvo un ámbito de 0.3% pérdida d-1 ,en la parte superior de la zona intermareal a 1%pérdida d-1 en la parte inferior de sitios intermareales expuestos a aguas negras.La tasa de degradación promedio fue de 0.4 ±1%pérdida d-1 .Este manglar produjo 2.8 t peso seco de hojas y 12 kg peso seco de hojas descompuestas. La biomasa y las tasas de caída de hojas en Bon Accord fueron comparadas con otros cinco sitios que participan en el Programa del Caribe de Productividad Marino Costera (CARICOMP).El de la laguna de Bon Accord es un manglar marginal altamente productivo que contribuye a la productividad total del complejo mangles-pastos-arrecifes.
Palabras clave :Rhizophora mangle,biomasa,caída de hojarasca,CARICOMP,Laguna Bon Accord.
References
Anonymous. 1982.Averages and Extremes of Meteorological Elements 2,Rainfall and other elements. Caribbean Meteorological Institute (CMI), Bridgetown,Barbados. [ Links ]
Anonymous.1994.CARICOMP Methods Manual-Level I.Manual of methods for Mapping and Monitoring of Physical and Biological Parameters in the Coastal Zone of the Caribbean.CARICOMP Data Management Centre, UWI, Mona, Kingston, Jamaica.35 p. [ Links ]
Berridge C.E.1981.Climate,p.3-8.In St.G.C.Copper & P.R Bacon (eds.).The Natural Resources of Trinidad and Tobago.Edward Arnold,London,U.K. [ Links ]
Birkeland C.1985.Ecological interactions between tropical coastal ecosystem UNEP Reg.Sea Rep.Stud. 73:1-26. [ Links ]
Brown S.&A.E.Lugo.1982.A comparison of structural and functional characteristics of saltwater and fresh-water forested wetlands,p.109-130.In B.Gopal, R.E.Turner,R.G.Wetzel &D.E.Whigham (eds.). Wetlands ecology and management .Proc.1st Int. Wetlands Conf.,New Delhi,India. [ Links ]
Cintrón G.&Y.S.Novelli.1984.Methods for studying mangrove structure,p.91-113.In S.C Snedaker &J.G.Snedaker (eds.).The mangrove ecosystem:research methods.UNESCO Monographs on Oceanographic Methodology 8,Paris. [ Links ]
Cintrón G.,A.E.Lugo,D.J.Pool &G.Morris.1978. Mangroves of arid environments in Puerto Rico and adjacent islands.Biotropica 10:110-121. [ Links ]
Clough B.F.1992.Primary Productivity and growth of mangrove forests,p.225-249.In A.I.Robertson.& D.M.Alongi (eds.).Tropical Mangrove Ecosystem. American Geophysical Union,Washington DC. [ Links ]
Clough B.F.&P.M.Attiwill.1982.Primary productivity in Mangroves,p.213-222.In B.F.Clough (ed.). Mangrove Ecosystems in Australia:Structure, Function and Management.Aust.Inst.Mar.Sci.& Aust.Nat.Univ.Press,Australia. [ Links ]
Clough B.F.,K.G.Boto &P.M.Attiwill.1983.Mangroves and sewage:a re-evaluation .Tasks for Vegetation Science 8:151-161. [ Links ]
Ewel K.C.,R.R.Twilley &J.E.Ong.1998.Different kinds of mangrove forest provide different goods and services.Global Ecol.Biog.Let.7:83-94. [ Links ]
Flores-Verdugo F.J.,F.Gonzalez-Farias,D.S.Zamorano & P.Ramirez-García.1992.Mangrove ecosystems of the Pacific coast of Mexico:distribution,structure,litterfall and detritus dynamics,p.269-288.In U.Saeliger (ed.).Coast.Plants Comm.Lat.Am.Acad.Press,Inc. [ Links ]
Juman,R.A.2004.The characterisation and ecology of the Bon Accord Lagoon,Tobago,West Indies.Ph.D Thesis,University of the West Indies,St Augustine, Trinidad,261 p. [ Links ]
Kjerfve,B.1981.Tides of the Caribbean.J.Geophys.Res. 86:4243-4247. [ Links ]
Kjerfve,B.1990.Manual for investigation of hydrological processes in mangrove ecosystems. UNESCO/UNDP Regional Mangrove Project RAS 79/002 and RAS/ 86/120,Occasional Paper.New Delhi,India.79 p. [ Links ]
Lacerda L.D.,J.E.Conde,B.Kjerfve,R.Alvarez-León,C. Alarcón &J.Polanía.2001.American Mangrove,Pp. 1-62.In L.D.Lacerda (ed.).Mangrove Ecosystems: Function and Management.Springer-Verlag,Berlin. [ Links ]
Middleton B.A.&K.L.McKee.2001.Degradation of mangrove tissues and implications for peat formation in Belizean island forests.J.Ecol.89:818-828. [ Links ]
Nickerson N.H.&F.R.Thibodeau.1985.Association between pore water sulphide concentrations and the distribution of mangroves.Biogeochemistry 1: 183-192. [ Links ]
Onuf C.P.,J.M.Teal &I.Valiela.1977.Interactions of nutrients,plant growth and herbivory in a mangrove ecosystem.Ecology 58:514-526. [ Links ]
Parrish,J.D.1989.Fish communities of interacting shallow-water habitats in tropical oceanic regions. Mar. Ecol. Prog. Ser. 58:143-160. [ Links ]
Pool D.,A.E.Lugo &S.C.Snedaker.1975.Litter productions in mangrove forest of southern Florida and Puerto Rico,Pp.213-237.In G.E.Walsh,S.C. Snedaker &H.J Teas (eds.).Proc.Int.Symp.Biol. Manag.Mangroves.Honolulu,Hawaii:East West Center. [ Links ]
Reice S.R.,Y.Spira &F.D.Por.1984.Decomposition in the mangal of Sinai:the effects of spatial heterogeneity,p.193-200.In F.D Por &I.Dor (eds.). Hydrobiology of the Mangal Dr W.Funk,the Hague, the Netherlands. [ Links ]
Robertson A.I.1988.Decomposition of mangrove leaf litter in tropical Australia.J.Exp.Mar.Biol.Ecol. 116:235-247. [ Links ]
Robertson A.I.&P.A.Daniel.1989.The influence of crabs on litter processes in mangrove forest in tropical Australia. Oecologia 78:191-198. [ Links ]
Robertson A.I.&S.J.M.Blaber.1992.Plankton,epibenthos and fish communities .Coast.Estuar.Stud. 41:173-224. [ Links ]
Saenger P.&S.C.Snedaker.1993.Pantropical trends in mangrove above-ground biomass and annual litterfall.Oecologia 96:293-299. [ Links ]
Santos M.C.F.V.,J.C.Zieman &R.R.H.Cohen.1997. Interpreting the upper mid-littoral zonation patterns of mangroves in Maranhao (Brazil)in response to microtopography and hydrology,Pp.127-144.In B.Kjerfve,L.D.de Lacerda &E.H.S.Diop (eds.). Mangrove ecosystems studies in Latin America and Africa.Paris:UNESCO and Toyko:ISME. [ Links ]
Sessegolo G.C.&P.C.Lana.1991.Decomposition of Rhizophora mangle ,Avicennia schaueriana and Laguncularia racemosa leaves in a Mangrove of Paranaguá Bay (Southeastern Brazil)Bot.Mar.34:285-289. [ Links ]
Snedaker S.C &J.G.Snedaker (eds.).1984.The mangrove ecosystem:Research Methods.Unesco Monog. Oceanograp.Method.8.251 p. [ Links ]
Tobias W.J.2001.Mangrove habitats as nursery grounds for recreationally important fish species,Great Pond, St Croix,U.S.Virgin Islands.Proc.Gulf Fish.Inst. 52:468-487. [ Links ]
Twilley R.R.,R.H.Chen &T.Hargis.1992.Carbon sinks in mangroves and their implications to carbon budget of tropical coastal ecosystems.Water Air Soil Pollut. 64:265-288. [ Links ]
Twilley R.R.,M.Pozo,V.H.Garcia,V.H.Rivera-Monroy, R.Zambrano &A.Bodero.1997.Litter dynamics in riverine mangrove forests in the Guayas River Estuary,Ecuador.Oecologia 111:109-122. [ Links ]
Wafar S.,Untawale A.G.&M.Wafar.1997.Litter fall and energy flux in a mangrove ecosystem. Estuar. Coast. Shelf Sci.44:111-124. [ Links ]
Webster J.R.&E.F.Benfield 1986.Vascular plant break-down in freshwater ecosystems. Ann. Rev. Ecol. Syst. 17:567-594. [ Links ]
Wharton,C.H.&W.Brinson.1979.Characteristics of southeastern river systems.Strategies for protection and management of floodplain wetlands and other riparian ecosystems.U.S.Department of Agriculture, Washington, D.C.,GTR-WO-12: 32-40. [ Links ]

