


Services on Demand
Journal
Article
 Article in xml format
 Article references
 Send this article by e-mail
Indicators
-
 Cited by SciELO
 -
 Access statistics
Related links
-
 Similars in
SciELO
Similars in
SciELO  uBio
uBio
Share

 Permalink
Revista de Biología Tropical
On-line version ISSN 0034-7744Print version ISSN 0034-7744
Rev. biol. trop vol.53 suppl.1 San José May. 2005
Assessing the accuracy of acoustic seabed classification for mapping coral
reef environments in South Florida (Broward County,USA)
Ryan P.Moyer*1,2 ,Bernhard Riegl 2 ,Kenneth Banks 3 &Richard E.Dodge 2
1 Presently:University of Pennsylvania,Dept.of Earth and Environmental Science,240 South 33rd Street,Philadelphia, PA 19104 USA;moyerr@sas.upenn.edu
2 National Coral Reef Institute,Nova Southeastern University Oceanographic Center,8000 N.Ocean Drive,Dania Beach,Florida 33004,USA;rieglb@nsu.nova.edu
3 Broward County Dept.of Planning and Environmental Protection,Ft.Lauderdale,Florida 33301,USA; kbanks@broward.org
* Correspondence author.
Received 15-I-2004. Corrected 27-VIII-2004. Accepted 29-III-2005.
Abstract:The Atlantic coast of Broward County,Florida (USA)is paralleled by a series of progressively deeper, shore-parallel coral reef communities.Two of these reef systems are drowned early Holocene coral reefs of 5 ky and 7 ky uncorrected radiocarbon age.Despite the ease of access to these reefs,and their major contribution to the local economy,accurate benthic habitat maps of the area are not available.Ecological studies have shown that different benthic communities (i.e.communities composed of different biological taxa)exist along several spatial gradients on all reefs.Since these studies are limited by time and spatial extent,acoustic surveys with the QTCView V bottom classification system based on a 50 kHz transducer were used as an alternative method of producing habitat maps.From the acoustic data of a 3.1 km2 survey area,spatial prediction maps were created for the area.These were compared with habitat maps interpreted from in situ data and Laser Airborne Depth Sounder (LADS)bathymetry,in order to ground-truth the remotely sensed data.An error matrix was used to quantitatively determine the accuracy of the acoustically derived spatial prediction model against the maps derived from the in situ and LADS data sets.Confusion analysis of 100 random points showed that the system was able to distinguish areas of reef from areas of rubble and sand with an overall accuracy of 61%.When asked to detect more subtle spatial differences,for example,those between distinct reef communities,the classification was only about 40%accurate.We discuss to what degree a synthesis of acoustic and in situ techniques can provide accurate habitat maps in coral reef environments,and conclude that acoustic methods were able to reflect the spatial extent and composition of at least three different biological communities.
Keywords:Acoustic seabed classification,Coral reef community,Spatial prediction,Broward County Florida, Accuracy assessment.
Optical spaceborne or airborne remote sensing methods have repeatedly demonstrated their worth for discriminating reef habitat (Holden and Ledrew 1999,Green et al.2000, Hochberg and Atkinson 2000,Andrefouet et al.2002).In turbid conditions or in deep water,however,their use is limited.Extensive coral reef areas exist in turbid or deeper water beyond optical detection limits,both in the tropics and the high latitudes.Some of these areas have recently been identified as possible refuges in a greenhouse world (Riegl and Piller 2003),and it is therefore important to devise a means to map them.
Although a number of habitat classification methods employing the use of satellites and aerial photography have been applied to coral reef habitat mapping (Mumby et al. 1997),these methods have yielded unreliable results in the area of this study (B.Riegl and R. Moyer,unpublished).Traditional bathymetry methods,such as side-scan sonar or multibeam surveys,alone may not reveal the presence of coral reef biota.Single-beam acoustic seafloor discrimination systems,such as the here employed QTCView,have been successfully used to discriminate between seafloor types (Hamilton et al.1999,Anderson et al.2002), however,many of these surveys took place in areas of relatively uniform depth and were primarily directed at detecting differences in sediment type (Anderson et al.2002).
We are interested in evaluating whether the system would work well in a high-rugosity reef environment,and whether the backscatter information can also be used to draw inferences on the nature of the benthic communities and biota on the reefs.In this study,we carried out an acoustic seabed classification survey and an in situ diver-based survey in Broward County (Florida,USA).Using spatial prediction modeling (Johnston et al.2001) and confusion analysis (Janssen and van der Wel 1994,Green et al.2000)we set out to determine how well the spatial patterns of benthic acoustic properties match spatial patterns of geomorphology,shown with Laser Airborne Depth Sounder (LADS)(Wellington 2001)bathymetry,and ecological communities identified by diver-based surveys (Moyer et al.2003).We discuss whether a synthesis of acoustic and in situ techniques can effectively provide accurate regional-scale habitat maps in coral reef environments.
Materials and methods
The relict reef system offshore Broward County (Florida,USA)is extensive and has been previously described as consisting of three progressively deeper,shore-parallel terraces (Duane and Meisburger 1969,Lighty 1977).The present biological community structure on these reef terraces is highly variable (Goldberg 1979,Moyer et al.2003).This, in conjunction with waters that are generally turbid year-round,has prevented the development of large-scale benthic habitat maps that are both accurate and comprehensive.
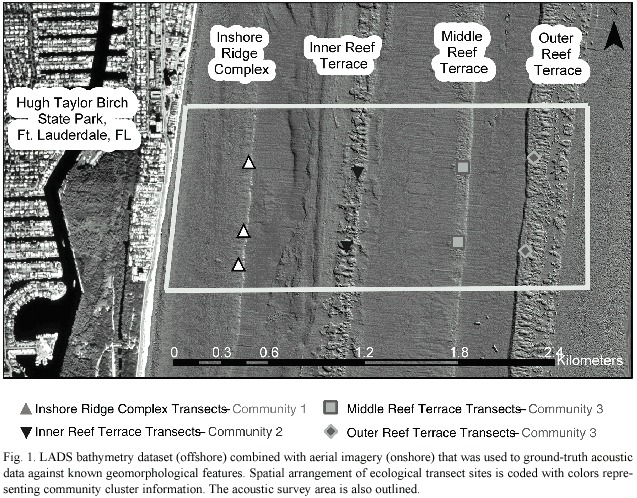
Our acoustic surveys employed a QTC View Series V system based on a 50 kHz transducer with 24° beam width (Suzuki ES-2025 depth sounder)mounted through the hull of the research vessel.The survey was conducted on November 16,2001 in an area approximately 2.4 km in cross-shelf width,and 1.3 km along-shelf (shore-parallel)offshore Ft.Lauderdale, Florida,comprising a total survey area of about 3.1 km2 (Fig.1).The survey grid,grid spacing,and guidance to the helmsman were given by HYDAS hydrographic survey software (Quester Tangent Corp.,Sydney B.C.).Survey lines,with a spacing of 50 m,were run from a minimum depth of 3 m to a maximum depth of 35 m along the cross-shelf width of the survey area.Tie-lines were run perpendicular to the cross-shelf survey lines.Vessel speed for the survey was kept between 7-9 kts in seas with significant wave heights of 1.2 m or less,and geo-positioning was established with a WAAS (wide area augmentation system)enabled GPS.Geo-positioning data were continuously recorded,time-stamped,and,during processing,merged with the time-stamped acoustic data.The QTCView (Quester Tangent Corp. 2001)software collects the first echo return of the acoustic pulse sent by the depth sounder that is reflected off the seafloor.The analog signal is digitized and stored.During processing with QTC Impact (Quester Tangent Corp.2002),the waveform envelopes of five acoustic pulses are averaged and "stacked ",in order to reduce random variability.The stacked waveform envelopes are then subjected to a series of analyses (Fourier analysis,wavelet analysis; Legendre et al.2002,and other undisclosed proprietary analyses; Quester Tangent Corp. 2002)that result in 166 variables characterizing each stacked waveform.The dataset of all waveforms described by their 166 variables is then subjected to Principal Components Analysis (PCA)in order to eliminate redundancies and noise.The first three principal components are then retained for classification analysis (a modified k-means analysis using Baysian Information Criterion,Preston et al.2002)– the output of this classification analysis is color-coded presumed seafloor types that need to be ground-truthed.Quality control for data consisted of checking for correct time-stamps,depths,and signal strengths. All acoustic signals that did not pass quality control were discarded.
Several iterations of clustering the entire dataset were made before ideal cluster size was chosen.Ideal cluster size was measured by a raw score value given by the processing software (QTC Impact;Quester Tangent Corp. 2002),and derived from a Chi squared value. When the score values for each class were minimized and approximately equal,the iterative process of clustering was stopped,and the given number of classes was accepted as the "best split "for the acoustic data set.
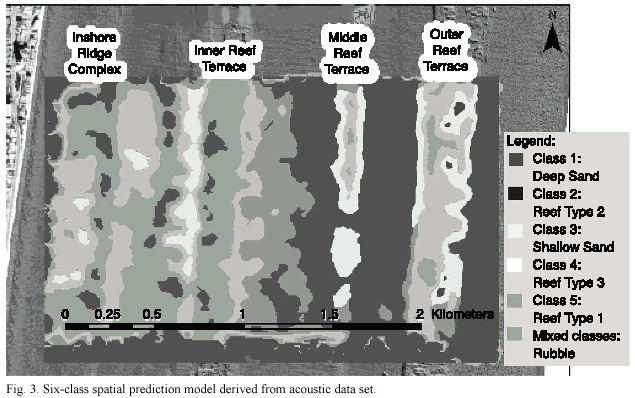
Once a best split of the raw acoustic data was achieved,the data set was imported into ArcGIS 8.0 and a six-class, geo-referenced spatial prediction model was generated using nearest-neighbor interpolation (Johnston et al.2001).The final step in generating the model was a cross validation analysis,which showed how well the model was able to predict unknown values.The resultant color-coded and geo-referenced prediction model based on the raw acoustic data was then imported into a GIS database and used in combination with a LADS bathymetry dataset (4 m horizontal,0.03 m vertical resolution).In order to identify how the different classes of acoustic data correspond to benthic topographic features,the spatial prediction model of the acoustic data was displayed on the GIS with a 65%transparency and superimposed onto the LADS bathymetry data.
To provide quantitative data about the fauna that could lead to a scattering of the acoustic depth-sounder pulse,and thus could be responsible for different acoustic classes, SCUBA divers surveyed 50 m line-intercept transects (Dodge et al.1982).Nine sites were selected under the track of the acoustic survey, with two sites located on each of the three reef terraces and three sites located along an inshore ridge structure with high stony coral cover (Fig.1).At each site,six transects were surveyed, giving a total of 54.Benthic cover data were recorded at 1 m intervals along each transect in six broad taxonomic categories: scleractinian (stony)corals;alcyonacean (soft) corals;zoanthids,hydroids,and tunicates; macroalgae;poriferans (sponges);and uncolonized substratum types.Data were fourth root transformed,a triangular site-by-site similarity matrix was calculated using the Bray-Curtis similarity index,and classification by agglomerative, hierarchical cluster analysis and ordination by non-metric multidimensional scaling (MDS)was performed (Clark and Warwick 2001).Using this data and LADS bathymetry,a second geo-referenced habitat map was created with ArcGIS 8.0.
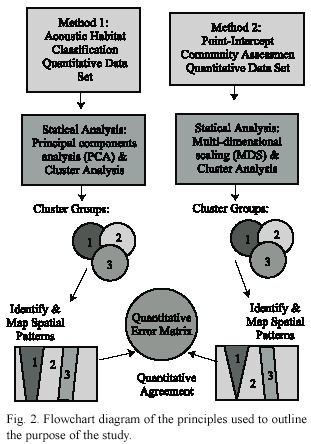
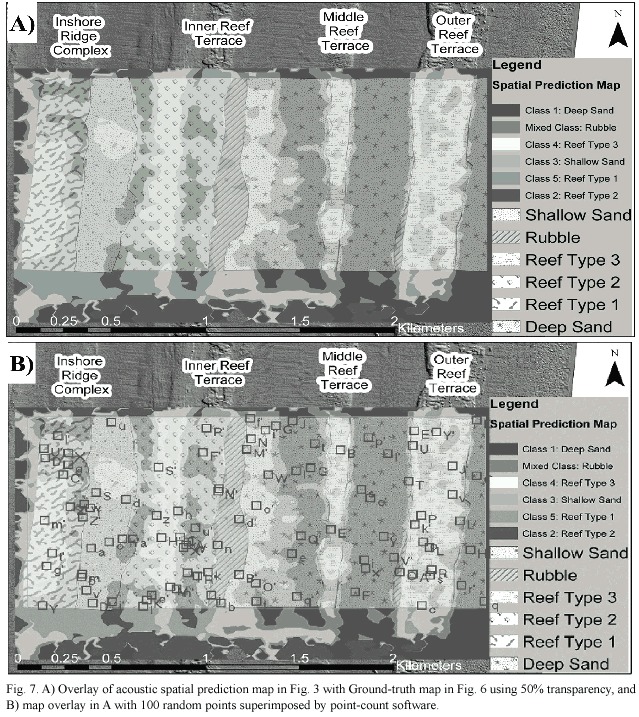
The habitat map derived from the in situ data set was then compared with the prediction model derived from the acoustic data, both in combination with the LADS bathymetry,in order to assess the accuracy of the acoustic habitat classification and determine the spatial patterns identified by both independent data sets.These two independent quantitative data sets were each statistically analyzed and a final quantitative comparison between the two data sets was performed with confusion analysis using an error matrix (Fig.2).In order to achieve this comparison,the spatial prediction model was overlain with the ecological habitat classification.This image was then imported into Coral Point Count (CPC),a proprietary point-count software developed by the National Coral Reef Institute,and 100 random points were placed onto the image.Each point was examined to see how many points were classified correctly (spatial prediction vs.quantitative ground-truth map)and entered into the error matrix for accuracy assessment.
Results
Acoustic survey
Acoustic survey data were clustered into five classes.Data points from the first acoustic cluster to be split (Class 1)were from offshore in waters deeper than 12 m.Class 2 data were from two shore-parallel areas in depths less than 5 m.Class 3 data was from 10 to 30 m depth.Class 4 data were from two distinct areas,the first from 5-10 m depth,the second from 20 to 30 m depth.Class 5 data were always found adjacent to Class 2 data in depths between 5 and 10 m.
Based on this class information and used in combination with the LADS bathymetry dataset (Fig.2)at least three acoustic classes (classes 2,4 and 5)always occurred over areas of reef,but were limited to only reef areas.A fourth class (class 3) occurred over the outer reef terrace and the middle reef terrace but also occurred over a rubble zone seaward of the inner reef terrace and a shallow sand area landward of the inner reef terrace.Class 1 was always found on the sandy plain in between the deep reefs. Also,areas of rubble returned a "mixed " acoustic signature,combining more than one class, which in essence gave a sixth class.From this data set,the six-class spatial prediction model shown in Figure 3 was generated.
Ecological data
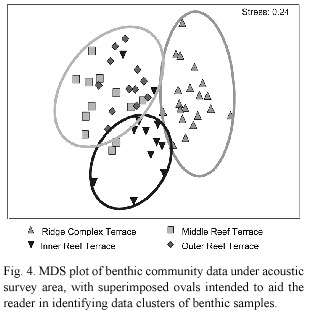
Cluster analysis revealed evidence for only two closely clustered groups of benthic data. Reef location was then superimposed on the MDS plot (Fig.4),which suggested that three data clusters existed.Transects from the ridge complex,the inner reef terrace,and the middle and outer reef terrace transects each formed a cluster.Details of their biological composition are shown in Figure 5.
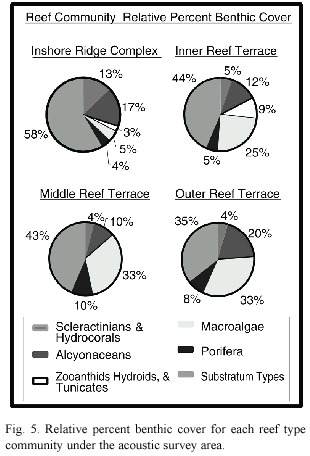
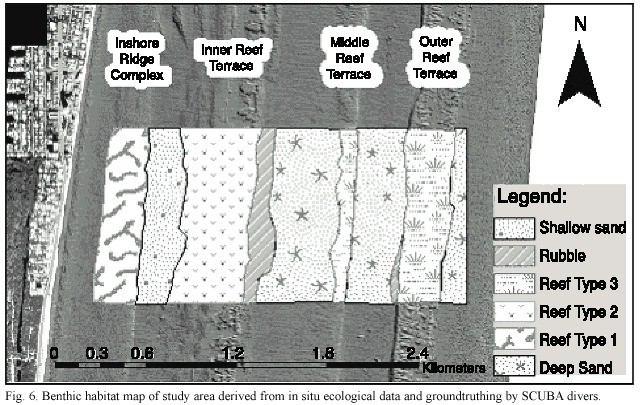
The benthic community of the inshore ridge complex (reef type 1)was composed mainly of uncolonized substratum (58%).Small stony (13%)and soft corals (17%)dominated the fauna.On the inner reef terrace (reef type 2)there was less bare substratum (44%),and macroalgae (25%)and Alcyonaceans (12%) dominated.The middle and deeper reef terraces (reef type 3)each had much uncolonized substrate (43%and 35%)and macroalgae (33% on both terraces).On the middle reef terrace, tall alcyonaceans and barrel sponges (both 10%)were the dominant fauna.A similar community occurred on the outer reef terrace,with tall,dense alcyonaceans covering 20%of the substrate, and tall barrel sponges colonized 8% of the reef terrace.Based on this data,the six-class habitat map in Figure 6 was constructed.
Accuracy assessment
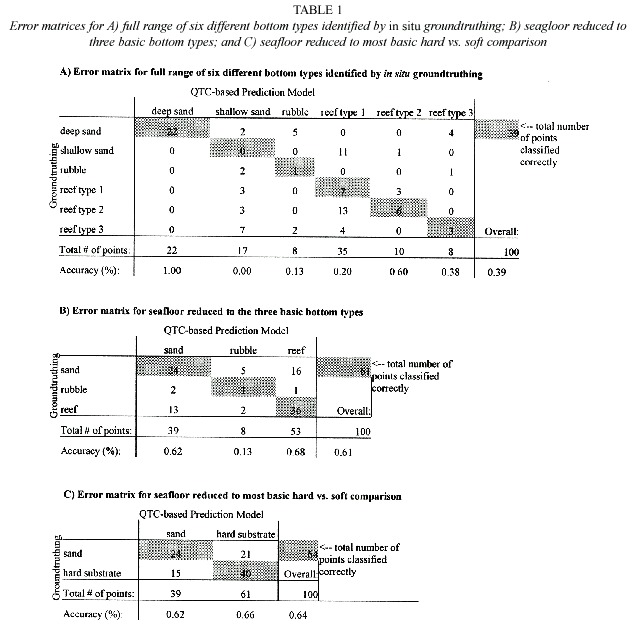
When the two data sets were overlain (Fig. 7a)the quantitative error matrix (Table 1)was calculated from 100 random points (Fig.7b) to compare the acoustic data in three ways:A) A class-for-class comparison of the six classes identified by spatial prediction and ground-truthing,B)A more general assessment where all reef classes were combined and assessment was determined for a sand-reef-rubble comparison,and C)a very broad comparison of sand vs.hard substrate (rubble and reef combined).Confusion analysis showed that the class-for-class comparison (Table 1a)was 39% accurate.The sand-reef-rubble comparison (Table 1b)performed much better,with an overall accuracy of 61%,and the hard vs. soft comparison (Table 1c)was slightly more accurate at 64%.
Discussion
When the acoustic data set was compared to the LADS bathymetry data (Fig.6),three acoustic classes were always found over reefs. Benthic data collected in situ showed three different community types in four different reef areas.Additionally two acoustic classes were representative of sandy areas.Deep-water sand without ripples and usually with a thin algal turf was differentiated from shallower sand with wave-ripples and no algal turf.Qualitatively, the spatial patterns shown by acoustic data and the ecological data corresponded well,however quantitative correlation of the two data sets varied depending on the resolution to which the acoustic data was interpreted.
The confusion analysis showed that using acoustic remote sensing,we were able to detect spatial differences between different reef communities on a fine scale with little accuracy (39%).When the analysis was simplified, distinguishing all reefs,from areas of rubble, and sand,the classification performed with much higher accuracy (61%).A slightly greater increase in accuracy was found when the classification was further simplified to a hard vs. soft substrate comparison (64%).In this study, the acoustic system could better identify (60%) a mid-depth reef community dominated by sponges and zoanthids (reef type 2,see Fig.6), but was not as accurate (20-38%)in distinguishing a neighboring shallow community dominated by soft and stony corals (reef type 1,Fig.6), or deep community with higher live cover (reef type 3,Fig.6).The analysis also showed the deep reef to have high confusion with adjacent areas of rubble and shallow,rippled sand.Sand found in deeper water (>20m)typically had no ripples and was readily distinguishable (100% accuracy)from other bottom types identified by the acoustic data.
Using LADS bathymetry and in situ survey techniques to ground-truth acoustic seabed classification classes,meaningful habitat mapping data was obtained.With the same methods, similar results were achieved for three replicate study areas in different locations along the Broward County coastline. These findings suggest that acoustic remote sensing techniques are indeed applicable to constructing spatially accurate habitat maps in areas where the environmental conditions prohibit the use of other remote sensing techniques (p.ex.optical).
Conclusions
We conclude that acoustic methods were indeed able to reflect the spatial extent and,at least to a limited level the composition (height and density of fauna and flora),of at least three different biological communities.We believe that the QTC View acoustic ground discrimination system indeed returned realistic results, and no evidence of depth-contamination of the data was found.The same data-classes were found in both shallow and deep areas (classes 1 and 3).We attribute differences between the two sand classes to be founded in their actual geophysical characteristics (surface relief,i.e. ripple frequency,sediment depth,underlying substratum,Preston et al.1999),while with the reef classes,the possibility exists that the returned classes may be a product of other physical factors of the seafloor not necessarily related to the biota (i.e.underlying substrate composition, slope,rugosity,porosity,etc., Preston et al.1999).This suggests that acoustic remote sensing techniques can be applied to large-scale mapping of coral reef environments and return reliable results depending on the user s intended scale and resolution.If the resolution becomes fine,and the acoustic system is used to differentiate unique patches (i.e. areas of dense vs.sparse fauna)within a coral reef habitat,the accuracy of the resultant maps decreases considerably.
Acknowledgments
This study was funded by grants to K. Banks at the Broward County Dept.of Planning and Environmental Protection (DPEP)and R.Dodge under the NOAA Coastal Ocean Program,grant NA16OA1443.The following people helped with diving and data collection: M. Cho, B. Ettinger, D. Gilliam, E.Glynn, J.Keck,S.Thornton,J.Vernacchio.Capt.L. Robinson steered the survey vessel.B.Walker processed LADS data provided by Broward DPEP.Coral Point Count (CPC)software written and developed by K.Kohler for the National Coral Reef Institute.Many thanks are extended to J. Brock, J. Cortés, J.Monge-Nájera,and an anonymous reviewer whose insight and comments greatly added to this submission.This is NCRI publication N º54.
Resumen
La costa Atlántica del Condado de Broward,Florida (EEUU)es paralela a una serie de arrecifes coralinos lineales de creciente profundos.Dos de estos sistemas arrecifales del Holoceno Temprano (cinco mil y siete mil años) son arrecifes coralinos sumergidos.Aunque estos arrecifes son de fácil acceso y contribuyen en forma significativa a la economía local,no existen mapas detallados de los hábitats bentónicos.Los estudios ecológicos han demostrado que diferentes comunidades bentónicas (i.e.comunidades compuestas por diferentes táxones)existen a lo largo de gradientes espaciales de todos los arrecifes.Como estos estudios tienen limitaciones temporales y espaciales,hicimos sondeos acústicos con el sistema de clasificación béntica QTCView V basado en transductores de 50 kHz, como un método alternativo para producir mapas de hábitat.De la información acústica de una área de 3.1 km2 ,se generaron mapas predictivos para el área.Posteriormente se compararon con mapas de hábitat hechos in situ y con batimetría generada con una Sonda de Batimetría Láser Aérea (Laser Airborne Depth Sounder:LADS),para comprobar la precisión de los datos del sensor remoto.Se usó una matriz de errores para determinar la fidelidad del modelo espacial predictivo, generado acústicamente,en comparación con los mapas derivados in situ y las bases de datos LADS. Un Análisis de Confusión (errores de predicción)de 100 puntos al azar mostró que el sistema podía diferenciar arrecifes de áreas cubiertas con escombros y arena,con una precisión del 61%.Al tratar de ver diferencias espaciales más sutiles,por ejemplo,entre diferentes comunidades arrecifales,la precisión bajó al 40%.Discutimos hasta que punto una síntesis de técnicas acústicas e in situ pueden proveer mapas de hábitat precisos en ambientes de arrecifes coralinos,y concluimos que los métodos acústicos pueden predecir la extensión espacial y la composición de al menos tres comunidades biológicas.
Keywords:Clasificación acústica de fondos,arrecifes coralinos,predicciones espaciales,Condado Broward, Florida, análisis de fidelidad.
References
Anderson, J.T.,R.S.Gregory &W.T.Collins.2002. Acoustic classification of marine habitats in coastal Newfoundland.ICES J.Mar.Sci.59:156-167. [ Links ]
Andrefouet,S.,R.Berkelmans,L.Odriozola,T.Done, J.Oliver,&F.Muller-Karger.2002.Choosing the appropriate spatial resolution for monitoring coral bleaching events using remote sensing.Coral Reefs 21:147-154. [ Links ]
Clark,K.R.&R.M.Warwick.2001.Change in marine communities:An approach to statistical analysis and interpretation.2 nd Ed.Primer-E.Plymouth,U.K. 164 p. [ Links ]
Dodge,R.E.,A.Logan &A.Antonius.1982.Quantitative reef assessment studies in Bermuda:A comparison of methods and preliminary results.Bull.Mar.Sci. 32:745-760. [ Links ]
Duane,D.B.and E.P.Meisburger.1969.Geomorphology and Sediments of the Nearshore Continental Shelf Miami to Palm Beach,Florida.U.S.Army Corps of Engineers Technical Memorandum No.29.47 p. [ Links ]
Goldberg,W.M.(1979)Shelf temperatures and reef growth on the south-east Florida coast.Nature 278:669-670. [ Links ]
Green,E.P.,P.J.Mumby,A.J.Edwards &C.D.Clark.2000. Remote sensing handbook for tropical coastal mangement. UNESCO.316 p. [ Links ]
Hamilton,L.J.,P.J.Mulhearn,&R.Poeckert.1999. Comparison of RoxAnn and QTC-View acoustic bottom classification system performance for the Cairns area,Great Barrier Reef, Australia. Cont. Shelf. Res. 19:1577-1597. [ Links ]
Hochberg,E.&M.Atkinson.2000.Spectral discrimination of coral reef benthic communities.Coral Reefs 19:164-171. [ Links ]
Holden,H.&E.Ledrew.1999.Hyperspectral identification of coral reef features.Int.J.Rem.Sens.20: 2545-2563. [ Links ]
Janssen,L.L.F.&F.J.M.,van der Wel.1994.Accuracy assessment of satellite derived land-cover data:a review. Photogrammetric Engineering and Remote Sensing 60:419-426. [ Links ]
Johnston,K.,J.M.Ver Hoef,K.Krivoruchko &N.Lucas. 2001.Using ArcGIS Geostatistical Analyst.ESRI Press,Redlands CA.300 p. [ Links ]
Legendre,P.,K.E.Ellingsen,E.Bjørnbom &P.Casgrain. 2002.Acoustic seabed classification:Improved statistical method.Can.J.Fish.Aquat.Sci.59:1085-1089. [ Links ]
Lighty,R.G.1977.Relict shelf-edge Holocene coral reef: southeast coast of Florida.Proc.3 rd Int.Coral Reef Symp.2:215-221. [ Links ]
Moyer,R.P.,B.Riegl,K.Bank &R.E.Dodge.2003. Spatial patterns and ecology of benthic communities on a high-latitude South Florida (Broward County, USA)reef system.Coral Reefs 22:447-464. [ Links ]
Mumby,P.J.,E.P.Green,A.J.Edwards &C.D.Clark.1997. Coral reef habitat mapping:How much detail can remote sensing provide?Mar.Biol.130:193-202. [ Links ]
Preston,J.M.,W.T.Collins,D.C.Mosher,R.H.Poeckert &R.H.Kuwahara.1999.The strength of correlations between geotechnical variables and acoustic classifications.Proc.MTS/IEEE OCEANS 99 Conf. Pp.1123-1128. [ Links ]
Preston,J.M.,A.C.Christney,L.S.Beran,W.T.Collins &R.A.McConnaughey.2002.Objective measures of acoustic diversity for benthic habitat characterization.Symp.Effects of Fisheries on Benthic Habitats:Linking Geology, Biology, Socioeconomy and Management,Tampa,Florida.45 p. [ Links ]
Quester Tangent Corp.2001.QTC View Acoustic seabed classification.User Guide 1.00.Sidney,B.C.39 p. [ Links ]
Quester Tangent Corp.2002.QTC Impact User Guide 3.00. Sidney,B.C.125 p. [ Links ]
Riegl,B.&W.E.Piller.2003.Possible refugia for reefs in times of environmental stress.Int.J.Earth Sci.92: 520-531. [ Links ]
Wellington,M.2001.The laser airborne depth sounder (LADS):A broad range of applications, environmental conditions and commercial models.Hydro Intl. 5(3):6-9. [ Links ]

