


Services on Demand
Journal
Article
 Article in xml format
 Article references
 Send this article by e-mail
Indicators
-
 Cited by SciELO
 -
 Access statistics
Related links
-
 Similars in
SciELO
Similars in
SciELO  uBio
uBio
Share

 Permalink
Revista de Biología Tropical
On-line version ISSN 0034-7744Print version ISSN 0034-7744
Rev. biol. trop vol.53 n.3-4 San José Sep. 2005
Blood and urine physiological values in farm-cultured Rana catesbeiana (Anura: Ranidae) in Argentina
José A. Coppo, Norma B. Mussart & Santiago A. Fioranelli
Cát. Fisiología Animal, Fac. Ciencias Exactas y Naturales, Universidad Nacional del Nordeste, Sargento Cabral 2139, Corrientes (3400), Argentina; jcoppo@vet.unne.edu.ar
Received 19-V-2003. Corrected 21-VII-2005. Accepted 28-VII-2005.
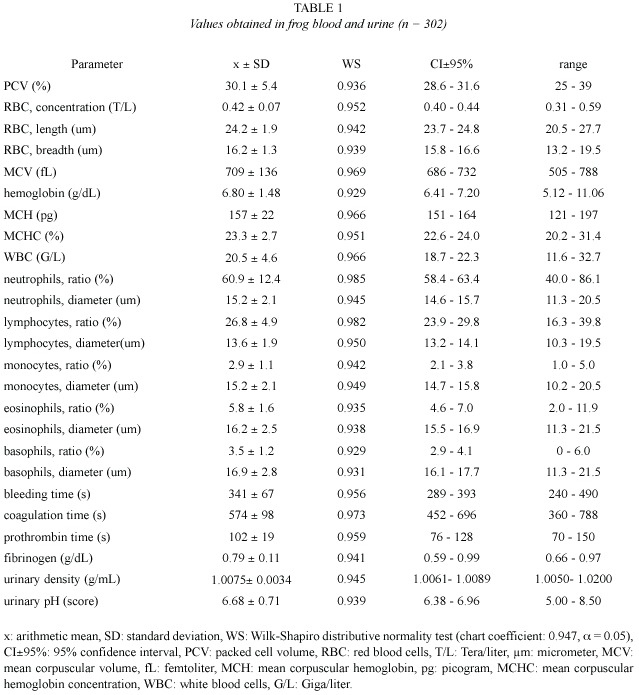
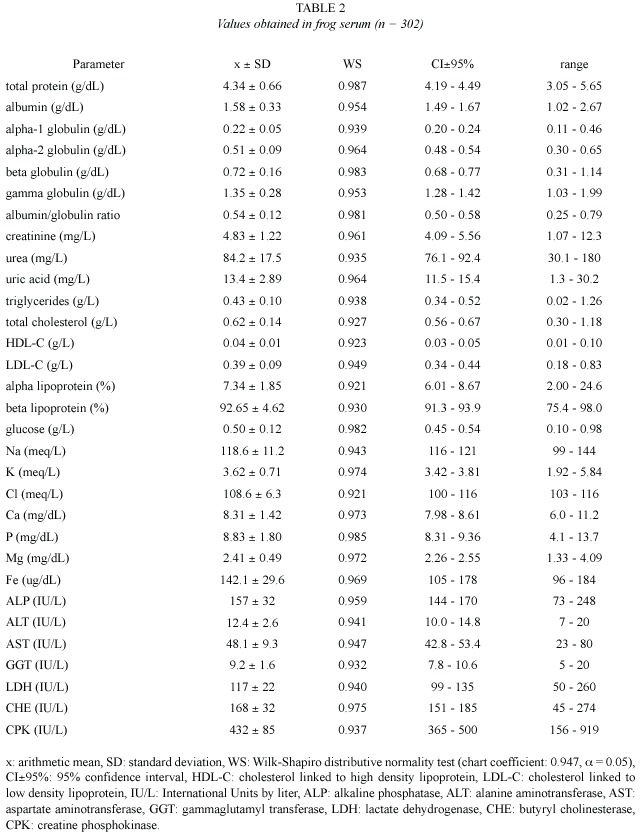
Abstract: A total of 302 samples of healthy farm-cultured Rana catesbeiana specimens (9-21 months-old, 50- 350 g liveweight, 50% each sex) from the north-east of Argentina, were analyzed through spectrophotometry, electrophoresis, densitometry, refractometry and microscopy in order to obtain blood and urine normal values. Confidence intervals (p<0.05) for PCV (28.6-31.6%), RBC (0.40-0.44 T/L), MCV (686-732 fL), hemoglobin (6.41-7.20 g/dL), MCH (151-164 pg), MCHC (22.6-24.0%), WBC (18.7-22.3 G/L), neutrophils (58.4-63.4%), lymphocytes (23.9-29.8%), monocytes (2.1-3.8%), eosinophils (4.6-7.0%), basophils (2.9-4.1%), bleeding time (289-393s), coagulation time (452-696s), prothrombin time (76-128s), urinary density (1.0061-1.0089 g/mL), urinary pH (6,38-6.96), fibrinogen (0.59-0.99 g/dL), total protein (4.19-4.49 g/dL), albumin (1.49-1.67 g/dL), alpha-1 globulin (0.20-0.24 g/dL), alpha-2 globulin (0.48-0.54 g/dL), beta globulin (0.68-0.77 g/dL), gamma globulin (1.28-1.42 g/dL), albumin/globulin ratio (0.50-0.58), creatinine (4.09-5.56 mg/L), urea (76.1-92.4 mg/L), uric acid (11.5-15.4 mg/L), triglycerides (0.34-0.52 g/L), total cholesterol (0.56-0.67 g/L), HDL-C (0.03-0.05 g/L), LDL-C (0.34-0.44 g/L), alpha lipoprotein (6.01-8.67%), beta lipoprotein (91.3-93.9%), glucose (0.45-0.54 g/L), Na (116-121 meq/L), K (3.42-3.81 meq/L), Cl (100-116 meq/L), Ca (7.98-8.61 mg/dL), P (8.31- 9.36 mg/dL), Mg (2.26-2.55 mg/dL), Fe (105-178 ug/dL), ALP (144-170 IU/L), ALT (10.0-14.8 IU/L), AST (42.8-53.4 IU/L), GGT (7.8-10.6 IU/L), LDH (99-135 IU/L), CHE (151-185 IU/L) and CPK (365-500 IU/L), were obtained. Some parameter ranges were similar to those obtained in amphibians, birds or mammals; others were very different. These parameters are useful to evaluate sanitary, metabolic and nutritional state on captive bullfrogs. Rev. Biol. Trop. 53(3-4): 545-559. Epub 2005 Oct 3.
Key words: Rana catesbeiana, blood values, coagulation tests, urine parameters.
The bullfrog, Rana catesbeiana Shaw 1802 (bullfrog) has its origin in North America. Specimens present in Argentina come from genetic lines imported from Brazil, and they are adapted to the tropical climate (Roman 1994). There are more than 200 bullfrog hatcheries in Argentina which produce meat marketed at a high price (Carnevia 1995). The edible meat is valued because of its low fat and cholesterol levels (Pavan 1996). The bullfrog is characterized by its size; in captivity it can reach 300 g liveweight after 12 months. Since aging causes a decrease in the food conversion index, frogs are sacrificed when they are 6-7 months old and weigh 170-180 g (Lima and Agostinho 1992). This frog is generally fed with balanced pellets which are similar to those elaborated for fish as its true nutritional requirements are still unknown (Carnevia 1995).
There are five families and more than 60 species of autochthonous anurans in the north-east of Argentina, all of them adapted to resist lingering droughts and abrupt temperature changes (Cespedez and Alvarez 1999). Nevertheless, the climate of this area is mainly warm and it favors hatcheries to respond the main market demand, that is, the continuity of production along the year (Roman 1994). Indoor captivity is the system chosen to rear this animal as escapes would be dangerous to the ecosystem. R. catesbeiana is ecologically considered as an "undesirable guest". When it settles in any lagoon, the original aquatic fauna could rapidly become extinct due to the high food consumption (Lima and Agostinho 1992) of this species in which cannibalism would not be unusual (Longo 1985). In contrast, a natural diet for an autochthonous terrestrial anuran like Bufo sp. would be mainly composed of coleopterans and hymenopterans (Duré and Kehr 1999).
Blood and urine composition would be influenced by peculiar physiological characteristics of the amphibian, such as metamorphosis, water and solutes skin exchange, capacity to support hemodilution and hemoconcentration, modification of urinary bladder water permeability, metabolic and enzymatic changes due to temperature, fast during winter lethargy, and others (Goldstein 1982, Eckert 1992, Candia et al. 1997, Bicego and Branco 1999, Busk et al. 2000, Curtis and Barnes 2001). It has recently been discovered that adrenergic receptors redistribution (Bachman et al. 1998), as well as eicosanoids (Herman and Luczy 1999) and natriuretc peptides synthesis increase (Uchiyama et al. 1998) have active participation in acclimatization mechanisms and corporal fluid retention in R. catesbeiana.
Contrary to their close relatives (reptilians and birds) which are uricotelics, adult R. catesbeiana is ureotelic, although in tadpole stage it reveals an ammoniotelic pattern of nitrogen excretion (Goldstein 1982, Curtis and Barnes 2001). Frog blood is hyperosmotic in relation to the fresh water they live in, and urine is hyposmotic in relation to their blood (Coppo 2001). Corporal fluids pH varies according to body temperature, it is acidified when temperature increases and vice versa; exchange of Na between cell and internal environment is also altered by pH (Jorgensen 1995). Changes of pH provoke numerous hematic and urinary modifications (Coppo 2001).
Except in the case of plasmatic electrolytes, texts of animal physiology reveal a manifest absence of hematic and urinary normal values from amphibians diagnostic parameters. Such parameters would be useful to evaluate health state in captive R. catesbeiana, which can suffer malnutrition, anemia, stress, transmissible diseases, intoxications, hemorrhagic dysfunctions, as well as inflammation and necrosis of liver, lungs, kidneys, spleen, muscles and other organs (Fraser 1986, Lima and Agostinho 1992, Hecnar 1995, Goldberg et al. 1998, Fontenot et al. 2000).
The objective of this study was to obtain physiological reference values from hematic and urinary diagnostic parameters in R. catesbeiana.
Material and methods
Experimental subjects, feeding and handling:
A total of 302 healthy R. catesbeiana specimens were used for a period of two years; 270 of them were maintained on intensive culture systems, divided in 3 frog farms in the north-east of Argentina. Samples from 90 frogs (9-21 months old, 50-350 g liveweight, 50% each sex), were taken in each breeding place. Thirty six per cent of the samples was taken during winter time, and 64% during the remaining seasons. No heating system during winter season was used in the hatcheries; all of them supplied food (45% protein balanced pellets, milled bovine lung, worms and fly larvae) at a rate of 3-5% liveweight/day. The 32 remaining animals were reared on an extensive system (semi-captivity), in a closed lagoon where frogs selected exclusively "natural" food. They were adult 16-20 month-old animals from both sexes. Samples were taken during winter and all along the rest of seasons.
Sample Taking: Frogs were transported to the laboratory in thermal boxes which contained a NaCl 0.6% isotonic solution cooled with ice (2-3ºC); this procedure provokes desensitization and lethargy, facilitating the animal manipulation (Lima and Agostinho 1992). Liveweight was obtained in an electronic balance Scientech-SL, with a 0.01 g accuracy. Samples were taken in the morning (7-8 AM), after a 24 h fasting period. Blood was obtained by intracardiac puncture, carried out with syringe and needle. The sample was a venose and arterial blood mixture, since frogs, with their anatomical characteristic, possess a unique ventricle (Goldstein 1982). Some of the blood was treated with anticoagulant (EDTA, 0.34 mol/L), another was mixed with a sodium citrate solution (130 mmol/L) and the last one was centrifuged (700g, 10 min) to obtain serum. Urine was obtained by cystocentesis.
Laboratory procedures: Being amphibians erythrocytes nucleated cells, erythrogram parameters were obtained applying avian techniques (Coles 1989). There was a previous blood hemolysis and centrifugation to eliminate erythrocyte nuclei, and hemoglobin was later evaluated by photocolorimetry (Drabkin technique, using Wiener Lab reagents). Red blood cells (RBC) concentration was determined by means of Neubauer hemocytometer microscopic count using Biopur diluters, and the packed cell volume (PCV, hematocrit) was measured by capillary centrifugation (12 000 g, 5 min). White blood cells (WBC) concentration was obtained from stained smear count (Giemsa), considering corrections according to PCV value. Differential leukocyte count was carried out from stained smear (May Gründwald). Blood cells size was measured with an ocular micrometer. Erythrocyte indices such as mean corpuscular volume (MCV), mean corpuscular hemoglobin (MCH), and MCH concentration (MCHC), were obtained by conventional calculation.
Bleeding, coagulation and prothrombin time were evaluated respectively by Dukes, Lee-White and Quick methods (Pesce and Kaplan 1990). Fibrinogen was calculated by the difference between plasma and serum proteins (Coles 1989), using an Erma-D refractometer. Urinalysis (density, pH, sediment, and chemical composition) was carried out by conventional laboratory techniques (Coppo 2001). Sodium and potassium were evaluated using Biopur reagents, in a Metrolab 305-D flame photometer. The separation of proteins (albumin and alpha, beta and gamma globulins, on cellulose acetate) and lipoproteins (alpha and beta, on agarose gel) was carried out by electrophoresis (Pesce and Kaplan 1990). Fractions were quantified in a Citocon CT-440 densitometer.
Serum biochemical parameters were measured in a Labora Mannheim 4010 UV-visible spectrophotometer, using Wiener, Boehringer and GT-Lab reagents, through regular laboratory methods: total protein (biuret), creatinine (alkaline picrate), urea (urease), uric acid (uri-case), triglycerides (lipase peroxydase), total cholesterol (cholesterol oxydase), cholesterol linked to high density lipoprotein, HDL, and low density lipoprotein, LDL, (separation by precipitation), glucose (Trinder), chloride (mercuric tiocianate), calcium (cresolphtalein-complexone), inorganic phosphorous (phosphomolybdate), magnesium (calmagite), iron (PBTS), and activities of alkaline phosphatase (ALP, phenylphosphate), alanine aminotransferase (ALT, oxoglutarate-NADH), aspartate aminotransferase (AST, aspartate-ketoglutarate), gammaglutamyl transferase (GGT, p-nitroanilide kinetic method), lactate dehydrogenase (LDH, dinitrophenylhydrazine), butyryl cholinesterase (CHE, kinetic with butyril-thiocholine) and creatine phosphokinase (CPK, creatine-ATP) (Pesce and Kaplan 1990).
Statistical analysis: The normality of the distribution of dependent variables (quantitative continuous) was assessed using the Wilk-Shapiro test (WS). Parametric descriptive statistics included measures of central tendency (arithmetic mean, x), dispersion (standard deviation, SD) and ranges. Fiduciary probability was assessed by confidence intervals (CI±95%). Correlation coefficients were obtained by the Pearson procedure. Calculations were all made using the Statistix software, 1996 version.
Results
Values obtained from hemogram, coagulation tests, and some urinalysis parameters (Table 1), as well as from serum chemical values (Table 2), showed an approximately normal distribution, which allowed the use of parametric statistics. Confidence intervals were adjusted around arithmetic means, but individual ranges were wide. Correlation between age and weight was significant (r = 0.82, p = 0.02).
Chemical tests on urine revealed that 7.6% of the studied amphibians had protein vestiges (30 mg/dl) and 4% showed bilirubin traces, which coexisted with small quantities of ketones. In all cases glucose was negative. Hemoglobin vestiges were verified in 57.6% of the samples. Urobilinogen was found in 100% of the studied amphibian urinary samples, with concentrations of 0.2 mg/dl (92% of animals) and 1 mg/dl (8% of animals). Scarce quantities of erythrocytes (57.6% of cases), leukocytes (15.3%), germs (53.8%) and granular cylinders (8%), were verified in the urinary sediment. No crystals were found in these amphibians urine.
Discussion
After food ingestion, changes in amphibian plasma composition would be registered (Busk et al. 2000). Other changes would also occur as consequence of circadian rhythm, caused by cortisol fluctuations (Wright et al. 1999). Both postprandial and circadian effects were excluded from the present study design due to previous fast and basal condition of samples, and also because blood extraction was carried out in uniform morning hours. Scarce regulation mechanisms and higher tolerance to hemodilution and hemoconcentration, would cause a great oscillation of blood values in frogs (Goldstein 1982). This fact could explain the wide extent of ranges obtained in this trial. Correlation between age and weight was only moderately significant (r = 0.82, p = 0.02), probably because of the growth delay which takes place during the winter (Lima and Agostinho 1992).
Erythrogram: In the present study, PCV values (30.1±5.4%) were higher than those reported on R. catesbeiana (22±5%) by Cathers (1997), but they matched with the reference interval published by Singh (1978) as regards Rana tigrina (19.5-31.8%). Terrestrial toads (Bufo sp) would register PCV values ranging from 36 to 44% (Coppo 2001). The R. catesbeiana hematocrit would not be very different from the values found on fowls (25- 35%, Coppo 2001, and 22-35%, Jain 1993), but it would be lower than those reported on domestic mammals (32-45%, Kolb 1987, and 37-47%, Coppo 2001).
Erythrocyte concentration would be extraordinarily variable in amphibians (Goldstein 1982). RBC values found in these frogs (0.42±0.07 T/L) were considerably lower than those reported on fowls (2.5-3 T/L, Coppo 2001; 3 T/L, Kolb 1987; 2.2-5.1 T/L, Coles 1989, and 2.5-3.5 T/L, Jain 1993), as well as those published on domestic mammals (6.7-9.3 T/L, Coppo 2001; 7-14 T/L, Kolb 1987; 6-13 T/L, Coles 1989, and 5-18 T/L, Jain 1993). Erythrocyte dimensions in this study (length x breadth = 24.2x16.2 µm) were approximately similar to those found on R. catesbeiana by Raimon et al. 1996 (24x14 µm), but they were smaller than those reported on birds (12x7 µm, Kolb 1987, Jain 1993), and domestic mammals (3.2-9.6 µm, Coles 1989; 3.2-7 µm, Jain 1993, and 3.9-7.2 µm, Kolb 1987). Our MCV (709±136 fL) was higher than those published on fowls (105-115 fL, Coppo 2001; 115-125 fL, Kolb 1987, and 90-140 fL, Jain 1993), as well as those reported on domestic mammals (45-65 fL, Coppo 2001; 19-69 fL, Kolb 1987; 19-70 fL, Coles 1989, and 16-77 fL, Jain 1993).
Hemoglobin concentration of the studied frogs (6.80±1.48 g/dL) was higher than the one found on R. catesbeiana (4.7±0.9 g/dL, Cathers 1997), and Rana tigrina (3.87-6.22 g/dL, Singh 1978). This respiratory pigment would be higher on toads (10-13 g/dL, Coppo 2001) and birds (8-12 g/dL, Kolb 1987; 7-13 g/ dL, Jain 1993, and 7.2-9.6 g/dL, Coppo 2001), as well as on domestic mammals (12-16 g/dL, Coppo 2001; 11-14 g/dL, Kolb 1987; 11-15 g/ dL, Coles 1989, and 8-19 g/dL, Kaneko 1989, Jain 1993). Since a frog MCV would be higher compared to the one found on other species, the MCH index (157±22 pg) was also higher than the values reported on birds (29-33 pg, Coppo 2001; 25-27 pg, Kolb 1987; 33-47 pg, Jain 1993), and mammals (16-25 pg, Coppo 2001; 13-31 pg, Kolb 1987; 7-23 pg, Coles 1989, and 5.2-24.5 pg, Jain 1993). Our MCHC (23.3±2.7%) was similar to those published on fowls (21-23%, Kolb 1987) but lower than those found on domestic mammals (32-37%, Coppo 2001; 27-39%, Kolb 1987; 31-35%, Coles 1989, and 30-37%, Jain 1993).
Nutritional anemias would be common in amphibian. Coccidia, as Babesiosoma stableri, would be located inside erythrocytes; Lankesterella minima would also parasite tad-poles and adult frog RBC (Desser et al. 1990). Hematocrit would decrease in anemias, and it would increase in dehydration and postprandial stage. The latter would be due to spleen RBC release (Busk 2000). Hematocrit and hemoglobin would diminish as a consequence of alimentary deficiencies and prolonged fast (Singh 1978). Erythrocytes indicators in the nutritional state panel show a decrease owing to insufficient protein, vitamins B12, E, niacin and folic acid intake (Kolb 1987). Appropriate erythropoiesis would require a continuous and balanced affluence of minerals such as Fe, Cu, Co and Se; nutritional lacks would also provoke hematocrit and hemoglobin decrease (Jain 1993).
Leukogram: The WBC concentration found on R. catesbeiana by Cathers 1997 (5.2±2.9 G/l) was lower than the one obtained in the present trial (20.5±4.6 G/L), presumably because of a depression caused by the anesthetic used in sample taking. The WBC average found on these frogs coincides with the reference intervals reported on birds (13-22 G/L, Coppo 2001, and 18-30 G/L, Kolb 1987) but it is higher than those published on domestic mammals (6-12 G/L, Coppo 2001; 5-20 G/L, Kolb 1987, and 7.6-16 G/L, Coles 1989).
Neutrophils ratio (60.9±12.4%) was higher than those reported on avian heterophils (23- 28%, Coppo 2001, and 27%, Kolb 1987), as well as those reported on ruminant neutrophils (33-39%, Coppo 2001; 25-30%, Kolb 1987, and 10-50%, Coles 1989, Jain 1993). However, this ratio was similar to those published on carnivorous and monogastric herbivores (58-64%, Coppo 2001; 60-75%, Kolb 1987, Coles 1989, and 60-77%, Jain 1993).
The percentage of lymphocytes (26.8 ± 4.9%) was lower than those obtained on birds (58-65%, Coppo 2001, and 59%, Kolb 1987), but it was similar to those published on carnivorous (25-37%, Coppo 2001; 20-25%, Kolb 1987, and 12-30%, Coles 1989, Jain 1993). On the other hand, our ratio was lower than those found on ruminant (55-61%, Coppo 2001; 55-65%, Kolb 1987; 48-75%, Coles 1989, and 50-70%, Jain 1993).
The monocyte proportion found in bullfrog (2.9±1.1%) matched with the reference interval admitted for the majority of domestic mammals and birds (2-8%, Kolb 1987; 1-10%, Coles 1989; 0-10%, Jain 1993, and 2-6%, Coppo 2001). The quantity of eosinophils (5.8±1.6% on R. catesbeiana ), was also similar to the one reported on domestic mammals (1-6%, Coppo 2001; 2-12%, Kolb 1987; 1-15%, Coles 1989, and 0-20%, Jain 1993), but it was higher than the one obtained on birds (2%, Kolb 1987, and 2-3%, Coppo 2001). Frogs would have basophils (3.5±1.2%) in a slightly higher proportion than those reported on domestic mammals and birds, whose values are 0-1% and 1-2% respectively (Kolb 1987, Coppo 2001).
The mean diameter of neutrophils on the frogs of the present study (15.2 µm) was lower than the one reported on R. catesbeiana (25 µm, Raimon et al. 1996), but it was higher than those published by Kolb (1987) for domestic mammals (10-12 µm) and birds (heterophils, 9.6 µm). The bullfrog lymphocyte size (13.6 µm) was similar to those found on the same frog species by other authors, from 8 to 18 µm (Raimon et al. 1996), but it was lower than those published by Kolb (1987) on birds (18.2 µm) and mammals (19-25 µm). The bullfrog monocyte diameter (15.2 µm) was slightly bigger than those reported on hens (12.5 µm) and mammals (12-14 µm)(Kolb 1987). On R. catesbeiana eosinophils, Raimon et al. (1996) report a diameter (24 µm) that is higher than the value found in this study (16.2 µm). Eosinophils would measure 9.7 µm on birds and 10-14 µm on domestic mammals (Kolb 1987). Basophils diameter found in bullfrog (16.9 µm) would be slightly higher than those published for birds (10.3 µm) and mammals (7-15 µm)(Kolb 1987).
Leukogram is useful to evaluate infection, inflammation, stress, neoplasias and other dysfunctions. Amphibian leukocytes may possess properties different to those of mammals, because temperature would greatly affect the cellular inflammatory response (Dias and Catao-Dias 1989). In R. catesbeiana tadpoles, lymphocytes and monocytes, but not granulocytes, would participate in the inflammatory focus development (Zablith et al. 1997).
Coagulogram: No previous values reported for hemostatic tests on R. catesbeiana were found. The obtained bleeding time (341 s = 5.7 min) was similar to those published on human beings and domestic mammals (2-5 min, Kaneko 1989, Coles 1989, Coppo 2001). The whole blood clotting time (574 s = 9.6 min) was neither different to those reported on mammals (4-15 min, Coles 1989, and 1-11 min, Kolb 1987), as well as on human beings (6-9 min, Coppo 2001), although it would be shorter on birds, from 0.5 to 2 min (Kolb 1987).
Bullfrog prothrombin time (102 s) was markedly longer than those admitted as normal in human beings (11-15 s, Coppo 2001), carnivorous (12-15 s, Kaneko 1989, and 6-7 s, Jain 1993), ruminants (20-30 s, Kaneko 1989) and mammals in general (12 s, Coppo 2001, and 10-28 s, Kolb 1987). Concentration of fibrinogen found in this trial (0.79±0.11 g/dL) was close to normal values reported on cows (0.60-0.70 g/dL, Kolb 1987, Jain 1993, Coppo 2001), but it was slightly higher than those published on fowls (0.1-0.4 g/dL, Jain 1993) and monogastric mammals (0.1-0.5 g/dL, Kaneko 1989, and 0.22 to 0.39 g/dL, Coppo 2001).
The fundamental triad of hemostasis exploratory tests in human beings and domestic animals is constituted by bleeding, coagulation and prothrombin times, which evaluate platelet function, intrinsic pathway, and extrinsic pathway respectively (Coles 1989, Coppo 2001). In coagulative anomalies is also important to determine the plasma fibrinogen concentration, to discard eventual hypo-, dis-, and a-fibrinogenemias provoked by hemorrhagic diathesis, hepatopathies, and malnutrition (Kaneko 1989, Pesce and Kaplan 1990). Amphibian thrombocytes would provide the necessary factors to form thromboplastin, which would transform fibrinogen into fibrin (Eckert 1992, Curtis and Barnes 2001).
The knowledge of coagulogram values from R. catesbeiana could contribute to clarify coagulopathies caused by inadequate diet, intestinal malabsorption, intoxications or metabolic disturbances (stress, cholestasis, fatty liver, myelodystrophies). Hypovitaminosis K provokes cutaneous hemorrhages as prothrombin time increases. Perhaps the most important bullfrog coagulopathy is the red-leg syndrome; it is a septicemia that causes skin and skeletal muscle hemorrhages, cutaneous ulcers, inflammation and necrosis of liver, spleen, and other celomic organs, emaciation, and death. Diverse intoxications and hepatopathies can lead to a deficit of fibrinogen and/or other clotting factors (Hecnar 1985, Fraser 1986, Lima and Agostinho 1992).
Urinalysis: Urinary density obtained on bullfrog (1.0075±0.0034 g/mL) was lower than those reported on mammals, from 1.015- 1.045 g/mL (Coles 1989) and 1.010-1.050 g/mL (Kaneko 1989), as well as on birds, from 1.009 to 1.033 g/mL (Coles 1989). In horses such density could reach 1.070-1.080 g/mL (Kolb 1987, Coles 1989). The extremely low density obtained confirms that the urine of this frog is significantly hyposmotic. While the internal environment of mammals (endothermals) has an osmolarity equivalent to 0.8-0.9% saline solutions, in amphibians (ectothermals) it coincides with 0.6-0.7% saline solutions (Coppo 2001).
Water volumes equivalent to 30-50% of body weight can be stored in terrestrial amphibian urinary bladder, which is capable of absorbing water and salt against gradient, and cause urine hyposmolarity. Recent studies demonstrate that urinary vesical wall has the ability to regulate its water permeability (Candia et al. 1997). Protection against water loss is mainly based on the oliguria: urine will concentrate until it is isosmotic in relation to plasma. No amphibian can produce urine which could be hyperosmotic in relation to blood (Wilson 1989). Urine concentration mechanisms based on solutes resorption (until they are hypertonic to plasma), are characteristic of mammals, not amphibian.
Urinary pH registered in the present study was almost neuter (6.68±0.71). It is acid (up to 5) on carnivores, and alkaline on herbivores (up to 8.4) (Kaneko 1989, Coles 1989). Urinary pH would be from 5-8 on birds, diminishing up to 4.7 in aquatic species when they are submerged (Coles 1989). Glucose tubular resorption would be total in this species, because its presence in urine was not verified in any of the cases; glucosuria is abnormal in all domestic animals (Coles 1989, Kolb 1989). Urobilinogen found in the urine of the studied frogs would be normal, because it is the hemoglobin metabolism terminal product; it is habitually present in urine of both carnivorous and herbivores species (Coppo 2001).
On birds urine, but not in those of mammals, it would be normal to discover vestiges of blood, bilirubin, protein and ketones (Coles 1989), as it found in these frogs. Germs and cylinders presence is abnormal on mammals urine, but the existence of epithelial (genital and urinary) cells is usual, as well as some leukocytes, such as those found in frogs. The presence of abundant phosphate, carbonate and urate crystals reported respectively in carnivores, herbivores and birds (Coles 1989), contrasts with the absence of crystals in the urine of these frogs. Physicochemical characteristics verified on R. catesbeiana urine (low density, pH nearly neutral, absence of crystals) are in correspondence with those from species whose habitat facilitates the residues excretion without necessity of preserving great water quantities (Coppo 2001).
Proteinogram: Total protein frog values (4.34±0.66 g/dL) were quite different to the habitual values on mammals (6.5-7.5 g/dL, Kolb 1987; 5.8-7.8 g/dL, Coles 1989; 5.2-8.9 g/dL, Kaneko 1989; 6-8.5 g/dL, Jain 1993, and 6-8 g/dL, Coppo 2001). On the other hand, they were similar to those reported on terrestrial amphibians as Bufo sp (3.6-6 g/dL, Coppo 2001) and birds (2-5.5 g/dL, Coles 1989; 4-5.5 g/dL, Jain 1993, and 3.8-4.5 g/dL, Coppo 2001). In the present study, bullfrog plasma albumin (1.58±0.33 g/dL) was similar to those published on toads (1-1.9 g/dL) and birds (1.6-2 g/dL)(Coppo 2001), but it was lower than those reported on mammals (3-3.9 g/dL, Coppo 2001; 2.8-3.2 g/dL, Kolb 1987, and 2.6-4 g/dL, Coles 1989).
Alpha-1 globulin mean value (0.22±0.05 g/dL in these frogs) was similar to those found on toads (0.3-0.4 g/dL), fowls (0.1-0.2 g/dL) and domestic mammals (0.2-0.4 g/dL) (Coppo 2001). On mammals, unified values for alpha-1 and alpha-2 globulins would be 0.9-1.3 g/dL (Kolb 1987) and 0.42-0.63 g/dL (Coles 1989). On the studied frogs, the value of alpha-2 globulin (0.51±0.09 g/dL) did not differ much from those published by Coppo (2001) on toads (0.4- 0.5 g/dL), fowls (0.3-0.4 g/dL) and mammals (0.3-0.7 g/dL). Bullfrog beta globulin (0.72 ± 0.16 g/dL) was smaller than those reported on toads (0.9-1.3 g/dL, Coppo 2001) and mammals (0.8-1.1 g/dL, Kaneko 1989, and 0.9-1.8 g/dL, Coppo 2001), but it was higher than those found on fowls (0.5-0.7 g/dL, Coppo 2001).
In the present study, frogs gamma globulin values (1.35±0.28 g/dL) resulted similar to those found by Coppo (2001) on toads (1.2-1.8 g/dL) and fowls (0.7-1.4 g/dL), but they were lower than those reported on mammals (1.4-2.2 g/dL, Kolb 1989, and 0.9-2.7 g/dL, Coppo 2001). On these frogs, albumin / globulin ratio (0.54±0.12) was similar to that published on toads (0.3-0.5, Coppo 2001) and ruminants (0.42-0.76, Kaneko 1989), but it was lower than those reported on fowls (0.8-1.1) and carnivorous (l.4) (Coppo 2001), as well as those published on horses (0.62-1.46, Kaneko 1989).
On mammals, all albumins and half of globulins that circulate in blood, are synthesized in the liver; on amphibians, this function would be carried out by the hepatopancreas (Goldstein 1982). Plasma proteins intervene in acid-base balance, immunity, coagulation, colloid-osmotic pressure, and blood viscosity; they also transport hormones, vitamins, lipids, bilirubin, calcium, zinc, iron and copper (Kolb 1987, Kaneko 1989). Albumins are excellent indicators of protein biosynthesis; they also operate as nutritional reserve of amino acids, which would be habitually exchanged between plasma and tissues, mainly in skeletal muscles (Coppo 2001). Proteinogram is of clinical interest because it facilitates the diagnosis towards alterations such as alimentary lacks, malabsorption, hepatopathies, inflammations, and renal, coagulative, and immunologic dysfunctions (Coles 1989, Pesce and Kaplan 1990, Coppo 2001).
Non proteic nitrogen (NPN): Creatinine is the muscular creatine phosphate metabolic residue. Its value on the studied amphibians (4.83±1.22 mg/L) was similar to those found on toads (3-6 mg/L, Coppo 2001), but it was lower than those published on birds (5-15 mg/L, Coles 1989), and mammals (5-27 mg/L, Kaneko 1989; 10-20 mg/L, Coles 1989, and 9- 19 mg/L, Coppo 2001).
Urea, the final product of protein metabolism, had a plasma value of 84 mg/L (0.08 g/L) on the trial frogs. This concentration was lower than those reported on mammals (0.10-0.30 g/L, Kaneko 1989; 0.20-0.44 g/L, Coppo 2001; 0.28-0.34 g/L, Kolb 1987, and 0.35-0.45 g/L, Coles 1989). Uric acid is the excretion residue of nucleic acids (mammals), and proteins (birds) (Kolb 1987, Coppo 2001). Its value on bullfrog (13.4±2.89 mg/L) was similar to those found on toads (9-16 mg/L, Coppo 2001) and domestic mammals (0-20 mg/L, Kaneko 1989, and 5-13 mg/L, Coppo 2001), but it was lower than those reported on fowls (49-67 mg/L, Coppo 2001) and other birds (25-140 mg/L, Coles 1989).
These results confirm that R. catesbeiana is an ureotelic rather than uricotelic amphibian. Contrary to their uricotelic relatives (reptiles and birds), mature amphibian, as well as mammals, would excrete NPN in the form of urea, although in tadpole stage they would excrete ammonia (Eckert 1992). Exceptionally, some frogs (Phyllomedusa sauvagii and Chiromantis xerampelina) would excrete NPN in urate form, and some toads (Xenopus laevis) would be ureotelic during their permanency on earth, but they would become ammoniotelic when they are in water (Goldstein 1982).
In spite of their ureotelic pattern, amphibians would retain urea to regulate their osmotic pressure. Environment salinity increase would cause urea retention because it increases the urea hepatic synthesis and decreases the urea renal excretion. This fact could be proved in Rana cancrivora specimens exposed to fresh water versus sea water. They registered differences in plasma osmolarity (290 versus 830 mOsm/l), urea (40 versus 350 mMol/l), sodium (125 versus 250 mEq/l) and urine flow (100 versus 1%) respectively (Goldstein 1982). This clearly indicates that frogs utilize urea to maintain their hyperosmolarity with the environment (Wilson 1989).
NPN earns importance in diagnosis of renal failure, metabolic alterations and nutritional disturbances (Pesce and Kaplan 1990, Coppo 2001). In hatcheries, several infections, intoxications, and parasitosis (myxosporea) affect frogs kidneys; in the same sense, certain metabolic illnesses cause renal obstruction with NPN retention (Lima and Agostinho 1992).
Lipidogram: Triglycerides level on the frogs of the present trial (0.43±0.10 g/L) was similar to those found on toads (0.31-0.73 g/L), and it was not so different from those reported on mammals (0.26-0.95 g/L, Coppo 2001). On birds, triglyceridemia would be higher, reaching 2.2 g/L (Kolb 1987). Bullfrog total cholesterol (0.62±0.14 g/L) was higher than the one found on pigs (0.36-0.54 g/L, Kaneko 1989), but it was lower than those published on toads (0.91-1.83 g/L, Coppo 2001), herbivore mammals (0.77-1.73 g/L, Kolb 1987), carnivorous (1.35-2.70 g/L, Kaneko 1989), and birds (1-2 g/L, Coles 1989; 1 g/L, Kolb 1987, and 0.90- 1.30 g/L, Coppo 2001).
The HDL-C value found on these frogs (0.04±0.01 g/L) was lower than those published by Coppo (2001) on human beings (0.4- 0.6 g/L), horses (0.5-0.7 g/L) and dogs (0.8-1.2 g/L). Frogs LDL-C concentration (0.39±0.09 g/L) was not quite different from those reported on dogs (0.2-0.6 g/L) and horses (0.2-0.4 g/L), but it was lower than those published on human beings (0.9-1.6 g/L, Coppo 2001). In this study, alpha lipoprotein proportion (7.34%) was markedly lower than those published on fowls (67-75%), dogs (84-90%), cows (87-90%) and human beings (32-44%), and beta lipoprotein ratio (92.65%) was significantly higher than those found on dogs (10-16%), ruminants (10- 13%), fowls (16-22%, with 8-12% of pre-beta lipoprotein) and human beings (42-55%, with 8-16% of pre-beta lipoprotein)(Coppo 2001).
Lipoprotein metabolism would reveal similar characteristics among different animal species, but it would not be exactly the same in all of them. Canine, feline, equine, ruminant and some rodents would have "HDL pattern", characterized by plasma alpha lipoprotein pre-dominance. When these animals are fed on fatty diets, cholesterol is linked by HDL rather than LDL, avoiding noxious effects due to protective action attributable to HDL. Human beings, pigs, rabbits, marmots, and several monkey species, would respond to the "LDL pattern", because when they consume fat, they increase their beta lipoprotein and they are exposed to a major atherogenic risk (Bauer 1997, Coppo 2001). Bearing in mind that C-LDL level was higher than C-HDL level, and that alpha lipo-protein ratio was lower than beta lipoprotein ratio, frogs would join in the "LDL pattern" rather than the "HDL pattern". Similarly, other researchers found rates of LDL higher than HDL in R. catesbeiana plasma, although they also found vestiges of low density lipoprotein (VLDL), which was not detected in the present study (Suzuki et al. 1976).
Lipidogram values may vary due to age, heredity, food type, and diverse illnesses, such as hepatic and renal failure, malabsorption, stress, hypothyroidism, and infections. Cholesterol would rise in the initial phase of starvation (due to high fat mobilization), but in case of prolonged fast its plasma concentration tends to decrease (Kaneko 1989, Coles 1989, Pesce and Kaplan 1990, Coppo 2001).
Glucose: Glucose concentration on the studied frogs (0.50±0.12 g/L) was similar to the one reported on toads (0.55-0.61 g/L, Coppo 2001) and ruminants (0.45-0.70 g/L, Coles 1989), but it was lower than those published on birds (2.2- 2.9 g/L, Coppo 2001; 1.3-2.6 g/L, Kolb 1987, and 1.9-4.5 g/L, Coles 1989). Glucemia would also be higher in monogastric mammals (0.83- 0.91 g/L, Coppo 2001; 0.65-1.50, Kaneko 1989, and 0.6-1.2 g/L, Coles 1989).
In amphibians, glucemia would decrease during the stage previous to winter lethargy, with an increase of hepatic glycogen; hypoglucemia would cause hypothermia. Insulin would decrease glucemia and temperature in R. catesbeiana ; on the contrary, high temperature would increase the O 2 consumption and it would cause hyperglucemia (Rocha and Branco 1998). Plasma glucose would be regulated through insulin, glucagon, adrenaline, cortisol, and thyroid hormones (Curtis and Barnes 2001). Physiologically, glucemia might vary by effects of age and physical exercise; pathologically it would alter in malnutrition, stress, and endocrine and hepatic failures (Coles 1989, Kaneko 1989, Coppo 2001).
Ionogram: Sodium level in the studied frogs (118.6±11.2 meq/L) was similar to the levels reported on R. catesbeiana (108±5 meq/ L, Cathers 1997) and other frogs of fresh water (109 meq/L, Wilson 1989, and 92-125 meq/ L, Eckert 1992). Natremia would be slightly higher on toads (128-139 meq/L, Coppo 2001), birds (131-157 meq/L, Coles 1989, and 130-146 meq/L, Coppo 2001) and domestic mammals (132-156 meq/L, Kaneko 1989; 110- 155 meq/L, Coles 1989, and 132-146 meq/L, Coppo 2001).
Plasma potassium concentration would be 2.4-6.7 meq/L (Coles 1989, Kaneko 1989) and 3.3-5.1 meq/L (Coppo 2001) on mammals; 2.5-4.5 meq/L (Coles 1989) and 5.1-6.4 meq/L (Coppo 2001) on birds; 3.7-6.2 meq/L on toads (Coppo 2001), and 2.6 meq/L (Wilson 1989), 3 meq/L (Eckert 1992) and 2.7±0.71 meq/L (Cathers 1997) on frogs. The kalemia reported on amphibians was approximately similar to that found in this trial on R. catesbeiana (3.62±0.71 meq/L).
Chloride value in the studied frogs (108.6±6.3 meq/L) was slightly higher than those reported on frogs (70-98 meq/L, Eckert 1992, and 77±6 meq/L, Cathers 1997), and toads (85-96 meq/L, Coppo 2001). However, it was similar to the values published on mammals (94- 123 meq/L, Kaneko 1989; 88-118 meq/L, Coles 1989, and 93-112 meq/L, Coppo 2001).
There were no great differences registered between calcium concentration on studied frogs (8.31±1.42 mg/dL) and plasma calcium levels reported on the same species (8.05±0.88 mg/dL, Cathers 1997), other frogs (8.4 mg/dL, Wilson 1989, and 9.2 mg/dL, Eckert 1992), toads and fowls (7.8-9.6 mg/dL and 9.3-10 mg/dL respectively, Coppo 2001), and mammals (8-12 mg/ dL, Coles 1989; 6.2-13.6 mg/dL, Kaneko 1989, and 8.4-11.5 mg/dL, Coppo 2001).
The value of inorganic phosphorous obtained in the present study (8.83±1.8 mg/dL) was higher than the one reported by Cathers (1997) on R. catesbeiana (3.3±0.7 mg/dL). Nevertheless, it was similar to those obtained on toads and birds (6.3-8.2 mg/dL and 6.2-8.7 mg/dL respectively, Coppo 2001). Amphibians phosphatemia would be higher to those published on mammals (3-6 mg/dL, Kolb 1987; 3-8 mg/dL, Coles 1989; 2.6-6.9 mg/dL, Kaneko 1989, and 3-5.2 mg/dL, Coppo 2001).
In these frogs, plasma magnesium value (2.41±0.49 mg/dL) was similar to those found on bullfrog (2.05±0.35 mg/dL, Cathers 1997), other fresh water frogs (3.1 mg/dL, Wilson 1989, and 3.9 mg/dL, Eckert 1992), toads and birds (2.3-4.2 mg/dL and 2-3 mg/dL respectively, Coppo 2001), as well as domestic mammals (2.5-3 mg/dL, Kolb 1987; 1.8-3.7 mg/dL, Kaneko 1989; 1.8-4 mg/dL, Coles 1989, and 1-3 mg/dL, Coppo 2001). The iron level on the studied frogs (142.1±29.6 ug/dL) coincided with the reference interval reported on toads (83-145 ug/dL, Coppo 2001), and domestic mammals (100-180 ug/dL, Kolb 1987; 57-222 ug/dL, Kaneko 1989; 86-193 ug/dL, Jain 1993, and 93-165 ug/dL, Coppo 2001).
In frogs, electrolytes and water enter the organism through skin and digestive tract, being eliminated by skin, urine and feces; amphibians skin could check the osmolarity of the surrounding liquid (Wilson 1989). Fresh water frogs are hyperosmotic in its environment, that is the reason why they tend to incorporate water by the skin and decrease their corporal saline concentration (Goldstein 1982). In these animals, high internal osmolarity (210- 290 mOsm/L) and low external osmolarity (50 mOsm/L), could provoke overhydration (the entry of water by osmotic gradient) and loss of electrolytes (diffusion by concentration gradient). Homeostasis is achieved with abundant hypotonic urine and an increase in electrolytes tubular resorption and salt cutaneous absorption (Eckert 1992).
Diverse illnesses can alter electrolytic homeostasis when disturbing the feedback of internal environment regulatory hormones (aldosterone, parathormone, calcitonin, vasopressin, thyroid, natriuretic), thus causing metabolic disturbances (Coles 1989, Kaneko 1989, Pesce and Kaplan 1990, Uchiyama et al. 1998, Coppo 2001). Mineral nutritional deficiencies are frequent in frog hatcheries, especially related to calcium lack, which provokes osseous malformations (Lima and Agostinho 1992).
Enzymogram: On frogs of the present study, ALP mean activity (157 IU/L) was considerably lower than that reported on birds (2 100-3 200 IU/L, Coppo 2001), but it was similar to those published on pigs and dogs (118-395 and 20-156 IU/L respectively, Kaneko 1989), as well as to those found on human beings and domestic mammals (95-185 and 90-230 IU/L respectively, Coppo 2001). Nonetheless, frog ALT (12.4 IU/L) was alike those from remaining compared species, such as human beings (3-14 IU/L, Coppo 2001) and domestic mammals (8-27 IU/L, Kolb 1987; 3-102 IU/L, Kaneko 1989, and 6-13 IU/L, Coppo 2001).
AST activity (48.1 IU/L in studied frogs) was similar to that published on ruminants (36- 45 IU/L, Coppo 2001), although it was considerably lower than those reported on fowls (270 IU/L, Kolb 1987, and 100-350 IU/L, Coles 1989), and horses (165 IU/L, Kolb 1987, and 152-225 IU/L, Coppo 2001). According to Coppo (2001), human beings and canines would register lower AST activities (4-19 IU/L and 8-15 IU/L respectively).
GGT enzymatic concentration on these frogs (9.2 IU/L) was not different from those reported on human beings (9-36 IU/L, Coppo 2001) and domestic mammals (1.2-13.4 IU/L, Kaneko 1989, and 5-21 IU/L, Coppo 2001). Frog LDH (117 IU/L) was lower than those published on cows (692-1 445 IU/L, Kaneko 1989), but it matched with the reference interval on birds (75-650 IU/L, Coles 1989), canines (45-233 IU/L, Kaneko 1989), domestic mammals and human beings (72-153 and 62- 148 IU/L respectively, Coppo 2001). In 11 anesthetized R. catesbeiana specimens, values of LDH lower than those obtained in this study (33±20 IU/L), were reported (Cathers 1997). The effect of anesthesia or the employment of another technique for the enzymatic assay could be the cause of such difference.
Frog CHE activity (168 IU/L) was markedly lower than in human beings (3 400-6 800 IU/L, Coppo 2001). Higher values of this enzyme were also reported on horses (2 000-3 100 IU/L), and pigs (400 IU/L), although on goats and cows (110 and 70 IU/L respectively) they were lower (Kaneko 1989). At the same time, frog CPK (432 IU/L) was higher than those published on remaining compared species, such as birds (100-200 IU/L) and domestic mammals (2-28 IU/L, Kaneko 1989, and 39-85 IU/L, Coppo 2001).
Chronic hepatic disorders result in increased plasma ALP in most animals. During normal bone growth in young animals, a large amount of ALP is in plasma; osteopathies also results in increased plasma ALP. Recently, GGT has been found to be liver specific and is used as an indicator of hepatobiliary disease. Increased plasma AST is associated with cell necrosis of the liver and skeletal or cardiac muscle, starvation and lack of vitamin E. ALT is well established as a marker of acute hepatic damage. Injury to skeletal and cardiac muscle results in considerable increase in plasma CPK. Brain also contains great amounts of the latter. LDH is released after cellular damage to the liver, lung, muscle, heart and kidney tissue. CHE is originated in liver, pancreas, intestinal mucosa and brain; decrease in CHE has been reported in liver failure, muscular dystrophy, chronic renal disease and organophosphate insecticide intoxication (Coles 1989, Kaneko 1989, Pesce and Kaplan 1990, Coppo 2001).
The obtained data could be useful to optimize the diagnosis of sanitary, metabolic and nutritional dysfunctions in R. catesbeiana . It could also cooperate with the search of real nutritional requirement of this amphibian in captivity. Such knowledge may lead to an improvement in frog meat production, thus a promising future. Frog meat world consumption ranges between 30 000 and 50 000 tn/ year, with an existing market for skin (leather crafts), intestine (esthetic surgery thread), liver (foie gras elaboration), and fat for cosmetic use (Lima and Agostinho 1992, Roman 1994, Pavan 1996).
Some hematic and urinary physiological values from R. catesbeiana were similar to those reported on other frogs (PCV, Na, K, Ca, Mg), and toads (total protein, albumin, alpha-1, alpha-2 and beta globulins, uric acid, triglycerides, glucose, P, Fe). In spite of the close phylogenic relationship between amphibians and birds, some parameters were quite different (RBC, hemoglobin, MCV, lymphocytes, creatinine, glucose, ALP, urinary density and sediment). Several frog blood values were similar to those found in human beings (ALT, GGT, bleeding and coagulation time), and both domestic monogastric (neutrophils, lymphocytes, LDL-C, Cl, LDH) and polygastric mammals (fibrinogen, AST).
Acknowledgments
We thank the people from Oberá, Jardín América and Paso de la Patria, for their valuable cooperation; Wiener Lab for supply of reagents used in the trial and P. Zeinsteger for the English language revision.
Resumen
Con el propósito de obtener valores normales sanguíneos y urinarios, 302 muestras de ejemplares sanos de Rana catesbeiana del nordeste argentino (9-21 meses de edad, 50-350 g de peso vivo, 50% de cada sexo), fueron analizados por espectrofotometría, electroforesis, densitometría, refractometría y microscopía. Fueron obtenidos intervalos de confianza (p<0.05) para hematocrito (28.6-31.6%), eritrocitos (0.40-0.44 T/L), VCM (686-732 fL), hemoglobina (6.41-7.20 g/dL), HCM (151-164 pg), CHCM (22.6-24.0%), leucocitos (18.7-22.3 G/L), neutrófilos (58.4-63.4%), linfocitos (23.9-29.8%), monocitos (2.1-3.8%), eosinófilos (4.6-7.0%), basófilos (2.9-4.1%), tiempo de sangría (289-393s), tiempo de coagulación (452- 696s), tiempo de protrombina (76-128s), densidad urinaria (1.0061-1.0089 g/mL), pH urinario (6.38-6.96), fibrinógeno (0.59-0.99 g/dL), proteínas totales (4.19-4.49 g/dL), albúmina (1.49-1.67 g/dL), alfa-1 globulina (0.20-0.24 g/dL), alfa-2 globulina (0.48-0.54 g/dL), beta globulina (0.68-0.77 g/dL), gamma globulina (1.28-1.42 g/dL), relación albúmina/globulinas (0.50-0.58), creatinina (4.09-5.56 mg/L), urea (76.1-92.4 mg/L), ácido úrico (11.5-15.4 mg/L), triglicéridos (0.34-0.52 g/L), colesterol total (0.56-0.67 g/L), C-HDL (0.03-0.05 g/L), C-LDL (0.34-0.44 g/L), alfa lipoproteína (6.01-8.67%), beta lipoproteína (91.3-93.9%), glucosa (0.45-0.54 g/L), Na (116-121 meq/L), K (3.42- 3.81 meq/L), Cl (100-116 meq/L), Ca (7.98-8.61 mg/dL), P (8.31-9.36 mg/dL), Mg (2.26-2.55 mg/dL), Fe (105-178 ug/dL), ALP (144-170 IU/L), ALT (10.0-14.8 IU/L), AST (42.8-53.4 IU/L), GGT (7.8-10.6 IU/L), LDH (99-135 IU/L), CHE (151-185 IU/L) y CPK (365-500 IU/L). Algunos intervalos fueron semejantes a los obtenidos en anfibios, aves o mamíferos, pero otros resultaron muy diferentes. Estos parámetros son útiles para evaluar estados sanitario, metabólico y nutricional de la rana toro en cautiverio.
Palabras clave: Rana catesbeiana, valores sanguíneos, pruebas coagulativas, parámetros urinarios.
References
Bachman, G.L., S. Uhlen & C.A. Herman. 1998. Localization and changes in distribution of brain alpha 2 and beta-adrenoceptors in response to acclimation state in american bullfrog (Rana catesbeiana). Gen. Comp. Endocrinol. 110: 166-174. [ Links ]
Bauer, J.E. 1997. Metabolismo comparado de lípidos y lipoproteínas. Pet´s Cienc. 13: 362-376. [ Links ]
Bicego, K.C. & L.G. Branco. 1999. Seasonal changes in the cardiorespiratory responses to hypercarbia and temperature in the bullfrog, Rana catesbeiana. Comp. Biochem. Physiol. 124: 221-229. [ Links ]
Busk, M., F.B. Jensen & T. Wang. 2000. Effects of feeding on metabolism, gas transport, and acid-base balance in the bullfrog, Rana catesbeiana. Am. J. Physiol. 278: 185-195. [ Links ]
Candia, O.A., A. Mia & T. Yorio. 1997. Evidence of baso-lateral water permeability regulation in amphibian urinary bladder. Biol. Cell. 89: 331-339. [ Links ]
Carnevia, D. 1995. Ranicultura, estado actual de la explotación y comercialización de ranas para consumo. Anales de las VIII Jornadas Veterinarias de Corrientes, Argentina, 81 p. [ Links ]
Cathers, T. 1997. Serum chemistry and hematology for anesthetized american bullfrogs. J. Zoo & Wildlife Med. 28: 171-174. [ Links ]
Céspedez, J.A. & B.B. Alvarez. 1999. Biodiversidad de anfibios del nordeste argentino. Estado actual. Actas Cienc. & Técn.UNNE 6: 73-76. [ Links ]
Coles, E.H. 1989. Veterinary Clinical Pathology. Saunders. Philadelphia. 486 p. [ Links ]
Coppo, J.A. 2001. Fisiología Comparada del Medio Interno. Dunken. Buenos Aires. 297 p. [ Links ]
Curtis, H. & M.S. Barnes. 2001. Biology. Freeman. New York. 1496 p. [ Links ]
Desser, S.S., M.E. Siddall & J.R. Barta. 1990. Ultraestructural observations on the developmental stages of Lankesterella minima (Apicomplexa) in experimentally infected Rana catesbeiana tadpoles. J. Parasit. 76: 97-103. [ Links ]
Dias, J.L. & J.C. Catao-Dias. 1989. Influence of temperature on the inflammatory cell response induced experimentally with a foreign body in the tail of giant bullfrog tadpoles, Rana catesbeiana. Tesis, University of Sao Paulo, Brasil, 67 p. [ Links ]
Duré, M.I. & A.I. Kehr. 1999. Explotación diferencial de los recursos tróficos en cuatro especies de bufonidos del nordeste argentino. Actas Cienc. & Técn. UNNE 6: 17-20. [ Links ]
Eckert, R. 1992. Animal Physiology. Freeman. New York. 683 p. [ Links ]
Fontenot, L.W., G.P. Noble, J.M. Akins, M.D. Stephens & G.P. Cobb. 2000. Bioaccumulation of polychlorinated biphenyls in ranid frogs and northern water snakes from a hazardous waste site and a contaminated watershed. Chemosph. 40: 803-809. [ Links ]
Fraser, C.M. 1986. The Merck Veterinary Manual. Merck Inc. Rahway. 2092p. [ Links ]
Goldberg, S.R., C.R. Bursey & H. Cheam. 1998. Helminths of two native frog species (Rana chiricahuensis, Rana yavapaiensis) and one introduced frog species (Rana catesbeiana) from Arizona. J. Parasitol. 84: 175-177. [ Links ]
Goldstein, L. 1982. Comparative Physiology. Saunders. Philadelphia. 454 p. [ Links ]
Hecnar, S.J. 1995. Acute and chronic toxicity of ammonium nitrate fertilizer to amphibians from southern Ontario. Environ. Toxicol. & Chem. 14: 2131-2137. [ Links ]
Herman, C.A. & B.G. Luczy. 1999. Eicosanoids in the brain of warm and cold-acclimated bullfrogs. Adv. Exp. Med. Biol. 469: 669-674. [ Links ]
Jain, N.C. 1993. Essentials of Veterinary Hematology. Lea & Febiger. Philadelphia. 417 p. [ Links ]
Jorgensen, N.C. 1995. Amiloride sensitive Na+/H+ exchange stimulated by cellular acidification or shrinkage in red blood cells of the front, Rana temporaria. J. Comp. Physiol. 165: 450-457. [ Links ]
Kaneko, J.J. 1989. Clinical Biochemistry of Domestic Animals. Academic Press. San Diego. 832 p. [ Links ]
Kolb, E. 1987. Fisiología Veterinaria. Acribia. Zaragoza. 1115 p. [ Links ]
Lima, S.L. & C.A. Agostinho. 1992. A Tecnología de Criaçao de Rás. Impr.Univ. Vicosa. 288 p. [ Links ]
Longo, A.D. 1985. Manual de Ranicultura. Icone. Sao Paulo. 317 p. [ Links ]
Pavan, M. 1996. Carne de rana toro. El batracio versus la merluza. Vet. Arg. 13: 741-742. [ Links ]
Pesce, A. J. & L.A. Kaplan. 1990. Methods in Clinical Chemistry. Mosby. Saint Louis. 1380 p. [ Links ]
Raimon, E., N. Ronci, M.Ozzan, R.Faryluk, P.Borgogno, D.González & W.Suárez. 1996. Caracterización citológica y citométrica de elementos formes en sangre de Rana catesbeiana. Monografía, Biblioteca de la Facultad de Ciencias Exactas. UNAM. Posadas, Argentina. 10 p. [ Links ]
Rocha, P.L. & L.G. Branco. 1998. Physiological significance of behavioral hypothermia in hypoglycemic frogs (Rana catesbeiana). Comp. Biochem. Physiol. 119: 957-961. [ Links ]
Roman, L.R. 1994. Ranicultura. Nueva tecnología de la cría de rana toro. Anales del VII Congreso Argentino de Ciencias Veterinarias. Buenos Aires. 207 p. [ Links ]
Singh, K. 1978. Hematology of the common Indian frog Rana tigrina. III. Hemoglobin and hematocrit. Anat. Anz. 143: 161-166. [ Links ]
Suzuki, N., K. Deguchi, N. Ueta, H. Nagano & R. Shukuya. 1976. Chemical characterization of the serum VLDL and HDL from bullfrog, Rana catesbeiana. J. Biochem. 80: 1241-1246. [ Links ]
Uchiyama, M., T. Takeuchi & K. Matsuda. 1998. Effects of homologous natriuretic peptides in isolated skin of the bullfrog, Rana catesbeiana. Comp. Biochem. Physiol. 120: 37-42. [ Links ]
Wilson, J.A. 1989. Principles of Animal Physiology. McMillan. New York. 984 p. [ Links ]
Wright, M.L., B.A. Rzasa, R.J. Weir & A.M. Babski. 1999. Influence of cortisol on the larval bullfrog thyroid axis in vitro and in vivo and on plasma and ocular melatonin. Gen. Comp. Endocrinol. 116: 249-260. [ Links ]
Zablith, A.C., J.L. Catao & I.L. Sinhorini. 1997. Análise ultraestrutural da resposta celular inflamatória em girinos de rá touro gigante (Rana catesbeiana). Anais de XXV Congresso Brasileiro de Veterinária, Gramado, Brasil, comunicação ASI 004-P. [ Links ]

