


Services on Demand
Journal
Article
 Article in xml format
 Article references
 Send this article by e-mail
Indicators
-
 Cited by SciELO
 -
 Access statistics
Related links
-
 Similars in
SciELO
Similars in
SciELO  uBio
uBio
Share

 Permalink
Revista de Biología Tropical
On-line version ISSN 0034-7744Print version ISSN 0034-7744
Rev. biol. trop vol.52 suppl.2 San José Dec. 2004
Box-Jenkins analysis for shark landings in Costa Rica
Roger Bonilla1 & Juan B. Chavarría2
1 Escuela de Estadística, Universidad de Costa Rica, 2060 San José, Costa Rica. Fax (506) 207-5692; rebonill@cariari.ucr.ac.cr
2 Centro de Investigaciones en Ciencias del Mar y Limnología (CIMAR). Universidad de Costa Rica, 2060 San José, Costa Rica. Fax (506) 207-5080; jchavarr@cariari.ucr.ac.cr
Received 14-I-2004. Corrected 01-III-2004. Accepted 22-IV-2004.
Abstract
Sharks are highly vulnerable to intense and prolonged fishery extraction. This article analyzes the data on shark landings from the artisan fishing fleet on Costa Ricas Pacific coast between 1988 and 1997. The data come from an invoicing system administered by the Costa Rican Fisheries Institute (Instituto Costarricense de la Pesca y Acuacultura, INCOPESCA). Pacific coast shark fishing during the period under study represented approximately 20% of the total national fisheries volume. According to data from the invoicing system, the Northern Pacific region was the most productive, reporting 58% of the shark catch nationwide. Within this region, shark fishing in Papagayo Gulf represented 91% and 53% of the landings by fishery region and nationwide, respectively. The mid-sized and advanced (length of boat > 10 meters) artisan fishing fleets reported 96% of the shark catches in the zone. The study of shark fisheries in the Papagayo Gulf zone is crucial for an understanding of fishery dynamics for this resource at the national level. A monthly chronological series was constructed with the landings in the Papagayo Gulf zone, and a Univariate Box-Jenkins (UBJ) Model was estimated for first-order moving averages MA(1) with a seasonal component of the 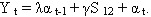 type.
type.
Keywords: Sharks, time series, Box-Jenkins Models, fisheries, Costa Rica.
Sharks are slow growing and low fertility fish, due to their late maturation (Castillo et al. 1997, Hoening & Gruber 1990). The male usually reaches maturity at eight years and the female is fertile for a short period of time, giving the shark a low rate of reproduction. The shark has a very long life span, low natural mortality, a long gestation period, a complex spatial structure, segregation by size and sex, and seasonal migrations (Vannuccini 1999, Castillo et al. 1997, Bonfil 1994, Hoening & Gruber 1990). The characteristics of the sharks pattern of life make these animals highly vulnerable to intense and prolonged fishery extraction, and this situation has led some of the worlds fisheries to show a decline in the abundance of populations of some species (Castillo et al. 1997).
The use of modern technologies, along with growing populations, expanding international markets and changing consumption patterns in the industrialized countries has led to enhanced efforts in shark fisheries.
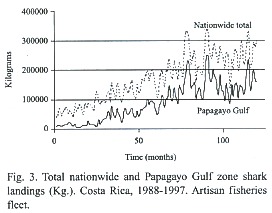
There are 40 species of shark that fall into 22 genera in Costa Rica (Nelson 1994), and the fishery trends shown by the elasmobranches (Fig. 3) were similar to those seen worldwide. Between 1988 and 1997, shark landings totaled 20.3 million kilograms.
The study proposes to identify univariate Box-Jenkins Models (UBJ) that describe the trend in shark catches for the artisan fishing fleet in Costa Rica, based on data coming from an invoicing system.
Material and methods
Data from the Costa Rican artisan fishery catch invoicing system were used from the 1988-1997 period. The data were selected for the Costa Rican Pacific coast, since fishery activities are more developed along this coast.
The information comes from the landing points, where a copy of each fish purchase invoice is collected by the Costa Rican Fisheries Institute (Instituto Costarricense de la Pesca y Acuacultura, INCOPESCA). The information is then organized in an electronic database.
Month and year (t=120), type of vessel, fishing gear, fishery site, and landing site data were added. In a second stage, commercial categories classified as "shark" were selected and those voyages that did not use line fishing were excluded, since shark fishing primordially uses this method.
The unit of analyses is a fishing sortie, which is represented by an invoice. Each fishing sortie implies an effort, which is difficult to measure with the information available in the invoicing system.
The response variable is the amount of shark (in Kg.) caught and landed per fishing trip.
Geographic variables were created (region and fishing zone) based on information included in the declared fishing site. Missing data was estimated by linear interpolation (approximately 5% of all landings for the period).
The UBJ Model was constructed for shark landings coming from the Papagayo Gulf zone (from 10º53 N - 85º56 Wto 10º20 N -85º52 W). Landings in this zone represented approximately 53% of the nationwide total for the period; the whole Northern Pacific region represented 58% of the national total.
In order to build the UBJ Model, the iterational approach suggested by Pankratz (1983) was followed: identification of the model, estimation of the parameters, verification of the models suitability, and when applicable, the forecast, although the latter is not always necessary.
A natural log transform was performed on the original series, in order to seasonalize series variance. Then the first difference was obtained from the transformed series  to seasonalize the series average, following the minimum variance method in successively differentiated series as suggested by Anderson (1976).
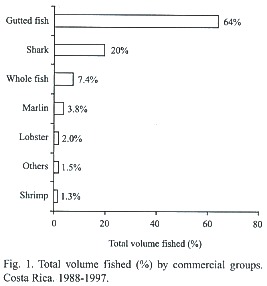
Estimates of the auto-correlation function r k and the partial auto-correlation function Φ k k were obtained to identify the UBJ Model with best fit to the time series data, where:
Results
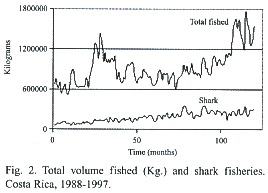
Shark fishing during the period under study represented 20% of the total fisheries volume in Costa Rica (Fig. 1), which coincides with the study carried out by Rojas et. al. (1999) at the Central American level. In absolute terms, shark landings totaled 20.3 million kilograms between 1988 and 1997.
Throughout the period, total fisheries volume and shark landing trends are continuous and ascending functions (Fig. 2).
The percentage of kilograms landed in the Northern Pacific region was 58% relative to the nations total. In this fishery region in particular, there are zones of nutrient blooms, which favor large schools of deep-sea fish.
In the Papagayo Gulf zone, the kilograms landed represent 91% of the total Northern Pacific landings and approximately 53% of the total national catch (11 million kg.). For shark fisheries studies, a study of the Papagayo Gulf zone is fundamental (Fig. 3). The mid-sized and advanced (boat length > 10 meters) artisan fishing fleets reported 96% of the shark landings in the zone.
Correlograms were obtained for the auto-correlation functions (ACF) and partial auto-correlation functions (PACF) (Fig. 4) in order to identify the UBJ Model with the best fit to the time series data.
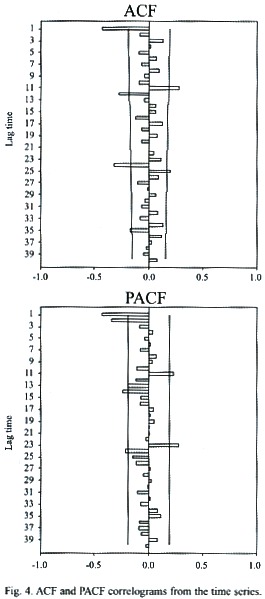
The ACF correlogram shows a significant inverse correlation at the first lag, which diminishes exponentially at greater lags. The PACF correlogram shows a similar pattern, but presents significant inverse correlations at the first and second lags, which is an indication of a first order moving average MA(1) pattern. The significant correlations in both correlograms at lag-times 12, 24, 36, and other multiples of 12 indicate the presence of a seasonal component, which must be taken into account when selecting the model.
The evidence indicates that the model with the best fit for the time series data is an MA(1) model with a seasonal component of the 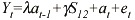 type, where
  and a t are constants and
The seasonal component γ is a parameter associated with the seasonality or periodicity of the chronological series, which is one year (12 months). The seasonal variations in shark fisheries are related to climatologic and oceanographic conditions, as well as the biological processes of the deep-sea fish. Model parameters were estimated with the maximum likelihood method, after an iterative process the parameters were obtained (Table 1) with their respective standard errors. The adjusted model for the time series is Y t =0.627at-1 + 0.796S12 – 0.003, where:
is the original series.
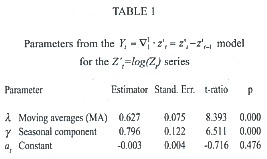
With the exception of the constant a t ' , all model parameters are highly significant (p < 0.01). The final model included the constant term at ' . Anderson (1976) examined the projections produced by variations to the Box-Jenkins analysis and found that including the constant term at ' , on the average produced more satisfactory results than setting it to zero.
Verification of Model suitability: After adjusting the model to the observed values, the standardized residuals produced were examined. The standardized residuals demonstrate a normal distribution (p > 0.05).
When the number of periods to be analyzed is reasonably large (t = 120), each auto-correlation of the true error Rk can be expected to show a normal distribution, with a mean of zero and a variance of  Box and Pierce (1970) demonstrated that when the true errors are substituted for their estimates, once the model adjustment is adequate, the foregoing result may not be met for small values of k. Box and Jenkins (1976) demonstrated that is an upper bound for the standard error of Rk ; for k=1, the standard error of Rk may be less than
  , but for k > 1,
  is a good approximation.
Residual correlograms were obtained, the values of R k beyond the range ±  are significantly different from zero at a 5% level of significance. Applying this result to the residual correlogram from the series for ±
  = ±0.5 it indicates that none of the R k is significantly different from zero, which suggests that the MA(1) model with a seasonal component is suitable for explaining the behavior of the time series.
It was not possible to make a reliable forecast for periods beyond one year, since time series adjusted to a model with a seasonal or periodic component have a very short-term memory, converging and stabilizing very quickly. Projections made for periods longer than one year under the assumption of the UBJ Models with seasonal components produce very large standard errors that increase over time.
Discussion
The adjusted UBJ Model in this article is based on data coming from invoices prepared by the owners or administrators of the landing sites and fish purchasing points (on the coast), of which INCOPESCA receives a copy.
The main variable for analysis is the weight landed (Kg.) and not the catch by unit of effort, as is customary in fisheries data. The artisan fishing fleet practices multi-specific fishing, and that makes it difficult to quantify the specific effort applied to shark fishing. Furthermore, for several years INCOPESCA has not granted new artisan fishery licenses, or does so on a cyclical basis. This problem is being studied in another article in preparation.
There is also a problem relating to the lack of precision regarding the reported fishing sites. The imprecision arises from a tendency to use very generic names for catch sites that cover very large areas; furthermore, due to legal aspects, when fishermen have caught sharks in areas that fishing for this resource is not allowed, they feel obligated to mention other fishing sites they visit to avoid legal and administrative problems. Historical data are being used in this study.
Finally, there is under-recording of the quantities of shark landed, since certain parts are paid on a differential basis (fins) and the fishermen are obliged to throw the rest of the shark overboard due its low price (Castro et al. 1999, Vannuccini 1999). In Costa Rica, to date there have been no studies estimating the quantity of shark wasted in this manner. Thus, precaution is recommended when analyzing the results from this article.
However, the results are consistent, insofar as the pattern of responses is expected to remain stable throughout the study period; i.e., the fishermen tend to provide the same responses, which do not obey any collective consensus.
In the resource preservation and conservation decision-making process, it is very important to have alternative forecasting methods for shark landings. This study provides one approach to greater information regarding Costa Rican shark fisheries.
Acknowledgements
We wish to acknowledge the assistance received from the Costa Rican Fisheries and Aquaculture Institute (Instituto Costarricense de Pesca y Acuacultura, INCOPESCA), Ricardo Gutierrez, the Central American Population Center (Centro Centroamericano de Población, CCP), Eric Alfaro and Sandra Hernandez, Subhash Lele, Adriana Guerrero, Ericka Mendez, and Carmen Duran.
Resumen
En este trabajo, se analizaron los datos de desembarque de tiburón de la flota pesquera artesanal en el Pacífico costarricense entre 1988 y 1997. Los datos provienen de un sistema de facturas administrado por el Instituto Costarricense de la Pesca (INCOPESCA). En el Pacífico, la pesca de tiburón en el período de estudio representó aproximadamente el 20% del volumen total de pesca a nivel nacional. De acuerdo con los datos del sistema de facturas, la región del Pacífico Norte fue la más productiva, reportando un 58% de los desembarques de tiburón a nivel nacional. En esta región, la pesca de tiburón en la zona del Golfo de Papagayo reportó 91% y 53% de los desembarques por región de pesca y a nivel nacional respectivamente. Las flotas pesqueras artesanales media y avanzada (longitud de embarcación > 10 metros) reportaron el 96% de los desembarques de tiburón de la zona. El estudio de la pesca de tiburón en la zona del Golfo de Papagayo es fundamental para entender la dinámica de la pesca del recurso a nivel nacional. Se construyó una serie cronológica mensual con los desembarques de la zona del Golfo de Papagayo y se estimó un modelo Box y Jenkins (UBJ) de medias móviles de primer orden MA(1) con componente estacional del tipo
References
Anderson, O.D. 1976. Time Series Analysis and Forecasting; The Box-Jenkins Approach. Butterworth and Co. London. 182 p. [ Links ]
Box, G. E. P & G. M. Jenkins. 1976. Time Series Analysis: Forecasting and Control. Holden-Day Press. San Francisco. 130 p. [ Links ]
Bonfil, R. 1994. Overview of World Elasmobranch Fisheries. FAO Fish. Tech. Paper 341. Rome. 77 p. [ Links ]
Box, G. E. P. & D. A. Pierce. 1970. Distribution of residual correlations in autoregressive-integrated moving average time series models. J of the Amer. Stat. Assoc. 65, 1509-1526. [ Links ]
Castillo, J.L., J. Márquez, A. Cid del Prado, S. Soriano & S. Ramírez. 1997. Descripción, evaluación y manejo de la pesquería artesanal de tiburón de Puerto Madero, Chiapas, México. Instituto Nacional de la Pesca. México. 13 p. [ Links ]
Castro, J.I., C.M. Woodley & R. Brudek. 1999. A Preliminary Evaluation of the Status of Shark Species. FAO Fish. Tech. Paper 380. Rome. 150 p. [ Links ]
Hoening, J. & Gruber, S. 1990. Life-history pattern in the elasmobranch: Implication for Fisheries Management. US Dept. of Commerce, NOAA Tech. Rep. 90: 1-16 p. [ Links ]
Nelson, J. 1994. Fishes of the World. Wiley & Sons. New York. 600 p. [ Links ]
Pankratz, A. 1983. Forecasting with Univariate Box-Jenkins Models. Wiley & Sons. New York. 562 p. [ Links ]
Rojas, R., J. Campos, M. Mug & A. Segura. 1999. Diagnóstico de la Pesca de Tiburón en Centroamérica, p. 50-53. In CIMAR (eds.). Memorias XX Años de Investigación: Centro de Investigación en Ciencias del Mar y Limnología CIMAR 1979-1999. Universidad de Costa Rica. San José. [ Links ]
Vannuccini, S. 1999. Shark Utilization, Marketing and Trade. FAO Fish. Tech. Paper 389. Rome. 130 p. [ Links ]

