


 Articulo en XML
 Referencias del artículo
 Enviar articulo por email
 Citado por SciELO
  Similares en
SciELO
Similares en
SciELO  uBio
uBio 
 Permalink
Revista de Biología Tropical
versión On-line ISSN 0034-7744versión impresa ISSN 0034-7744
Rev. biol. trop vol.47 no.1-2 San José jun. 1999
in the San Blas Archipelago, Caribbean Panamá
Luis D'Croz 1, 2 D. Ross Robertson1 José A. Martínez2
Received 14-V-1998. Corrected 11-XI-1998. Accepted 4-XII-1998.
Abstract
To investigate possible seasonal patterns in water quality and plankton distribution, weekly samples were collected in a coral reef lagoon and in surrounding nearshore waters over a two year period. Additionally, two oceanographic surveys were also conducted in a larger area surrounding the primary study site during the seasonal extremes. The resulting information corroborated previous observations that this area is as an oligotrophic environment. The larger-scale sampling revealed seasonal variation in cross-shelf gradients in plankton, fish-egg and larval densities that are probably related to the strong onshore winds that are typically present during the dry season. Although some limited nutrient enrichment occurs in parts of the nearshore area during the rainy season, the highest plankton density and biomass were recorded in shallow nearshore waters during the windy dry season. Larvae of numerous fish taxa were collected in these nearshore areas during the dry season, suggesting seasonal aggregation. During the rainy season, fish larvae were spread more evenly across the shelf and into nearshelf waters.
Key words
Nutrients, plankton, fish larvae, cross-shelf distribution, Caribbean Panamá.
Coral reefs in the San Blas Archipelago are among the best developed in the shouthernmost part of the Caribbean Sea. The low plankton production in the waters surrounding these coral reefs, and the relative stability of the coastal environment through the year may be responsible for this development (D'Croz & Robertson 1997). Despite this oligotrophic condition, plankton has a fundamental role for coral reefs in various ways. Planktivory is an important source of energy and nutrients for reef corals. The analysis of the stomach content of the Caribbean coral Montastrea cavernosa indicated that copepods and meroplanktonic larvae are commonly ingested by the polyps (Porter 1974), and up to 10% of the daily energy requirement may be gained through planktivory (Muscatine & Porter 1977). Zooplankton may also be an important feeding resource for other reef organisms, such as the reef-slope fish community which usually feed on pelagic zooplankton rather than on benthic organisms (Williams et al. 1988). In addition, the early life stages of corals, fish, and many other reef organisms are an important portion of the coastal plankton community.
Since the Isthmus of Panamá is subjected to marked seasonal patterns in rainfall and wind regimes, it would seem logical to anticipate distinctive seasonal cross-shelf variations in water quality and plankton distribution, which could affect the San Blas coral reefs. Rainfall and runoff are frequently mentioned as the main source of environmental gradient for coral reef ecosystems near the continental lands (Birkeland 1987), runoff being particularly important for plankton as it is the source of land-derived inorganic nutrients in the coastal zone. Therefore, higher plankton production is expected to occur nearshore, and to be correlated with peak rainfall and runoff. But also, wind-induced sea surface water movements are important processes which may affect the distribution of plankton and fish larvae near coral reef habitats (Williams & English 1992). Conditions for the aggregation of plankton are given when water fronts are developed between coastal and oceanic water masses (Thorrold 1992, Kingsford et al. 1991), eddies are topographically induced by small islands and reefs (Wolanski & Sarsenski 1997), and Langmuir convective cells are generated by wind friction over the surface of the sea (Hamner et al. 1988).
In this study, we use data collected from two years of weekly samplings in a reef area at San Blas Point, and samplings over a larger area during two oceanographic cruises in the vicinity of San Blas Point. These two data sets were gathered to assess whether, within the apparent environmental stability surrounding these coral reefs, there are seasonal coastal ocean processes which can induce variation in the cross-shelf gradients in water quality, and promote the aggregation and retention of plankton, fish eggs, and fish larvae in the coral reef environment.
Materials and Methods
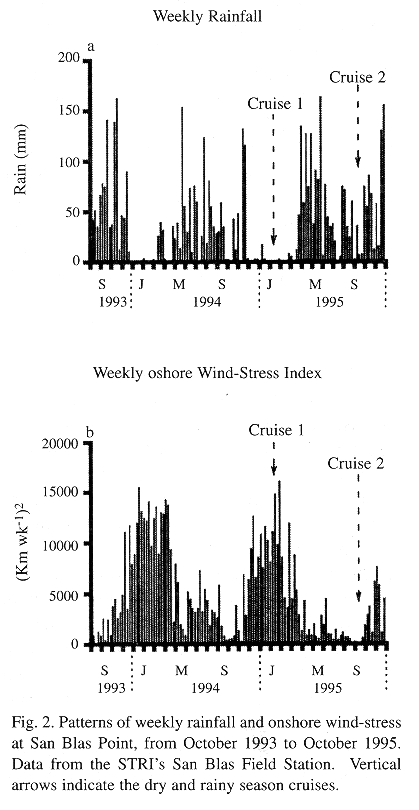
Study area: The study area consisted of a section of the continental shelf in the San Blas Archipelago, Caribbean Panamá 9° N, 79° W (Fig. 1), where there is extensive coral reef development (Shulman & Robertson 1996, Clifton et al. 1997). The mainland coastline is mangrove-bordered. The archipelago is formed by an arc of numerous small coral islands and shoaling sand cays extending for 175 Km (Wells 1988). The shelf in the study area is relatively narrow: from 13 to 21 Km. The tidal range in the Panamanian Caribbean coast is small (< 0.5 m), with a complex seasonal pattern of change between diel and semi-diel tides of varying amplitudes. Also, the effects of onshore wind on shoreline sea level often overpower those of the tidal regime (Cubit et al. 1989). The climate of the region is governed by the Inter-Tropical Convergence Zone (ITCZ), an area of low atmospheric pressure. The position of the ITCZ determines the seasonal pattern of rainfall and wind in the area as follows: between May and December, which is Panamá's rainy season, the ITCZ is located over or slightly to the north of Panamá, and winds are light and variable in direction (Fig. 2). Between mid December and mid April, the ITCZ moves to a position slightly south of Panamá, which then experiences its dry season, a period when strong onshore northeast tradewinds predominate. Mean annual rainfall at the Smithsonian Tropical Research Institute (STRI) marine station, near San Blas Point, is 2,155 mm (annual mean from 1992-1996). Over 90% of the annual rainfall occurs from May to December (Fig. 2).
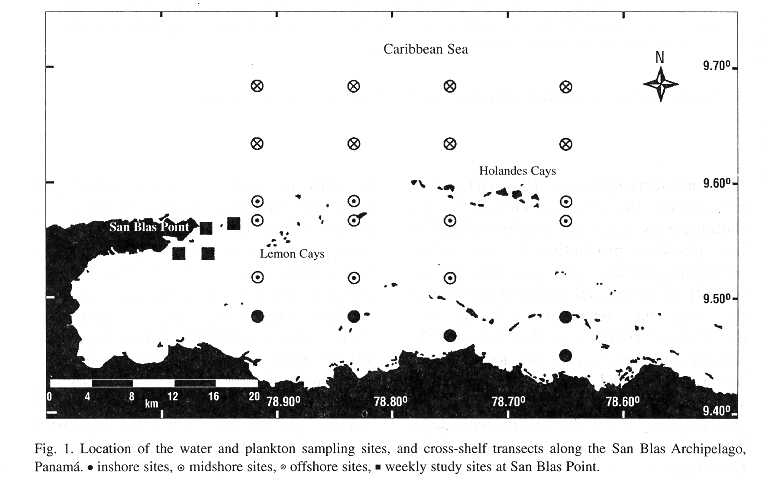
Collection of data: Weekly samples of zooplankton and seawater were collected at four sites near San Blas Point (Fig. 1), from October 1993 to September 1995. Collections were performed between 08:00 - 12:00 h. Water samples were collected using Niskin samplers at surface, 5 m, 10 m, and 20 m depth. Two liters of each water sample were membrane filtered (0.45µm) immediately after the collection for chlorophyll a analysis. A volume of 250 mL of the filtrate was set apart and frozen for further analysis of dissolved inorganic nutrients. Zooplankton was sampled with 0.5 m diameter standard net, 300 µm mesh, fitted with digital General Oceanic flowmeter to measure the volume of water sampled. At each site, duplicate oblique tows were made during 30 minutes from 20 m depth to the surface. The net was towed at approximately 1 knot.
Additionally, two cruises were carried out to the San Blas Archipelago aboard the STRI's R/V Urracá. The first cruise, from February 16 to 23, 1995, was made in the middle of the dry season; whereas the second cruise, from October 8 to 14, 1995, was made nearly half way through the rainy season (Fig. 2). Four cross-shelf sampling transects were run through the archipelago during each cruise (Fig.1). Samples were taken between 07:00 and 18:00 h. The site closest to the shoreline was 1.8 Km from the coast (8 m depth), and the farthest 28.5 Km, over the shelf slope, where the bottom was at 800 m. Between 5 and 6 sampling sites were GPS positioned along each transect, with the number of sampling sites depending on the topography of the shelf. The offshore sites were separated by 3 Km, whereas the inshore sampling sites were 1 to 2 Km apart. Adjacent transects were between 7.5 and 11.0 Km apart. In our analyses of spatial pattern the shelf was arbitrarily divided into three zones: inshore (within 6 Km of the coast), midshore (7 - 18 Km from the coast), and offshore (more than 18 Km from the coast). Zooplankton was collected using 1 m diameter standard nets, 400 µm mesh, fitted with TSK mechanical flowmeters. At each site, two simultaneous oblique net tows were made from 20 m depth to the surface at the lowest speed of the vessel (1-2 knots) for a period of 30 minutes. The collected plankton was preserved in a 5% formalin solution diluted in seawater and saturated with borax. From two to three water samples for the analysis of dissolved inorganic nutrients, and chlorophyll a were collected with Niskin samplers from the upper 20 m of the water column at each site (usually 0, 10, 20 m depth). Plankton and water samples were processed as indicated for the weekly samples.
Laboratory methods and data analysis: Each zooplankton sample was entirely sorted for fish larvae and then subdivided in a Folson splitter as far as 1/64 until the last two sub-samples had approximately 2,000 to 3,000 individual plankters. Organisms in both sub-samples were counted and sorted into major taxa and their density per cubic meter was calculated. The dry weight of zooplankton samples was obtained after the entire plankton sample, megaloplankton and micronekton removed, was rinsed with distilled water to remove salts and the preservative, oven-dried at 60°C for 24 hours, and weighted by means of a balance (precision + 0.1 mg). For chlorophyll analysis, membrane filters with the phytoplankton were ground with a Teflon pestle. Pigments were extracted with 90% acetone. The absorbance of the extract was measured in 5 cm cuvettes by spectrophotometry following the method of Parsons et al. (1984). Water samples were analyzed for nitrite-nitrate, and phosphate following Parsons et al. (1984). Wind direction and velocity data was obtained from the STRI field station, near San Blas Point, and onshore wind-stress was calculated as: (Km of onshore wind d-1)2. Analysis of variance (ANOVA) and matrix of pairwise comparison probabilities (MPCP), with Bonferroni adjustment (Wilkinson 1990), were applied to compare the cross-shelf and seasonal distribution of: (a) dissolved inorganic nutrients, (b) zooplankton density and dry weight, (c) concentration of chlorophyll a, and (d) density of fish eggs and larvae.
Results
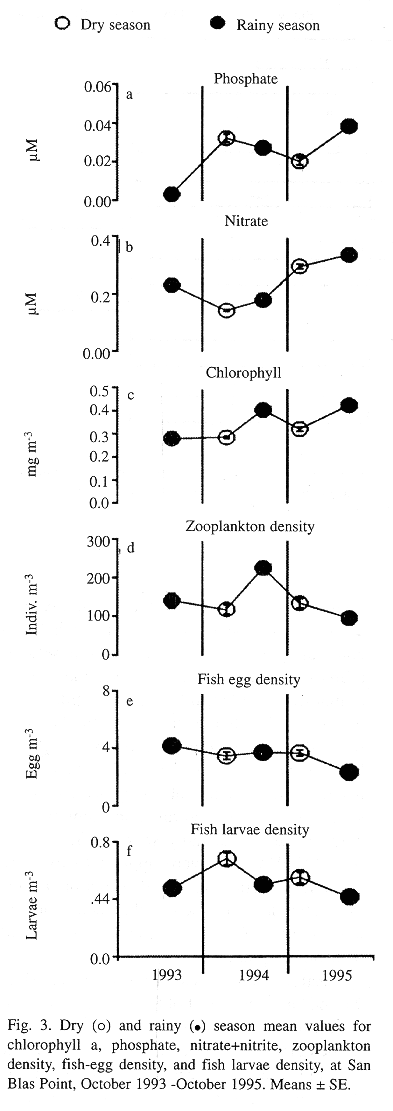
Weekly patterns of dissolved nutrients, chlorophyll a, zooplankton, and fish eggs and larvae: The weekly measurement of water quality at four sites near San Blas Point's coral reefs did not reveal a marked seasonal pattern of fluctuations in most of the variables, yet some changes are obvious, such as interannual differences (Fig. 3). The concentration of dissolved inorganic nutrients was very low during the entire period of study (Figs. 3a and 3b). For example, the mean concentrations of phosphate and nitrate between 1993-95 were 0.03+0.01 µM, and 0.27+0.01 µM, respectively. However, some increase in the concentration of dissolved nutrients, particularly in nitrate, was observed during 1995 (Fig. 3b). The concentration of chlorophyll a is the only of these variables which might suggest some seasonality at San Blas Point, the highest concentration being during the second half of each year (Fig. 3c). Chlorophyll a mean concentration for the two years period was 0.36 mg m-3 , twice the mean calculated from measurements during the two cruises to the archipelago (0.18 mg m-3). Both zooplankton and fish-egg densities showed similar patterns of variation, however no seasonal trend was evident (see Figs. 3d and 3e). Also, the density of larval fish did not show any obvious seasonal pattern (see Fig. 3f). No significant relationships were neither observed between these variables and wind stress, nor with rainfall.
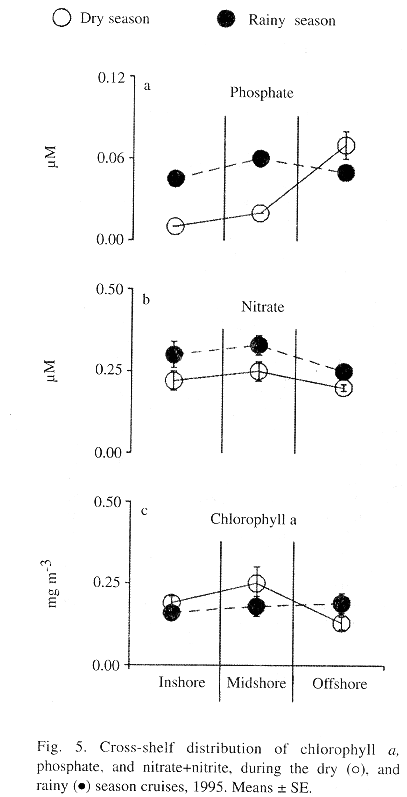
Spatial and seasonal patterns: The concentration of dissolved inorganic nutrients in samples taken during both cruises was low. Phosphate concentrations showed significant seasonal differences in the inshore and midshore zones (Fig. 4) concentrations being higher during the rainy season (Fig. 5a). During the dry season, however, there was a lower concentration of phosphate in the nearshore zone than in the offshore zone (Fig. 4). Surprisingly, nitrate did not show a similar seasonal pattern (Fig. 5b). Its concentrations along the shelf were very similar during both seasons. The concentration of chlorophyll a in the entire area was rather low throughout both seasons (Fig. 5c). Evidence of cross-shelf gradient in chlorophyll a was found only during the dry season, when concentrations in the midshore sites were higher than at offshore sites (Fig. 4). There was no cross-shelf contrast in chlorophyll a during the rainy season (Fig. 4).
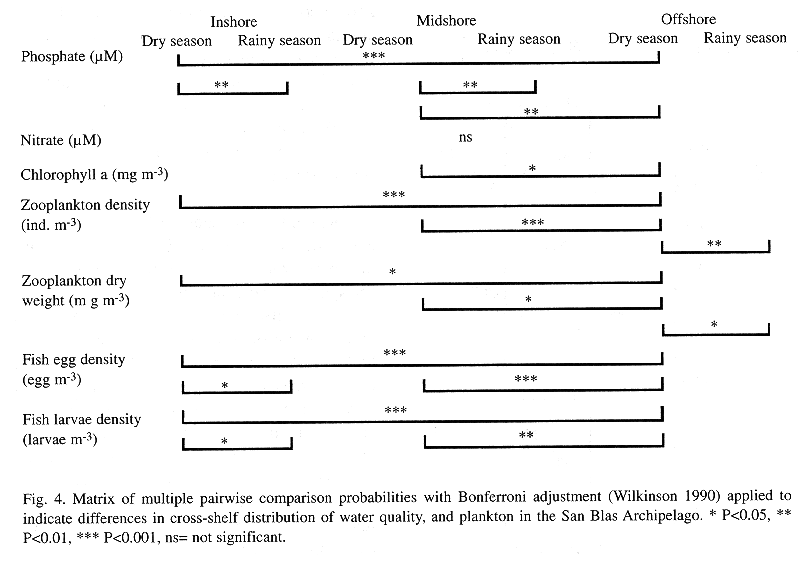
Spatial and seasonal differences in the distribution of zooplankton were also observed (Fig. 6). Densities of zooplankton at the inshore and midshore sites were higher than those found at the offshore sites during the dry season (Fig. 4). However, this pattern was not observed during the rainy season. Zooplankton biomass showed the same trends in cross-shelf distribution (Figs. 6a and 6b, see Fig. 4). Calanoid copepods clearly dominated the zooplankton community during the two cruises, representing from 22% to almost 57% of the plankton counts (TABLE 1). Cross-shelf distribution of calanoid copepods showed significant variability only during the dry season when their density at the inshore and midshore sites was 2 times higher than that observed at the offshore sites. During the rainy season, inshore and midshore density of calanoid copepods is significantly reduced.
Density of major zooplankton taxa (ind m-3) collected across the shelf in the San Blas Archipelago during the February (dry season), and October (rainy season) cruises, 1995.*
| | | | ||||
| Taxa | | | | | | |
| Invertebrates | ||||||
| | 0.50 + 0.08 | 0.58 + 0.34 | 0.00 + 0.00 | 0.76 + 0.24 | 0.15 + 0.05 | 0.52 + 0.09 |
| | 49.38 + 18.03 | 38.33 + 7.23 | 56.47 + 13.88 | 22.03 + 3.36 | 27.05 + 10.67 | 33.94 + 5.55 |
| | 5.05 + 1.98 | 1.54 + 0.42 | 0.59 + 0.25 | 1.76 + 0.22 | 0.50 + 0.31 | 0.78 + 0.17 |
| | 6.05 + 2.49 | 9.37 + 2.31 | 3.03 + 0.80 | 10.15 + 2.62 | 1.90 + 0.73 | 6.20 + 1.25 |
| | 3.95 + 1.36 | 1.03 +< 0.38 | 3.08 + 1.42 | 1.00 + 0.53 | 0.81 + 0.24 | 1.25 + 0.26 |
| | 2.35 + 1.12 | 0.50 + 0.22 | 1.21 + 0.26 | 0.78 + 0.13 | 0.71 + 0.23 | 0.72 + 0.23 |
| | 1.23 + 0.33 | 1.31 + 0.21 | 2.06 + 0.67 | 2.83 + 0.56 | 1.13 + 0.32 | 2.78 + 0.45 |
| | 1.30 + 0.48 | 0.56 + 0.41 | 1.38 + 0.81 | 1.52 + 0.46 | 0.71 + 0.18 | 0.73 + 0.08 |
| | 6.91 + 4.27 | 0.00 + 0.00 | 2.26 + 0.41 | 0.66 + 0.27 | 0.24 + 0.17 | 0.50 + 0.00 |
| | 1.17 + 0.37 | 1.21 + 0.20 | 0.91 +0.26 | 1.51 + 0.33 | 0.88 + 0.30 | 1.83 + 0.75 |
| | 5.63 + 1.59 | 1.40 + 0.61 | 1.50 + 0.35 | 0.99 + 0.26 | 0.59 + 0.21 | 1.46 + 0.23 |
| | 1.10 + 0.93 | 1.24 + 0.17 | 0.37 + 0.07 | 2.01 + 0.36 | 0.39 + 0.10 | 1.50 + 0.40 |
| | 1.83 + 0.58 | 1.67 + 0.56 | 1.71 + 0.34 | 2.76 + 0.47 | 0.96 + 0.28 | 3.18 + 0.43 |
| | 1.04 + 0.38 | 0.85 + 0.18 | 0.21 + 0.02 | 1.42 + 0.60 | 0.34 + 0.25 | 0.72 + 0.02 |
| | 5.66 + 1.12 | 3.96 +0.88 | 4.19 + 0.72 | 2.94 + 0.38 | 0.64 + 0.19 | 2.10 + 0.35 |
| | 0.38 + 0.04 | 1.00 +0.14 | 0.77 + 0.15 | 0.90 + 0.11 | 0.26 + 0.08 | 1.03 + 0.18 |
| Fishes | ||||||
| | 7.19 + 2.76 | 3.05 + 0.62 | 5.90 + 1.86 | 3.77 + 0.76 | 0.68 + 0.18 | 2.02 + 0.13 |
| | 0.18 + 0.07 | 0.07 + 0.02 | 0.14 + 0.02 | 0.10 + 0.02 | 0.04 + 0.01 | 0.05 + 0.01 |
Mean values + standard error.
As with most of the other variables that were considered, a cross-shelf pattern of variation in the distribution of fish eggs was only observed during the dry season cruise (Fig. 4). During the dry season, fish-egg abundance declined from the nearshore sites toward the offshore sites (Fig. 6c). Also, fish-egg density was greatly reduced at the inshore sites during the rainy season.
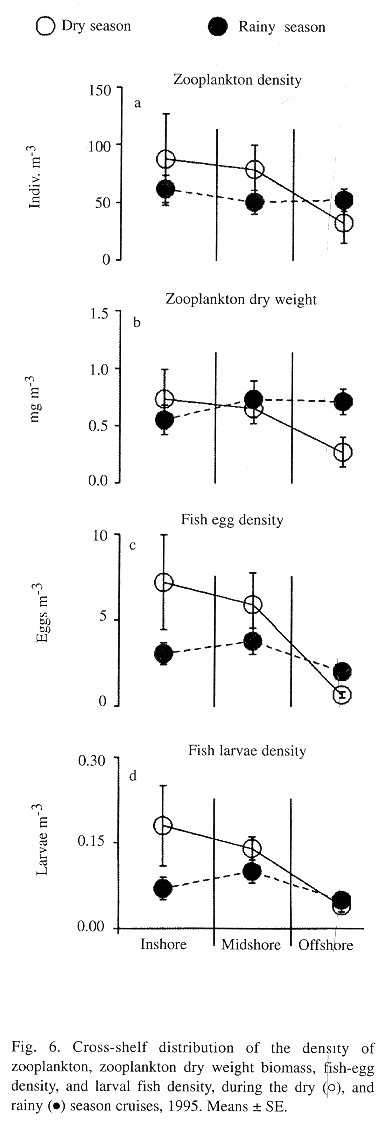
Thirty seven taxa of fish larvae were identified, 31 during the dry season (n=2,390) and 25 during the rainy season (n=1576). The majority of these were in their early planktonic stages, mostly pre-flexion. Clupeids were by far the most abundant fish larvae collected and accounted for 39% and 25% of the ichthyoplankton during the dry and rainy season, respectively (Tables 2 and 3). Eight fish families: the clupeid, gobiid, carangid, pomadasid, sciaenid, blenniid, gobiesocid and pomacentrid; were the most abundant taxa and accounted for nearly 80% of the fish larval community in collections from both seasons (Tables 2 and and . Among these, the gobiid, pomadasid, blenniid, gobiesocid, and pomacentrid fish are considered to be coral reef fish. During the dry season, offshore sites had lower larval fish densities than both inshore and midshore sites (Fig. 4). No cross-shelf gradient of larval fish density was evident during the rainy season (Fig. 4, Fig. 6d). ANOVA tests were applied to examine possible variation in the distribution of the most abundant taxa across the shelf gradient, and none of them showed cross-shelf distribution gradients.
Major taxa of larval fish collected across the shelf in the San Blas Archipelago, during the February (dry season) cruise, 1995.
| | ||||||
| Taxa | | | Cum. (x + SE) | |||
| | | | | | ||
| Clupeidae** | | | | | | |
| Gobiidae* | | | | | | |
| Pomadasyidae* | | | | | | |
| Carangidae** | | | | | | |
| Blenniidae* | | | | | | |
| Sciaenidae*** | | | | | | |
| Gobiesocidae* | | | | | | |
| Pomacentridae* | | | | | | |
| Scaridae* | | | | | | |
| Thunnidae** | | | | | | |
| Serranidae* | | | | | | |
| Ophidiidae* | | | | | | |
| Labridae* | | | | | | |
| Sparidae* | | | | | | |
| Gempylidae** | | | | | | |
| Holocentridae* | | | | | | |
| Sphyraenidae* | | | | | | |
| Balistidae* | | | | | | |
| Syngnathidae* | | | | | | |
| Tetraodontidae* | | | | | | |
| Lutjanidae* | | | | | | |
| Engraulidae *** | | | | | | |
| Atherinidae*** | | | | | | |
| Scorpaenidae* | | | | | | |
| Exocoetidae** | | | | | | |
| Hemiramphidae** | | | | | | |
| Mugilidae*** | | | | | | |
| Belonidae** | | | | | | |
| Bregmacerotidae** | | | | | | |
| Argentinidae** | | | | | | |
| Synodontidae*** | | | | | | |
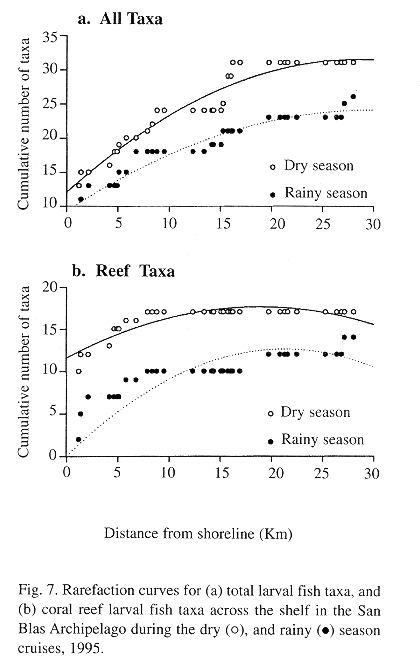
Rarefaction curves for all fish larvae (Fig. 7a) indicated that most of the fish diversity was concentrated at the inshore and midshore sites, particularly during the dry season when the bulk of taxa were concentrated inshore. During the rainy season the rarefaction curve has a lower slope which does not reach stability along the entire cross-shelf transects. Rarefaction curves for coral reef fish taxa (Fig. 7b) suggest that the largest ichthyoplankton diversity is reached nearshore during the dry season, and that the diversity curve is stabilized near the shelf's break during the rainy season.
Major taxa of larval fish collected across the shelf in the San Blas Archipelago,
during the October (rainy season) cruise, 1995.
| | ||||||||
| Taxa | | | | | ||||
| | | | | | ||||
| Clupeidae** | | | | | | | ||
| Sciaenidae*** | | | | | | | ||
| Atherinidae*** | | | | | | | ||
| Pomadasyidae* | | | | | | | ||
| Carangidae** | | | | | | | ||
| Gobiidae* | | | | | | | ||
| Labridae* | | | | | | | ||
| Exocoetidae** | | | | | | | ||
| Blenniidae* | | | | | | | ||
| Holocentridae* | | | | | | | ||
| Thunnidae** | | | | | | | ||
| Microdesmidae*** | | | | | | | ||
| Syngnathidae* | | | | | | | ||
| Lutjanidae* | | | | | | | ||
| Engraulidae*** | | | | | | | ||
| Mullidae** | | | | | | | ||
| Serranidae* | | | | | | | ||
| Pomacentridae* | | | | | | | ||
| Bothidae*** | | | | | | | ||
| Bregmacerotidae** | | | | | | | ||
| Sphyraenidae* | | | | | | | ||
| Balistidae* | | | | | | | ||
| Carapidae** | | | | | | | ||
| Centropomidae*** | | | | | | | ||
| Fistulariidae* | | | | | | | ||
Discussion
The Archipelago of San Blas is an oligotrophic environment. This situation is evident in view of the low concentration of dissolved inorganic nutrients and chlorophyll a, particularly in the midshelf zone where San Blas Point is situated and most of the coral reefs are concentrated. Levels of dissolved inorganic nutrients and chlorophyll a are comparable to previous measurements in this area by D'Croz & Robertson (1997), and also to those in other coral reef environments, as the central Great Barrier Reef in Australia (Furnas et al. 1990). The oligotrophic condition of the waters surrounding the San Blas coral reefs is well conserved because of the low anthropogenic impact on the watershed. The mean concentration of chlorophyll for the two year weekly study at San Blas Point was 0.36 mg m-3 which is below the 0.5 mg m-3 suggested by Bell (1991) as the threshold value for eutrophication in coral reef environments. This is in contrast with other reef environments in the Caribbean Sea where evident manifestations of eutrophication related to sewage disposals are indicated to reduce coral growth, and where concentration of chlorophyll was in the range of 0.42-1.04 mg m-3 (Tomascik & Sander 1985). However, neither the nutrient data nor the chlorophyll concentration from San Blas illustrate extensive enrichment, and values here reported are in agreement with measurements of oceanic chlorophyll in the Caribbean Sea using the CZCS (Hallock & Elrod 1988). Also, the mean density of zooplankton and the dry weight biomass are comparable to those reported for coral reef environments elsewhere (e.g. Great Barrier Reef,
Hamner et al. 1988)
Data from the two cruises indicates that a modest increase of nutrients (phosphate) occurs at the nearshore sites during the rainy season. This increase is likely to be related to larger fresh water discharge from rivers during this season. However, the effect is small, and dissapears within 10 Km of the shoreline. In contrast, however, all of the cross-shelf changes in the plankton community were evident during the dry season. Trends in plankton distribution across the shelf indicated higher plankton abundance nearshore, and much less offshore. This dry season cross-shelf gradient is consistently found with chlorophyll a, zooplankton density and dry weight biomass, fish-egg density, and larval fish density. However, no such gradient in plankton distribution was evident during the rainy season. These results raise the question as to what is the source of these seasonal contrasts, since rainfall and terrestrial runoff often are considered to be the most important driving force of environmental gradients on the shallow shelf, particularly in coral reef systems near the mainland (Birkeland 1987). Although the cruise's data indicated a significant increase of phosphate nearshore during the rainy season, this did not represent an extensive enrichment because chlorophyll a concentrations along the transects were low during during the rainy season (Fig. 5). This suggests that the potential effect of freshwater runoff in San Blas is restricted to a relatively narrow (~10 Km wide) nearshore band, and does not affect the midshore zone where most of cays and the best developed reefs are situated (Wells 1988). This explains why no marked seasonality was detected during the weekly study of dissolved inorganic nutrients and chlorophyll at San Blas Point, which is also in the mid-shelf zone. As suggested by D'Croz & Robertson (1997), the limited effect of freshwater runoff on plankton production on this shelf might be related to several conditions, including: (a) the mountain range is relatively close to the coastline, and thus the water catchment area is reduced, (b) the effect of predominant onshore NE winds on the EW oriented coastline may contribute to induce a baroclinic longshore current which restricts the effect of runoff to a narrow band flowing along the coastline. This hydrographic feature is reported to affect other coral reef habitats in the western Caribbean Sea, i.e. the Mosquitia off the Nicaraguan coast (Murray et al. 1988), where the influence from freshwater runoff is restricted to only a few kilometers off the coast. In Panamá, onshore northerly winds are intense during the dry season and are reported to pile up water and to increase the water level over nearshore reef flats (Cubit et al. 1989), and (c) open-coastal areas (such as the San Blas Archipelago) are generally well flushed which minimizes the effect of land-derived nutrients (Pastorok & Bilyard 1985).
The marked cross-shelf patterns in the distribution of zooplankton observed during the dry season, but not the rainy season, suggest wind as a causative mechanism for the aggregation of zooplankton, fish-eggs, and fish larvae in the San Blas inner-shelf. Zooplankton density and biomass likely vary according to weather conditions affecting the San Blas Archipelago. If there are intense and consistent onshore winds (dry season) zooplankton becomes aggregated inshore, while when winds are weak and variable in direction (rainy season) zooplankton is dispersed more evenly across the shelf. This might also have important effect on cross-shelf variation in distribution of coral reef fish larvae. The fact that during the dry season the distribution of larval fish is significantly higher at the inshore and midshore sites when compared to offshore sites gives the impression that fish larvae are driven and retained inshore by wind-induced surface water movements, and this results in a aggregation of a large number of taxa in the nearshore. Reef larval fish taxa were particularly numerous nearshore during the dry season, indicating aggregation rather than ocean dispersion. On the contrary, during the rainy season this cross-shelf gradient is lost. Although this mechanism is not necessarily applicable to settlement of competent reef fish larvae, it provides a clue to the advection and retention of earlier fish larval stages in an area with a profusion of coral reefs. Nonetheless, the role of wind stress may not only be restricted to this seasonal effect on cross-shelf distribution of fish larvae, since studies elsewhere (Milicich 1994) have been successful in finding a correlation between wind stress and the changes in the level of competent coral reef fish larval supply.
Acknowledgements
The authors are grateful to the following persons and institutions for their support for this study: the STRI's Research Opportunity Fund and Marine Environmental Science Program; E. Berminghan who kindly invited us to participate in the October, 1995 cruise; J.B. Del Rosario, and K. Kaufmann for data analysis; P. Góndola, C. Guevara and H. Collazos for laboratory assistance; J.R. Villaláz and R. Merel for field assistance; J.L. Maté, S. Piontkovski, B. Kwiecinski, E. King, C. Huerkamp for comments on the manuscript; an anonymous reviewer from RBT provided comments and suggestions which improved the manuscript; Captain D. West and the crew of the R/V Urracá for their collaboration during the cruises; and the Republic of Panamá, and the Kuna Nation for granting us the permits to carry out this research in the San Blas Archipelago.
Resumen
Con el propósito de investigar posibles cambios estacionales en la calidad del agua y en la distribución del plancton se realizaron colectas semanales en un área de arrecifes coralinos. En adición, se llevaron a cabo alrededor del sitio de estudio, dos cruceros oceanográficos cubriendo un área geográfica mayor durante condiciones estacionales extremas. La información obtenida corrobora que el área de estudio es un ambiente oligotrófico. Los muestreos de mayor escala geográfica indican la presencia de variación estacional en los gradientes de plancton, huevos y larvas de peces a lo largo de la plataforma continental, lo que posiblemente está relacionado con los fuertes vientos del norte típicos de la estación seca. Aunque un limitado enriquecimiento con nutrientes ocurre en el área cercana a la costa durante la estación lluviosa, la mayor densidad y biomasa del plancton se observó durante la temporada seca. Larvas de numerosas taxa de peces se recolectaron en las áreas cercana a la costa durante la estación seca, lo que sugiere un proceso de concentración estacional. Sin embargo, durante la estación lluviosa ocurrió una distribución más homogénea de larvas a lo largo de la plataforma continental y en aguas adyacentes.
References
Bell, P.R. 1992. Eutrophication and coral reefs - Some examples in the Great Barrier Reef Lagoon. Wat. Res. 26: 553-568 [ Links ]
Birkeland, C. 1987. Nutrient availability as a major determinant of differences among coastal hard-substratum communities in different regions of the tropics, p. 45-90. In C. Birkeland (ed.). Differences between Atlantic and Pacific tropical marine coastal ecosystems: community structure, ecological processes, and productivity. Rep. Marine Sci., UNESCO, Paris. [ Links ]
Clifton, K.E., K. Kim, J.L. Wulff. 1997. Field guide to the Reefs of Caribbean Panamá with an emphasis on western San Blas. Proc. 8th Int. Coral Reef Symp. 1: 167-184 [ Links ]
Cubit, J.D., H.D. Caffey, R.C. Thompson, D.M. Windsor. 1989. Meteorology and hydrology of a shoaling reef flat on the Caribbean coast of Panamá. Coral Reefs 8: 59-66 [ Links ]
D'Croz, L. & D.R. Robertson. 1997. Coastal oceanographic conditions affecting coral reefs on both sides of the Isthmus of Panamá. Proc. 8th Int. Coral Reef Symp. 2: 2053-2058 [ Links ]
Furnas, M.J., A.W. Mitchell, M. Gilmartin & N. Revelante. 1990. Phytoplankton biomass and primary production in semi-enclosed reef lagoons of the central Great Barrier Reef, Australia. Coral Reefs 9: 1-10 [ Links ]
Hallock, P. & J.A. Elrod. 1988. Oceanic chlorophyll around carbonate platforms in the western Caribbean; Observations from CZCS data. Proc. 6th Int. Coral Reefs Symp. 2: 449-454 [ Links ]
Hamner, W.M., M.S. Jones, J.H. Carleton, I.R. Hauri & D. McB Williams. 1988. Zooplankton, planktivorous fish, and water currents on a windward reef face: Great Barrier Reef, Australia. Bull. Mar. Sci. 42: 459-478 [ Links ]
Kingsford, M.J., E. Wolanski & J.H. Choat. 1991. Influence of tidally induced fronts and Langmuir circulations on distribution and movements of presettlement fishes around a coral reef. Mar. Biol. 109: 167-180 [ Links ]
Milicich, M.J. 1994. Dynamic coupling of reef fish replenishment and oceanographic processes. Mar. Ecol. Prog. Ser. 110: 135-144 [ Links ]
Murray, S.P., H.H. Roberts & M.H. Young. 1988. Control of terrigenous-carbonate facies transitions by baroclinic coastal currents - Nicaragua, p. 289-304. In L.J. Doyle & H.H. Roberts (ed.). Carbonate-clastic transitions. Developments in sedimentology 42. Elsevier Sci. Publ. [ Links ]
Muscatine, L. & J.W. Porter. 1977. Reef corals: mutualistic symbioses adapted to nutrient-poor environments. BioScience 27: 454-460 [ Links ]
Parsons, T.R., Y. Maita & C.M. Lalli. 1984. A manual of chemical and biological methods for seawater analysis. Pergamon, New York. 173 pp. [ Links ]
Pastorok, R.A. & G.B. Bilyard. 1985. Effects of sewage pollution on coral-reef communities. Mar. Ecol. 21: 175-189 [ Links ]
Porter, J.W. 1974. Zooplankton feeding by the Caribbean reef-building coral Montastrea cavernosa. Proc. Second Int. Coral Reef Symp. 1: 111-125 [ Links ]
Shulman, M.J. & D.R. Robertson. 1996. Changes in the coral reefs of San Blas, Caribbean Panamá: 1983 to 1990. Coral Reefs 15: 231-236 [ Links ]
Thorrold, S.R. 1992. Coupling of hydrography and pre-settlement reef fish distributions in the central Great Barrier Reef Lagoon. Proc. 7th Int. Coral Reefs Symp. 1: 629-635 [ Links ]
Tomascik, T. & F. Sander. 1985. Effects of eutrophication on reef-building corals. I. Growth rate of the reef-building coral Montastrea annularis. Mar. Biol. 87: 143-155 [ Links ]
Wells, S.M. 1988. Coral reefs of the World. Vol 1: Atlantic and Eastern Pacific. UNEP Reg. Seas Directories and Bibliographies. IUCN Publ., Switzerland and U.K./UNEP, Kenya. 373 p. [ Links ]
Wilkinson, L. 1990. SYGRAPH:. the system for graphics Systat, Evanston, Illinois. 547 p. [ Links ]
Williams, D. McB, P. Dixon & S. English. 1988. Cross-shelf distribution of copepods and fish larvae across the central Great Barrier Reef. Mar. Biol. 99: 577-589 [ Links ]
Williams, D. McB. & S. English. 1992. Distribution of fish larvae around a coral reef: direct detection of a meso-scale, multi-specific patch? Cont. Shelf Res. 12: 923-937 [ Links ]
Wolanski, E. & J. Sarsenski. 1997. Larvae dispersion in coral reefs and mangroves. Am. Sci. 85: 236-241 [ Links ]
1 Smithsonian Tropical Research Institute, Box 2072, Balboa, Panamá
2 Departamento de Biología Marina y Limnología, Universidad de Panamá, Estafeta Universitaria, Panamá. Fax (507)2280516; dcrozl@si.edu

