


 texto em
  Inglês (pdf)
 Artigo em XML
 Referências do artigo
 Enviar este artigo por email
 Citado por SciELO
  Similares em
SciELO
Similares em
SciELO 
 Permalink
INTRODUCTION
Economic development, urbanization, and the dependence on fossil fuels, as a means of obtaining energy, have led to the deterioration in air quality in both developed cities as well as in industrial growing cities (Zhao et al., 2013). Anthropogenic activities are the main source of high concentrations of pollutants in the atmosphere (Yang et al., 2017, Wang et al., 2017 & Fujii et al., 2016).
Sulfur dioxide (SO2), nitrogen oxides (NOx), and Total Suspended Particles (TSP) are three of the main types of anthropogenic pollutants most frequently found in the atmosphere. Not only do SO2 and NOx hinder visibility, but they also generate adverse effects on human health and in the preservation of the constantly exposed ecosystem. Some of the consequences of these gaseous emissions are: a) Production of acid rain, b) Destruction of the ozone layer and an c) Increase in tropospheric ozone (Marć et al, 2016, Yang et al., 2018 & Ying et al., 2007).
On the other hand, other pollutants, such as TSPs, have generated great interest in terms of their composition as they can contain carcinogenic substances, such as some volatile organic compounds. Similarly, TSPs act as precursors in the formation of secondary aerosols (Hu et al., 2019), in addition to altering the vertical extension, life and optical properties of clouds by forming condensation nuclei and consequently, the composition of precipitation (Joos et al., 2017).
The main source of anthropogenic NOx and SO2 emissions is the combustion of fossil fuels and coal, represented in biomass burning, the main source of emissions (Fioletov et al., 2015). With regard to TSPs, their sources are varied and their composition is quite complex, as they can be comprised of volatile organic compounds, as well as inorganic complexes, some of which may be toxic to human health, such as lead (Chen et al., 2015).
Soil erosion, ocean motion and wildfires are three of the main TSP sources (Ayrault et al., 2010 & Ali et al., 2012). In addition to anthropogenic sources, there are natural sources that contribute to gaseous emissions, for example, the higher impact of NOx resulting from microbial activity in soils and lightning discharge from electrical storms (Zhang, 2012). SO2, on the other hand, is released naturally mainly by volcanic activity (Ge et al., 2017).
Continued NOx and SO2 inhalation can cause cardiorespiratory problems such as arrhythmia, worsening of existing respiratory problems like asthma, as well as higher susceptibility of getting a respiratory infection. Continued exposure to TSPs can also generate the same health effects as NOx and SO2; however, contingent upon their composition, they may be associated even with the development of lung cancer (McGranahan, 2012).
As for Costa Rica, the main commercial and industrial activities concentrate in the Greater Metropolitan Area (GAM). While this region covers only 3.8 % of the territory, it is home to 70 % of the vehicle fleet, 60 % of the population and 85 % of the industry, according to data from the National Institute of Statistics and Censuses (INEC, 2016). Characterized by radial growth, this area has given way to the conurbation of the four main cities, Alajuela, Heredia, San José and Cartago (Herrera et al., 2016).
According to the 2011 Pollutant Emissions Inventory of Costa Rica, 418663 tons of carbon monoxide (CO) were generated in the GAM, as well as 64640 tons of nitrogen oxides (NOx), and 6149 tons of PM10, with light-duty vehicles accounting for more than half of the PM10 particles and private cars as the main NOx and CO generators (Herrera et al., 2017).
The amount of air pollution must be quantified to determine the level of the problem and to generate actions in the field of air quality management. There are different methodological tools to calculate the amount of pollutants in the environment, such as monitoring systems and emissions inventories.
Moreover, they serve as technical input to create correlational studies, using modeling techniques, and to suggest alternatives for reducing pollution (Herrera et al., 2016). The main objective of this research is to elaborate a preliminary inventory of gaseous NOX, SO2 and TSP emissions released from chimneys in different companies in Costa Rica, identifying those industrial sectors with the most pollutant emissions.
The information gathered will facilitate decision-making to improve air quality and serve as preliminary input for a baseline concentration of NOX, SO2 and TSP emissions from the industrial sectors studied.
METHODOLOGY
Study population
The sampling points correspond only to stationary sources (chimneys) of gaseous and solid emissions (SO2, NOX and TSP) in companies from different industrial sectors. These companies are classified according to the International Standard Industrial Classification (ISIC Code) (National Institute of Statistics and Censuses, 2016). SO2, NOx and TSP measurements were carried out over a period of two years (2014 and 2015). The classification of industries evaluated is shown in the following Table.
Table 1 Classification of production sectors, sector ID and number of industries evaluated in the 2014-2015 period
| Production sector | Identification | Amount of industries in 2014 | Amount of industries in 2015 |
|---|---|---|---|
| Human healthcare activities | A | 2 | 1 |
| Accommodation | B | 2 | 2 |
| Building construction | C | 1 | 1 |
| Food products manufacturing | D | 29 | 23 |
| Tobacco products manufacturing | E | 1 | 1 |
| Technical tests and analyses | F | 1 | 0 |
| Manufacturing of soaps and detergents, etc. | G | 0 | 1 |
| Garment manufacturing | H | 2 | 0 |
| Manufacturing of pharmaceutical products, chemical medicinal products, etc. | I | 2 | 1 |
| Manufacturing of textile products | J | 1 | 1 |
| Manufacturing of chemical substances and products | K | 1 | 1 |
| Glass and glass products manufacturing | L | 1 | 1 |
| Metal casting | M | 1 | 1 |
| Total | - | 44 | 32 |
Note: Our own source
SO 2 , NO X and TSP sampling
For the measurement of NOx and SO2, the Testo 350 equipment was used, which allows for measuring at high gas concentrations and handles changes in differential pressure and speed to achieve flow measurements (Testo, 2019 & Xie et al., 2019). For TSP quantification, a portable APEX particle counter with high-range data recording and ease of handling was used (Zamtsu, 2019). The quantification of the concentrations for the study parameters is carried out in situ, using the equipment described above.
Data processing
The information was collected on an Excel sheet, namely, industry name, location, number of sampling points, sampling date, as well as data from the emissions sampling such as: flow (m3/h), SO2 (mg/Nm3), TSPs (mg/Nm3), NOx (mg/Nm3), SO2 (tons/year), TSPs (tons/year), NOx (tons/year). The statistical analysis and graphs were generated in the R programming language, in the R Studio interface, with the ggplot2, rgeos and rgdal data packages; ensuring a better agglomeration of results for interpretation purposes.
Quantification of emissions
To quantify the emissions from the tested chimneys, each fixed industrial source was subjected to an average with respect to the number of samplings carried out. In the case of several fixed sources from the same company, the values are added to determine their total emissions and the total contribution by production sector (Table 1). This value is then transformed using Equation 1 into an annual projection of pollutant tons. The conversion factor is composed of the hours-to- year conversion multiplied by the milligrams-to-tons-of-pollutant conversion, as shown in the following equation:

Equation 1. Determining the annual pollutant concentration in tons/year
ANALYSIS AND RESULTS
Study population
According to Table 2, 151 samples were obtained in both years, namely 78 chimneys from 44 companies in 2014, and 91 chimneys from 32 companies in 2015. Most of the samples were obtained in 2014. Food products manufacturing accounted for the most industrial samples, with 29 companies in 2014 and 22 companies in 2015.
Table 2 Number of samples, chimneys, companies and industrial sectors evaluated
| Amount | 2014 | 2015 |
| Samples | 92 | 59 |
| Chimneys | 78 | 91 |
| Companies | 44 | 32 |
| Industrial sector | 12 | 10 |
Note: Our own source.
On the contrary, only one company was evaluated from the following industrial sectors: Building construction, manufacturing of tobacco products, manufacturing of textile products, substance manufacturing and chemical products, glass and glass products manufacturing, and metal casting.
Gaseous NO x emissions
Graph 1 contains industrial NOx concentration data (tons/year) released during the period studied, with 2015 as the year with the highest amount of emissions. Of the 13 industrial sectors, 11 had NOx concentrations under 50 tons/year, which correspond to human healthcare activities, accommodation, building construction and technical tests and analyses and had concentrations of 1.36, 0.85, 0.43 and 0.24 tons/year, respectively, for the year 2014, and 0.30, 1.02, and 0.28 tons/year for the year 2015. (No evaluations were carried out for the technical testing and analyses sector during the year 2015).
Lower NOx emission contributions are explained by the minimum energy and heat demands required by these sectors due to the nature of their production process, with industrial sectors mainly engaged in public services as opposed to product manufacturing.
On the other hand, the glass manufacturing, glass products and food products manufacturing sectors accounted for the highest industrial gaseous NOx emissions, with concentrations of 904.19 and 1246.14 tons/year, respectively, for the year 2014, and of 1630.99 and 991.16 tons/year in 2015.

Note: Our own source.
Graph 1 NOx concentration in tons/year for the different production sectors sampled in Costa Rica, for the years 2014 and 2015. (Graph A: Production sectors between 0 and 30 NOx tons/year; Graph B: Production sectors between 250 and over 1500 tons/year).
Those higher concentrations are explained by the fact that combustion of different sources such as fossil fuels, natural gas and coal, as well as the burning of biomass to obtain energy (Souri et al., 2016; Fan et al., 2017) produce NOx. These industrial sectors have a high production volume and non-stop process and operation schedules requiring high temperatures.
These operating characteristics are the main cause of the high NOx emission values (Hu et al., 2019). Furthermore, they indicate that the glass manufacturing, glass products and food products manufacturing sectors contain the largest number of industries sampled. In particular, the glass and glass products manufacturing sector present a raw material smelting process, for which temperatures between 1000 °C and 1500 °C (Garrido et al., 2019) are required.
Other industrial sectors, such as soap manufacturing (with 17.45 tons/year in 2015) and pharmaceutical products manufacturing (with 12.74 tons/year in 2014 and 33.05 tons/year in 2015), report intermediate NOx values due to their minimal calorific requirement to complete reactions and/or syntheses and for product manufacturing purpose when compared to other industrial sectors (Hu et al., 2019).
In the case of the garment and textile product manufacturing sectors, values of 12.94 and 7.57 tons/year are reported for 2014, respectively, and 11.90 tons/year only for the textile products manufacturing sector for 2015. These values correspond to the high electricity consumption used for conversion into mechanical energy, in addition to the use of calorific energy for the different heating processes (Khude, 2017).
Gaseous SO 2 emissions
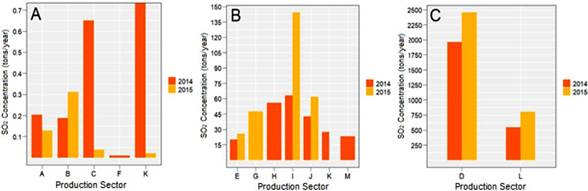
Graph 2 contains data on the industrial SO2 concentration (tons/year) released during the period studied, with 2014 as the year with the highest amount of emissions. Of the 13 industrial sectors, 4 had SO2 concentrations under 0.70 tons/year, and 7 presented concentrations between 70 and 150 SO2 tons/year.
Note: Our own source.
Graph 2 SO2 concentration in tons/year for the different production sectors sampled in Costa Rica, for the years 2014 and 2015. (Graph A: Production sectors between 0.0 and 0.7 SO2 tons/year; Graph B: Production sectors between 15 and 150 SO2 tons/year; Graph C: Production sectors between 250 and over 2500 SO2 tons/year).
With the lowest concentrations in human healthcare activities and technical tests and analyses, presenting emissions of 0.20 and 0.011 tons/year in 2014, respectively, and 0.13 tons/year for the human healthcare sector in 2015. These values are explained mainly by the limited energy and calorific demand in their production processes, as well as the final service provided (customer service).
On the other hand, the food products manufacturing, glass and glass products manufacturing sector accounted for the highest gaseous SO2 emissions, with concentrations of 1959.94 and 547.29 tons/year, for the year 2014, 2453.60 and 804.05 tons/year, respectively, for 2015 (Graph 2, in graph C). These two industrial sectors present high SO2 values due to the high production temperatures (1000 °C to 1500 °C), with higher fuel combustion, thus generating greater sulfur dioxide concentrations.
In contrast, industrial sectors such as soap manufacturing, pharmaceutical products manufacturing, textile product and garment manufacturing have intermediate SO2 emission values (Graph 2, Graph B), which is mainly due to their low energy requirements -and lower combustion temperatures and fossil fuel consumption- as a result there of.
Gaseous TSP emissions
Graph 3 contains data on the industrial TSP concentration (tons/year) released during the period studied, with 2014 as the year with the highest amount of emissions. Of the 13 industrial sectors, 11 have TSP concentrations under 5.0 tons/year, and 2 present concentrations under 700 tons/year.
The lowest concentrations correspond to the building construction and technical tests and analyses sectors, with emissions of 0.30 and 0.18 tons/year in 2014, respectively, and 0.032 tons/year, for 2015, in the case of the building construction sector. Lower TSP values (tons/year) are explained mainly by the lower energy and calorific demands in their internal processes; these industrial sectors use smaller amounts of fuel to generate heat energy (compared to the other industrial sectors).
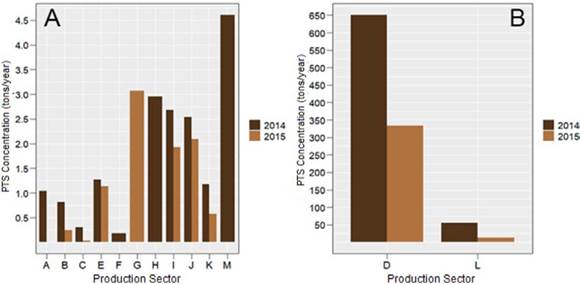
Graph 3 TSP concentration in tons/year for the different production sectors sampled in Costa Rica in 2014 and 2015. (Graph A: Production sectors between 0.0 and 4.5 TSP tons/year, graph B: Production sectors between 50 and 650 TSP tons/year). Note: Our own research source.
On the other hand, the food products manufacturing, glass and glass products manufacturing sector account for the most emissions, with concentrations 651.01 and 54.60 tons/year, respectively, for the year 2014, and 334.09 and 12.64 tons/year for 2015. These sectors (Graph 3, Graph B) show much higher values (tons/year) compared to the other sites studied mainly because of higher fossil fuel consumption in final product manufacturing.
However, higher TSP emissions were reported in the food products manufacturing sector (D), for both years, compared to the glass and glass products manufacturing sector (L). This is explained mainly due to the higher organic matter consumption in Sector D’s production process leading to a greater amount of particles, other than those from the burning of fossil fuel in both industrial sectors (D and L).
Gaseous emissions (NO X , SO 2 and TSP) from the industrial sector: Food processing
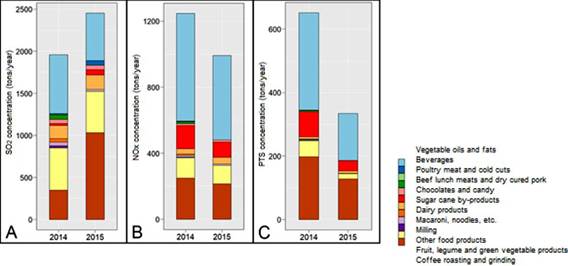
As discussed earlier, the food products manufacturing sector accounts for the highest amount of gaseous NOX, SO2 and TSP emissions for the years 2014 and 2015. The gaseous emissions for the different industrial activities comprising this sector are shown in graph 4, as well as information on pollutant concentrations in tons/year (NOX, SO2 and TSP) for those activities.
Note: Our own source.
Graph 4 Pollutant concentrations in tons/year per industrial activity comprising the food products manufacturing in Costa Rica for the years 2014 and 2015. (Graph A: SO2 concentration, graph B: NOX concentration, graph C: TSP concentration)
In total, the gaseous emissions of 29 and 22 companies (industrial activities) were quantified for the years 2014 and 2015, respectively. This industrial sector is made up of activities related to the production of oils, fats, beverages, meats, cold cuts, and cane by-products, among others.
With regard to NOX emissions, the vegetable oils and fats, sugarcane by-products, fruit and vegetable products, and coffee roasting and grinding sectors have the highest emission values, with 652.09, 140.40, 123.39, and 249.08 tons/year, respectively, for the year 2014 and 510.61, 91.88, 112.25, and 213.86 tons/year for 2015. The rest of the industrial activities comprising this sector show values under 40 tons/year, both for 2014 and 2015.
The highest gaseous emission values for these industrial activities arise from the above factors, that is, greater demand for fossil fuel consumption because of the energy requirements in final products manufacturing. In the case of sugar and vegetable oils production and coffee roasting, these activities constantly require high production temperatures throughout the process, which generates a greater amount of SO2 and NOx emissions.
As for TSP emissions, these industrial activities differ from the rest due to a larger number of particles generated in final products, such as coffee and sugar.
Total SO 2 , NO X and TSP emissions (2014 - 2015)
Graph 5 includes the total NOx, SO2 and TSP emissions for the years 2014 and 2015, with SO2 having the highest emissions in tons/year in the company’s studies for both 2014 and 2015.
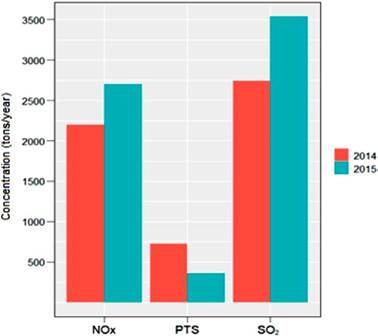
This is due to the use of bunker as the main fuel used to generate calorific energy. This fuel composition includes a 0.0 % to 3.0 % m/m sulfur percentage reported in the product chemical safety datasheet, which also indicates absence of nitrogen in its composition (Recope, 2019).
CONCLUSIONS
The gaseous SO2, NOX and TSP emissions evaluated refer to a population of 78 industrial chimneys, with 44 industrial activities assessed in the year 2014 and 32 in 2015, and classified into 13 sectors, with the food products manufacturing sector presenting the highest SO2, NOX and TSP emissions for these years.
With regard to the food products manufacturing sector, the gaseous SO2 emissions accounted for 1959.54 and 3257.64 tons/year, respectively, while TSP emissions accounted for 651.01 and 346.40 tons/year and gaseous NOX emissions presented values of 1246.14 and 2622.14 tons/year.
Vegetable oils and fats, sugarcane by-products, fruit products, legumes and vegetables, as well as coffee roasting and grinding top the list of industries with the highest emission for 2014, with 652.09, 140.40, 123.39 and 249.08 tons/year, respectively, and presented values of 510.61, 91.88, 112.25 and 213.86 tons/year for 2015, respectively.
As for the year 2015, the highest SO2 and NOX emission values reported were 3537.29 and 2695.62 tons/year, respectively, while the year 2014 reported the highest total suspended particles (355.82 tons/year).

