


 Inglés (pdf)
 Articulo en XML
 Referencias del artículo
 Enviar articulo por email
 Citado por SciELO
  Similares en
SciELO
Similares en
SciELO 
 Permalink
Introduction
Tephra or pyroclasts is one of the most easily accessible materials of active volcanoes, which may give fundamental clues about the eruptive state of the volcano (Fisher and Schmincke, 1984; Fisher, Heiken, and Hulen, 1997; Schmid, 1981; White and Houghton, 2006). There is a variety of volcanic pyroclastic material which ranges in size from extremely fine ash, following by Pele’s tears, and hair, lapilli, pumice rocks, cinder, reticulate, up to enormous blocks or bombs (Heiken, 1972; Peterson, 1979; Mangan and Cashman, 1996; Moune, Faure, and Gauthier, 2007; Parfitt, 1998). These materials are formed during subaerial volcanic processes and they may be used for the analysis of volatile contents, degassing and crystallization as well as the prediction of further eruptive processes (Cashman, Sturtevant, and Papale, 2000; Toulkeridis, Arroyo, and Cruz D’Howitt, 2015). Additionally, the interaction of water with magma and other fragmentation processes can be studied by means of the shape, grain-size, glass or mineral content of the ejected pyroclastic material (Colgate and Sigurgeirsson, 1973; Spieler, Kennedy, and Kueppers, 2004; Wohletz, 1983; Zimanowski, Buettner, and Lorenz, 1997). Low-viscosity basaltic magmas form several types of close by located volcanic cones, such as scoria cones, tuff rings, tuff cones and maars, which are usually monogenetic and often associated or in the vicinity of shield volcanoes or stratovolcanoes (Lorenz, 1986; Vespermann and Schmincke, 2000; Wood, 1980). The study of terrestrial pyroclastic deposits may play also a fundamental role in the interpretation of the activity, development and also the origin of volcanic structures located in Mars, Venus and elsewhere among other remote space objects (Filiberto, 2017; Gail and Wilson, 2015; Hynek, McCollom, and Marcucci, 2013; Morris et al., 2000; Squyres et al., 2007).
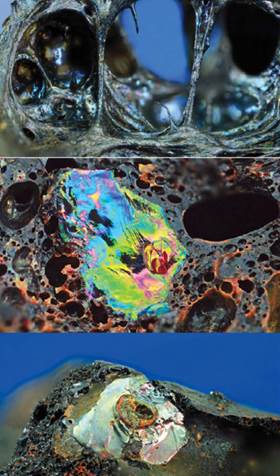
The main aim of this study was to sample and characterize a variety of cinders of visually different shiny colors (Fig.1) with the goal to discover what factors produce them. The knowledge about the reactions and processes, which have led to the color variation of these materials, occurred in a well-known geologic context, can therefore serve to determine the conditions of volcanic deposits on Mars, Venus and elsewhere (Keszthelyi, Self, and Thordarson, 2006; McCanta, Dyar, and Treiman, 2014).
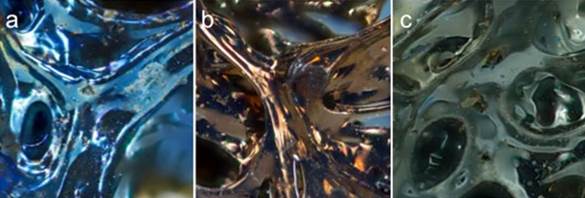
Figure 1 Three volcanic cinder showing visually different shiny metallic colors. (a) Blue, (b) Golden and (c) Silver
Theoretical Framework
The Isabela Island situated on the western margin of the Galapagos is the largest island of the archipelago with an area of 4640 km2. This island has been partially formed at about a million of years ago by the subsequent joining of six shield volcanoes, being from north to south Ecuador, Wolf, Darwin, Alcedo, Sierra Negra and Cerro Azul (McBirney and Williams, 1969; Munro and Rowland, 1996). All of them are still active volcanoes and the eruptions of four of them have been reported in the last sixty years such as at Wolf in 1963, 1982 and 2015, Alcedo in 1993, Sierra Negra in 1963, 1979, 2005 and 2018 and Cerro Azul in 1959, 1979, 1998, and 2008 (Global Volcanism Program, 2015; Toulkeridis, 2011).
The Sierra Negra volcano is a large active shield volcano, rising 1124 m above the sea level (m.a.s.l.), being situated at the south-east end of the Isabela Island in the Galapagos archipelago (Geist et al., 2008; McBirney and Williams, 1969; Simkin, 1984; Toulkeridis, 2011). This voluminous shield volcano, like most others in this area, has been formed as a result of the Galapagos hotspot activity (White, McBirney, and Duncan, 1993). However, once the volcanoes have been transported away from the hotspot they become extinct, due to the ESE movement of the overlying Nazca oceanic plate relative to the South American and Caribbean continental plates, some 1000 km to the east (Harpp and White, 2001; Hey, 1977; Holden and Dietz, 1972). Sierra Negra has a width from 60 to 40 km and an elliptical caldera that measures from 7 to almost 10 km in diameter (Amelung, Jónsson, and Zebker, 2000; Reynolds, Geist, and Kurz, 1995). It is the largest and simultaneously the second shallowest caldera of all volcanoes of the Galapagos Islands (Chadwick and Howard, 1991; White et al., 1993). Its eruptive centers and different lava fields have been subdivided into seven distinctive age groups all being younger than 5000 years old (Reynolds and Geist, 1995; Reynolds et al., 1995; Toulkeridis, 2011). These centers produce from alkaline to tholeiitic basaltic lava flows that erupted from east to northeast trending by circumstantial and radial fissures situated on both sides of the summit caldera, on the upper flanks and on the western and eastern lower flanks (Geist, Childs, and Scholl, 1988; Kurz and Geist, 1999; White et al., 1993).
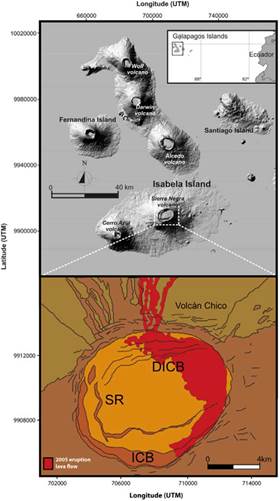
Figure 2. Above: Geographical location and shaded relief map of Sierra Negra volcano on Isabela Island, Galapagos archipelago. Below: Geologic map of the caldera of Sierra Negra Volcano with inter caldera bench (ICB), discontinuous inter caldera bench (DICB), sinuous ridge (SR), adapted fromReynolds and Geist (1995),Geist, Harpp and Naumann (2008) andToulkeridis (2011).
The caldera itself, which major axis strikes in an ENE-WSW direction, has undergone several episodes of collapse, upheaval and deformation up to recent times (Amelung et al., 2000; Chadwick, Geist, and Johnsson, 2006; Geist, Chadwick, and Johnson, 2006; Jonsson, Zebker, and Amelung, 2005; Yun, Segall, and Zebker, 2006). Particularly on the western side of the caldera floor inner parts of the caldera have been uplifted sub-parallel to the caldera rim, partially to altitudes higher than the caldera rim.
Ten historic eruptions occurred and some involved a frequently visited caldera rim fissure zone called “Volcán Chico” at the eastern outer margin of the caldera (Delaney, Colony, and Gerlach, 1973; Simkin and Siebert, 1994; Toulkeridis, 2011). These explosive phases of the past have given rise to frothy pumice, which was followed by the formation of agglutinate cones and voluminous lava flows. The former last volcanic event occurred in October 2005 when the volcano, after a repose of 26 years, erupted for about a week (Geist et al., 2008). During this event, approximately the twenty percent of the eastern caldera floor was covered, while a smaller part flowed outside the northern caldera rim (Fig. 2, Geist et al., 2008). A further most recent event occurred in 2018 (Abe, Ohki, and Tadono, 2019).
At present day, in the surroundings of Volcán Chico as well as at the western margin of an internal horst of the caldera floor there is an ongoing fumarolic activity, which is fault-controlled (Goff, McMurtry, and Counce, 2000; Goff and McMurtry, 2000; Padrón, Hernández and Toulkeridis, 2012). Four cinder samples corresponding to the eruption in October 2005 and showing predominant colors such as black, silver, golden and blue, were collected within a circular area of 1 km of radius centered at the major vent (Fig. 2). The GPS coordinates and heights where the samples were collected were 0°46’45.89’’S 91°06’56.14’’W, 993 m.a.s.l., 0°46’55.57’’S 91°06’55.95’’W, 1026 m.a.s.l., 0°46’55.84’’S 91°06’43.35’’W, 1018 m.a.s.l. and 0°46’45.22’’S 91°06’43.00’’W, 965 m.a.s.l. respectively for the samples black, silver, golden and blue.
Methodology
The crystallographic structure and elemental chemical composition of the four different cinder samples above mentioned have been determined by X-Ray Diffractometry (XRD) and Energy-dispersive X-Ray Spectroscopy (EDS) respectively, whereas the morphology analysis has been performed by Scanning Electron Microscopy (SEM). The XRD has been carried out using an Empyrean diffractometer from PANalytical operating in a θ-2θ configuration (Bragg-Brentano geometry) and equipped with a Cu X-ray tube (Kα radiation λ = 1.54056 Å) operating at 40 kV and 40 mV.
The elemental analysis has been obtained by EDS which was performed on the SEM chamber at 30 kV using a Bruker X-Flash 6|30 detector, with a 123 eV resolution at Mn Kα. The morphological analysis has been elaborated using a Tescan Mira 3 microscope equipped with a Schottky Field Emission Gun (Schottky FEG-SEM) that allows us to obtain a resolution of 1.2 nm at 30 keV. Prior XRD and EDS measurements, we carefully scraped the sample surfaces and crushed them in a mortar adding acetone (EMSURE ®) in order to avoid the local heating that may induce phase changes in the material. For the XRD, the obtained powder has been deposited in a zero background XRD holder and for EDS the powder has been fixed in a stub previously covered with two layers of double coated carbon conductive tape. The morphological analysis of the surface of the samples has been performed by fixing small fragments of cinders of around 0.125 cm3 on SEM stubs and covering them with 20 nm of a conductive gold layer (99.99% purity) using a sputtering evaporator Quorum Q150R ES.
Analysis and results
It is commonly accepted that the color of the cinders is originated by its chemical composition, however, there has not been any explanation or confirmation so far about the origin of its superficial shiny metallic colors. To clarify this issue, we have analyzed the surface of cinders of four visually different colors by using the XRD, EDS and SEM. Fig. 3 displays the XRD diffractograms obtained from the powder of cinders of four different colors. The XRD pattern do not illustrate clear peaks and the trends apparently appear to be similar for all encountered colors. Therefore, we concluded that the cinder samples do not indicate specific crystalline arrangement and there is no significant difference between different colors. The EDS measurements have been performed by considering the most common major elements represented in such volcanic samples, such as Na, Mg, Al, Si, K, Ca, Ti, Mn and Fe. In order to avoid biased determinations of the chemical compositions of the samples due to their inhomogeneity, we have averaged the spectra obtained from 10 points grid on a total area of at least 0.20 mm2. The presence of each element is denoted by the normalized weight percentage (norm. wt. %), which is the percentage in weight, supposing that the chosen elements represent the total composition of the sample. We have neglected from the calculation the presence of C and O, for which the abundance in porous samples is higher than 50% (Goldstein, Newburry, and Echlin, 1992; Sánchez-Polo et al., 2019). In order to compare the obtained EDS results, the norm. wt. % average values of each element and the standard deviation are listed in Table 1. The table clearly indicates that there are no substantial differences in the chemical composition of cinders of different colors. Considering the obtained results from XRD and EDS analysis, we may conclude that the chemical composition is lacking to be the fundamental reason of the origin of the encountered and observed superficial metallic colors for these cinders.
That leads to the consideration, that the variation in the superficial colors may be due to a well-known optical phenomenon called thin-film interference (Knittl, 1976). In such kind of interference, the light waves reflected from the top and bottom boundaries of a thin film interfere with each other, either enhancing or reducing some colors in the reflected light. In order to confirm this assumption, several pictures of the surface of the cinders have been taken by the FEG-SEM (Fig. 4). There, the surface is composed of grains of different sizes, similar to nanocrystalline diamond films, which are grown by the Chemical Vapor Deposition (CVD) technique (Daenen, Williams, and D’Haen, 2006).
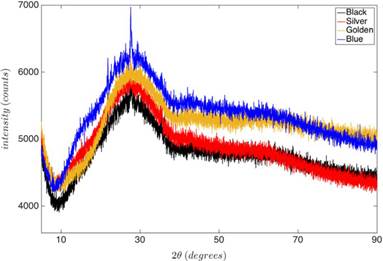
Table 1 EDS measurements (norm. wt. %).
| Norm. wt. %(%) | Blue | Golden | Silver | Black |
|---|---|---|---|---|
| Na | 6 ±1 | 6 ± 1 | 7 ±1 | 4 ±1 |
| Mg | 6 ±1 | 7 ±1 | 7 ±1 | 6 ±1 |
| Al | 13 ±1 | 12 ±2 | 13.3 ±0.4 | 12 ±1 |
| Si | 30 ±5 | 29 ±4 | 33 ±1 | 31 ±3 |
| K | 1.1 ±0.2 | 1.0 ±0.2 | 1.0 ±0.1 | 1.0 ±0.1 |
| Ca | 13 ±2 | 15 ±1 | 13 ±1 | 14 ±2 |
| Ti | 5 ±1 | 5 ±1 | 5 ±1 | 5 ±1 |
| Mn | 0.4 ±0.2 | 0.4 ±0.2 | 0.3 ±0.1 | 0.4 ±0.1 |
| Fe | 25 ±6 | 25 ±5 | 21 ±1 | 26 ±4 |
For each color, we have built a histogram based on an average of around 200 measurements. The histograms were built by taking the diameter of the circumscribed circle which determines the grain size as described in (Arroyo, Debut, and Vaca, 2016). The mean values obtained for silver, golden and blue cinders have been 180±60 nm, 150±40 nm and 100±40 nm, respectively. Black color has no grain structure (Fig. 4 (d)), and therefore no special order of interference and color predominance. The growing process seems to be similar to the nucleation of random-oriented crystals as depicted by (Williams, 2011). By imaging a transversal cut of one of these cinders (Fig. 5), it is possible to observe that the grains are contained in a thin, nano-structured layer. The thickness of this layer has a similar size as the grain size, thus confirming our interference interpretation.
Based on the aforementioned results, we are able to justify about which is the source origin and magma behavior of the sampled cinders, knowing that their color is reflecting different stages of crystallization velocity and ejection speed. That means, cinder with blue color has crystallized faster than cinder with silver or golden colors, as reflected by their smaller grain sizes (Fig. 6). This observation may also serve in the general evaluation of a hazard area around an active volcano of such ejecting such pyroclasts and even the stability of such accumulated material (Jordá-Bordehore, Toulkeridis, and Romero-Crespo, 2016; Jordá-Bordehore and Toulkeridis, 2016).
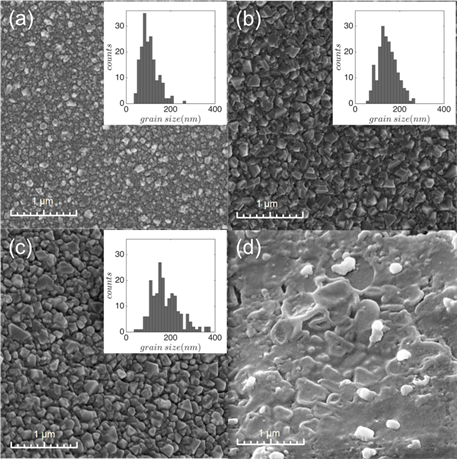
Figure 4 FEG-SEM pictures of the surface and grain size histograms taken at 10 kV for (a) Blue, (b) Golden, (c) Silver and (d) Black cinders.
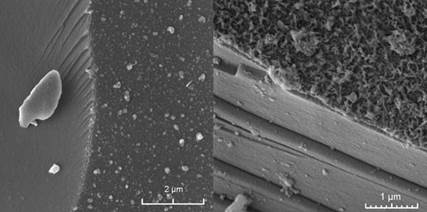
Figure 5 Sections of a cinder obtained by FEG-SEM at 10kV where one can observe a thin layer formed by grains
Furthermore, similar to analogue studies of volcanic lava tubes and other volcanic environments or features on earth compared with other planets or moons (Keszthelyi, 1995; Keszthelyi et al., 2006; Léveillé and Datta, 2010; Squyres et al., 2007; Wilson and Head, 1994) or nanoparticles (Trejos E.M. et al, 2021). The obtained results may help to better characterize similar volcanic ejecta and their origin in other planetary environments, with similar or projected climate variations and subsequent conservation stages (Jakosky and Phillips, 2001; McCanta et al., 2014; Morris et al., 2000; Poulet, Bibring, and Mustard, 2005). Recent studies and associated observations on Mars within the Gusev crater have concluded on prominent parallel layering of accumulated pyroclastic materials, practical identical in appearance and chemical compositions to those pyroclasts of Sierra Negra volcano (Brož and Hauber, 2012). Such observations of Mars confirmed in a variety of studies the eruptive styles to be mainly effusive while having the resemblance of large shield volcanoes, with several volcanic cones, like cinder cones among others identical to those of Galapagos or Hawaii (Brož and Hauber, 2012; Ghent, Anderson, and Pithawala, 2012; Gulick and Baker, 1990). They also display shallow flanks, which were interpreted to be composed of pyroclastic deposits, mainly deposited by airfall (Brož and Hauber, 2012; Gregg and Farley, 2006; Kerber, Head, and Madeleine, 2011; Kerber, Head, and Madeleine, 2012).
Conclusions
The unknown origin of the metallic shiny color of volcanic cinders has been revealed with a detailed analysis based on XRD, EDS and SEM measurements. The obtained results point out that the origin of the colors is a thin film interference effect. Furthermore, our findings reveal a lack of information about the chemical processes involved in the formation of the surface layer of cinders. Such studies on volcanic environments of hot spots are extremely useful in planetary studies with similar geodynamic settings and landscapes.

